| Param | Original file | Final file |
|---|---|---|
| Filename | modeM0/AS1A03_008T02_9000001422cztM0_level2.fits | modeM0/AS1A03_008T02_9000001422cztM0_level2_quad_clean.evt |
| Size (bytes) | 121,282,560 | 96,986,880 |
| Size | 115.7 MB | 92.5 MB |
| Events in quadrant A | 743,036 | 538,832 |
| Events in quadrant B | 729,706 | 557,518 |
| Events in quadrant C | 749,116 | 539,143 |
| Events in quadrant D | 614,360 | 464,162 |
| Mode SS | |||
|---|---|---|---|
| Quadrant | BADHDUFLAG | Total packets | Discarded packets |
| A | 0 | 254 | 0 |
| B | 0 | 256 | 0 |
| C | 0 | 246 | 0 |
| D | 0 | 248 | 0 |
| Mode M9 | |||
|---|---|---|---|
| Quadrant | BADHDUFLAG | Total packets | Discarded packets |
| A | 0 | 39 | 0 |
| B | 0 | 39 | 0 |
| C | 0 | 38 | 0 |
| D | 0 | 39 | 0 |
| Mode M0 | |||
|---|---|---|---|
| Quadrant | BADHDUFLAG | Total packets | Discarded packets |
| A | 0 | 25758 | 0 |
| B | 0 | 26410 | 0 |
| C | 0 | 25398 | 0 |
| D | 0 | 37685 | 0 |
| Quadrant | Total seconds | Saturated seconds | Saturation percentage |
|---|---|---|---|
| A | 12104 | 164 | 1.354924% |
| B | 12141 | 186 | 1.531999% |
| C | 12142 | 123 | 1.013013% |
| D | 11942 | 587 | 4.915425% |
Noise dominated data is calculated using 1-second bins in cleaned event files. If a bin has >2000 counts, and if more than 50% of those come from <1% of pixels, then it is considered to be noise-dominated and hence unusable.
| Quadrant | # 1 sec bins | Bins with >0 counts | Bins with >2000 counts | High rate bins dominated by noise | Noise dominated (total time) | Noise dominated (detector-on time) | Marked lightcurve |
|---|---|---|---|---|---|---|---|
| A | 16474 | 12421 | 0 | 0 | 0.00% | 0.00% | 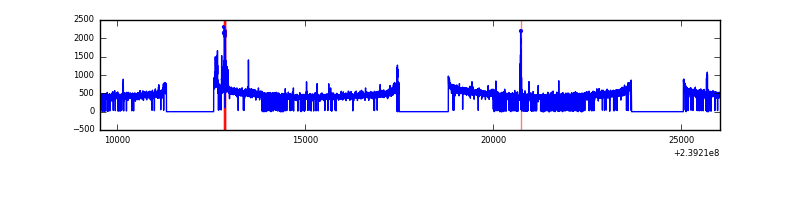 |
| B | 16473 | 12450 | 0 | 0 | 0.00% | 0.00% |  |
| C | 16474 | 12460 | 0 | 0 | 0.00% | 0.00% |  |
| D | 16474 | 12336 | 0 | 0 | 0.00% | 0.00% |  |
Top three noisy pixels from each quadrant. If the there are fewer than three noisy pixels in the level2.evt file, extra rows are filled as -1
| Pixel properties | Quadrant properties | ||||||
|---|---|---|---|---|---|---|---|
| Quadrant | DetID | PixID | Counts | Sigma | Mean | Median | Sigma |
| A | 0 | 29 | 712 | 10.67 | 193 | 183 | 49.6 |
| A | 7 | 110 | 644 | 9.3 | 193 | 183 | 49.6 |
| A | 9 | 19 | 574 | 7.89 | 193 | 183 | 49.6 |
| B | 2 | 9 | 621 | 11.06 | 192 | 185 | 39.4 |
| B | 14 | 254 | 499 | 7.97 | 192 | 185 | 39.4 |
| B | 5 | 128 | 480 | 7.48 | 192 | 185 | 39.4 |
| C | 1 | 81 | 564 | 7.2 | 197 | 185 | 52.6 |
| C | 1 | 80 | 537 | 6.69 | 197 | 185 | 52.6 |
| C | 9 | 188 | 508 | 6.14 | 197 | 185 | 52.6 |
| D | 6 | 231 | 475 | 6.61 | 175 | 160 | 47.7 |
| D | 10 | 189 | 447 | 6.02 | 175 | 160 | 47.7 |
| D | 6 | 67 | 439 | 5.85 | 175 | 160 | 47.7 |
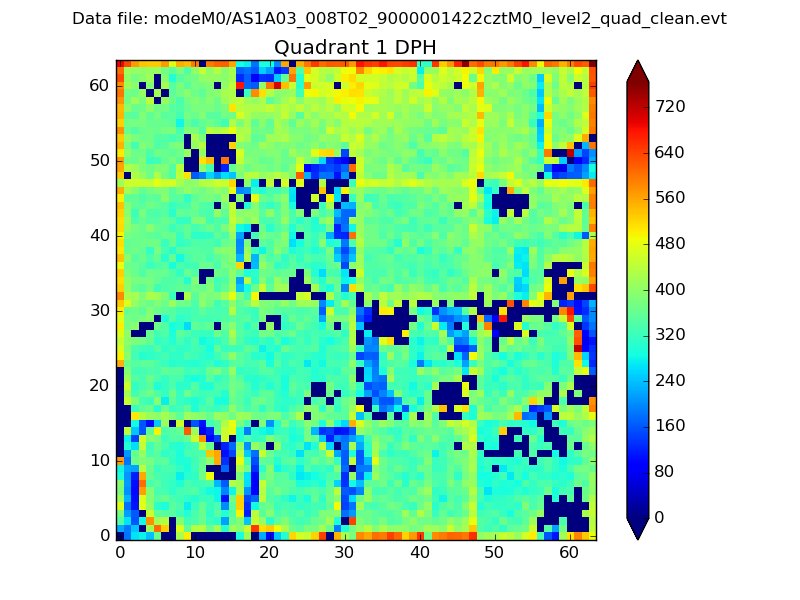
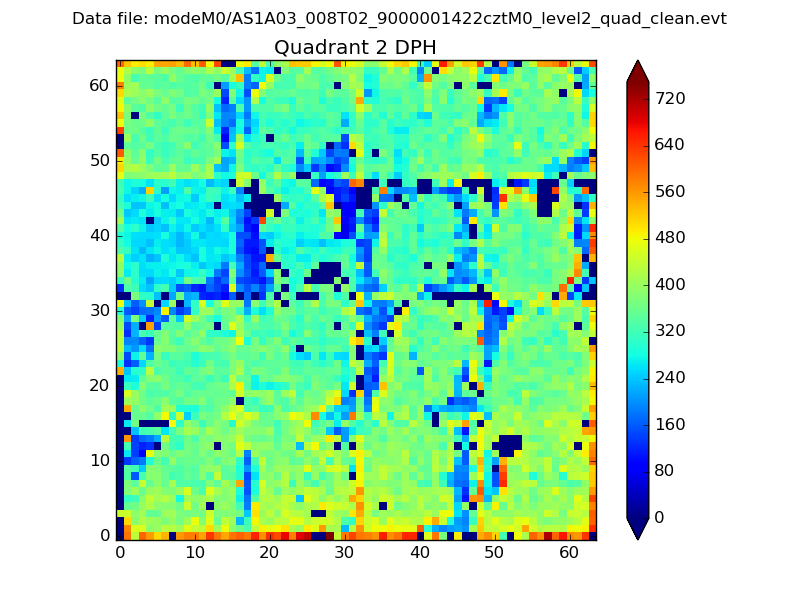
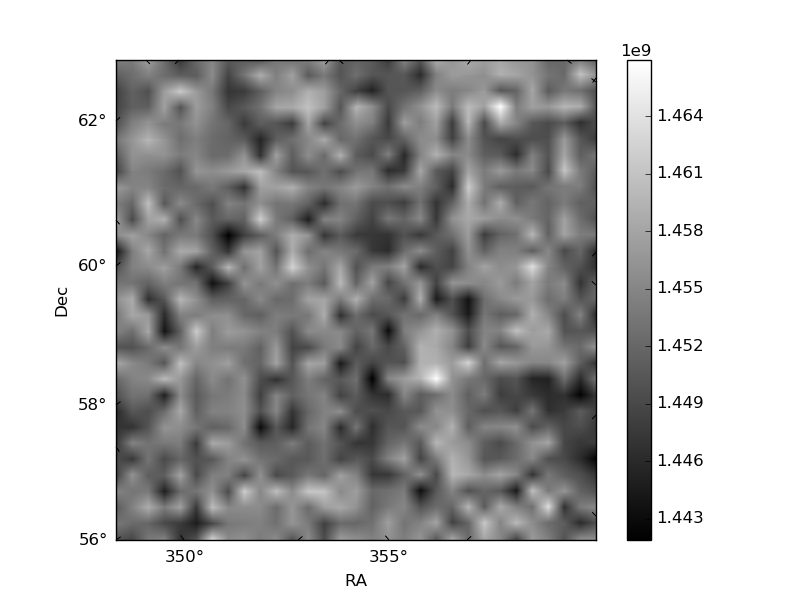
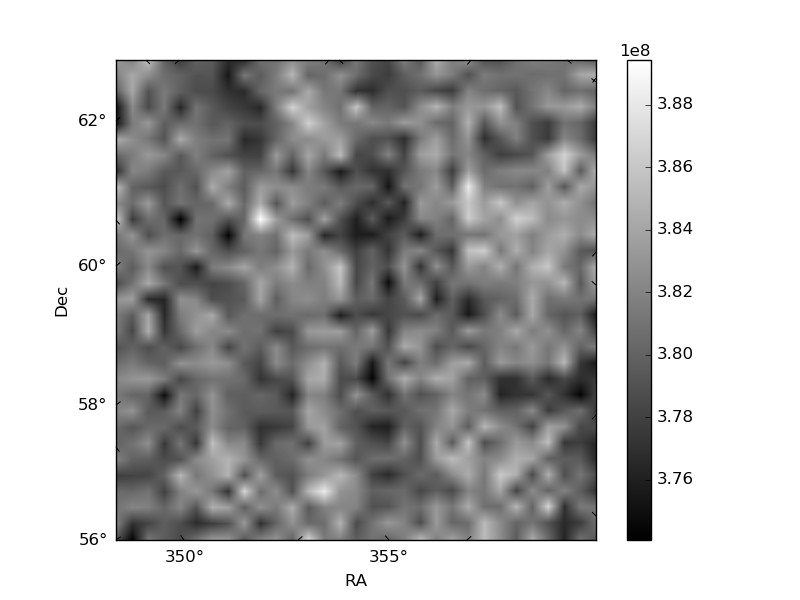
Histogram calculated using DETX and DETY for each event in the final _common_clean file
| Quadrant A |  |
 |
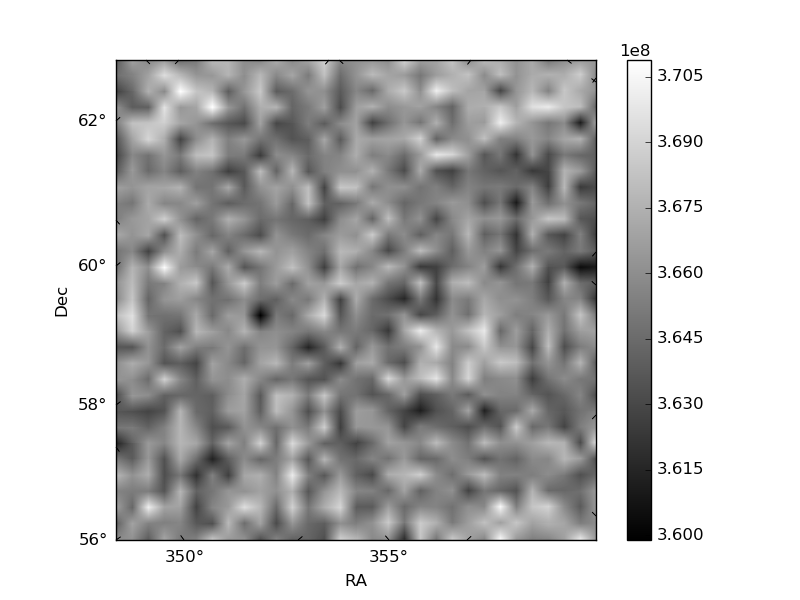
Quadrant B |
|---|---|---|---|
| Quadrant D | 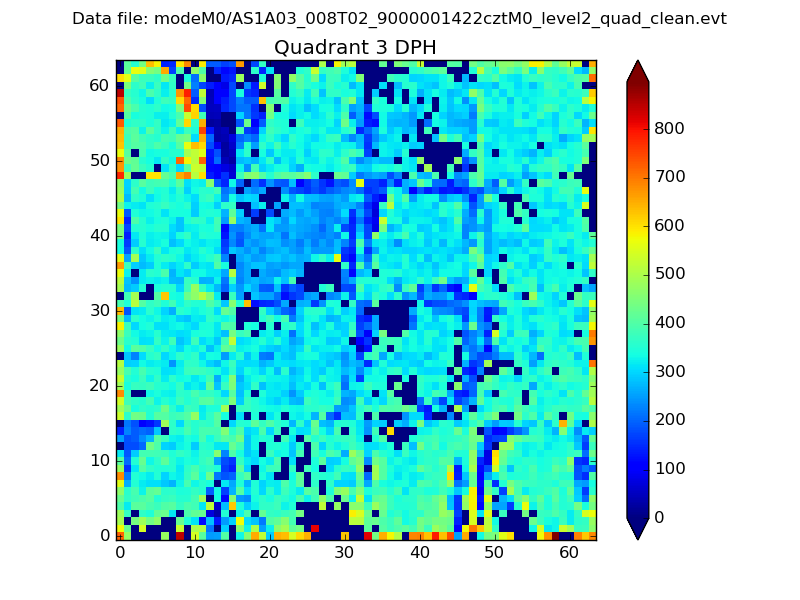 |
 |
Quadrant C |
| Plot type | Count rate plots | Images |
|---|---|---|
| Comparison with Poisson distribution Blue bars denote a histogram of data divided into 1 sec bins. Red curve is a Poisson curve with rate = median count rate of data. |
 |
 |
| Quadrant-wise count rates Data is divided into 100 sec bins |
 |
|
| Module-wise count rates for Quadrant A Data is divided into 100 sec bins |
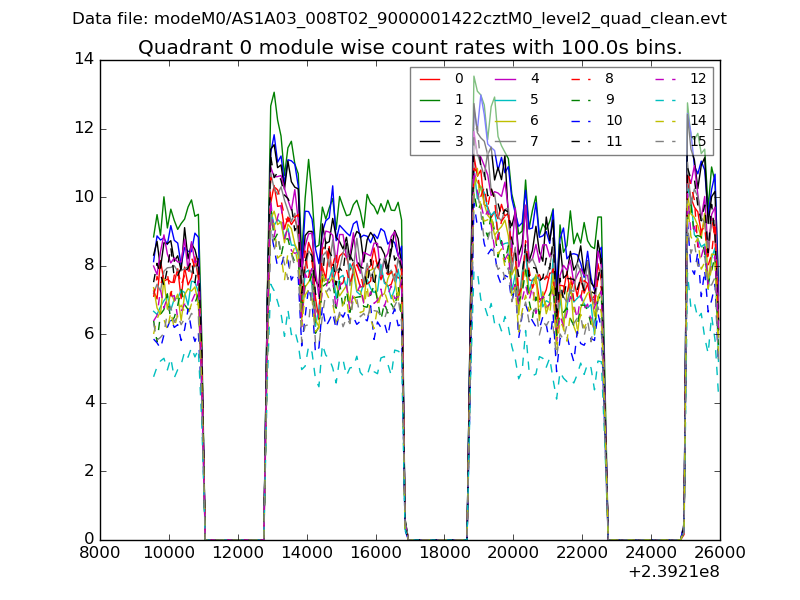 |
 |
| Module-wise count rates for Quadrant B Data is divided into 100 sec bins |
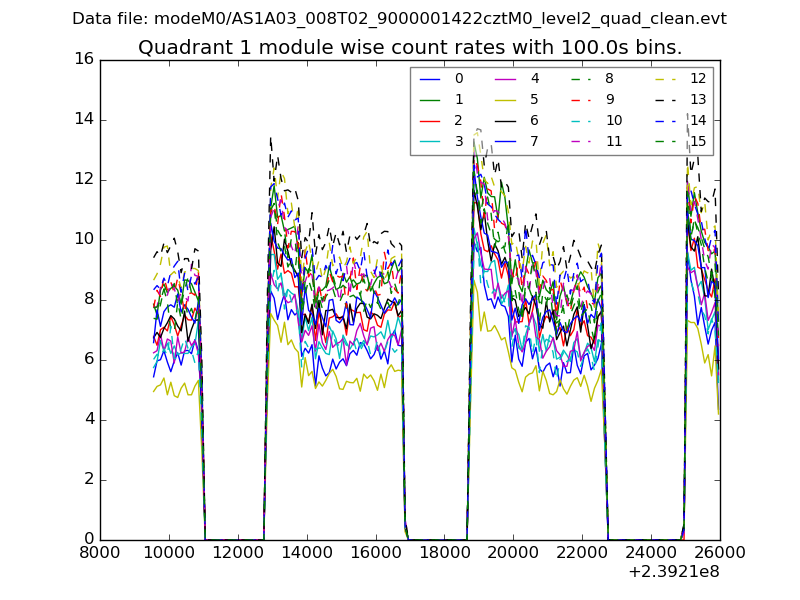 |
 |
| Module-wise count rates for Quadrant C Data is divided into 100 sec bins |
 |
 |
| Module-wise count rates for Quadrant D Data is divided into 100 sec bins |
 |
 |
| Parameter | Plot |
|---|---|
| CZT HV Monitor |  |
| D_VDD |  |
| Temperature 1 |  |
| Veto HV Monitor |  |
| Veto LLD | 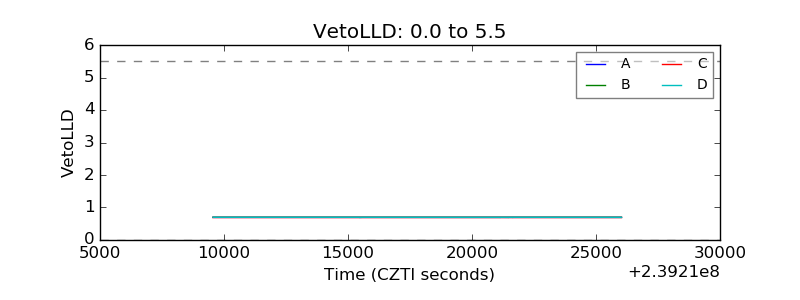 |
| Alpha Counter |  |
| _CPM_Rate |  |
| CZT Counter |  |
| +2.5 Volts monitor |  |
| +5 Volts monitor | 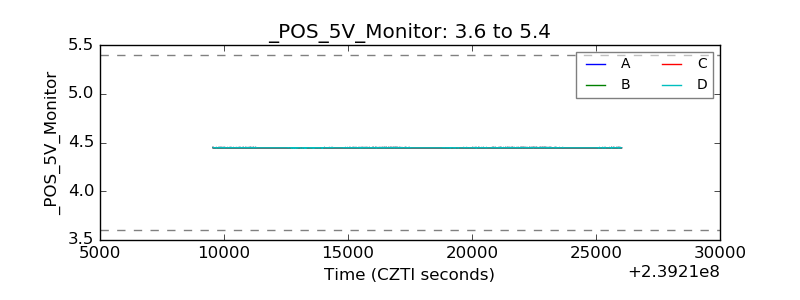 |
| _ROLL_ROT |  |
| _Roll_DEC | 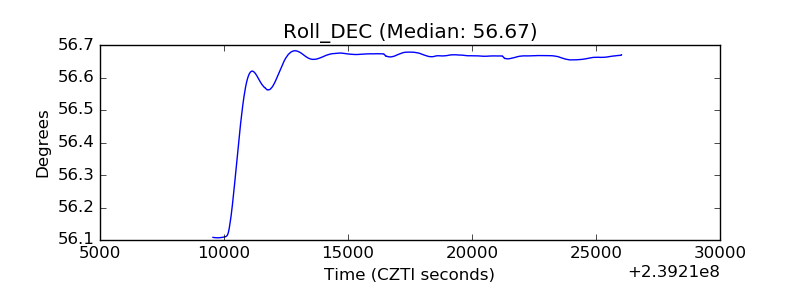 |
| _Roll_RA | 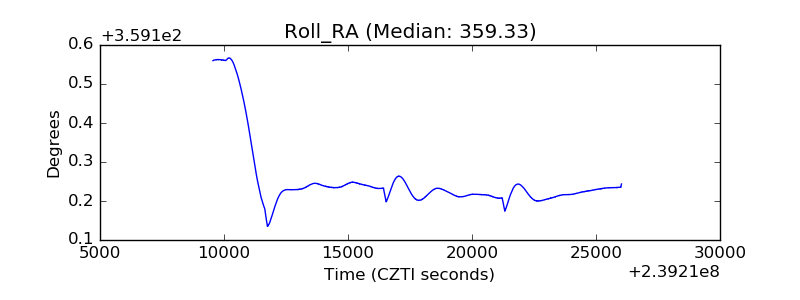 |
| Veto Counter |  |