| Param | Original file | Final file |
|---|---|---|
| Filename | modeM0/AS1A03_008T02_9000001422_09956cztM0_level2.evt | modeM0/AS1A03_008T02_9000001422_09956cztM0_level2_quad_clean.evt |
| Size (bytes) | 236,433,600 | 48,395,520 |
| Size | 225.5 MB | 46.2 MB |
| Events in quadrant A | 1,574,487 | 316,491 |
| Events in quadrant B | 1,551,617 | 324,032 |
| Events in quadrant C | 1,448,371 | 314,594 |
| Events in quadrant D | 2,380,723 | 296,678 |
| Mode SS | |||
|---|---|---|---|
| Quadrant | BADHDUFLAG | Total packets | Discarded packets |
| A | 0 | 64 | 0 |
| B | 0 | 64 | 0 |
| C | 0 | 64 | 2 |
| D | 0 | 64 | 0 |
| Mode M9 | |||
|---|---|---|---|
| Quadrant | BADHDUFLAG | Total packets | Discarded packets |
| A | 0 | 12 | 0 |
| B | 0 | 12 | 0 |
| C | 0 | 12 | 1 |
| D | 0 | 12 | 0 |
| Mode M0 | |||
|---|---|---|---|
| Quadrant | BADHDUFLAG | Total packets | Discarded packets |
| A | 0 | 6794 | 90 |
| B | 0 | 6753 | 93 |
| C | 0 | 6500 | 99 |
| D | 0 | 9475 | 212 |
| Quadrant | Total seconds | Saturated seconds | Saturation percentage |
|---|---|---|---|
| A | 3000 | 63 | 2.100000% |
| B | 2996 | 55 | 1.835781% |
| C | 2992 | 41 | 1.370321% |
| D | 2976 | 121 | 4.065860% |
Noise dominated data is calculated using 1-second bins in cleaned event files. If a bin has >2000 counts, and if more than 50% of those come from <1% of pixels, then it is considered to be noise-dominated and hence unusable.
| Quadrant | # 1 sec bins | Bins with >0 counts | Bins with >2000 counts | High rate bins dominated by noise | Noise dominated (total time) | Noise dominated (detector-on time) | Marked lightcurve |
|---|---|---|---|---|---|---|---|
| A | 4295 | 3037 | 7 | 7 | 0.16% | 0.23% | 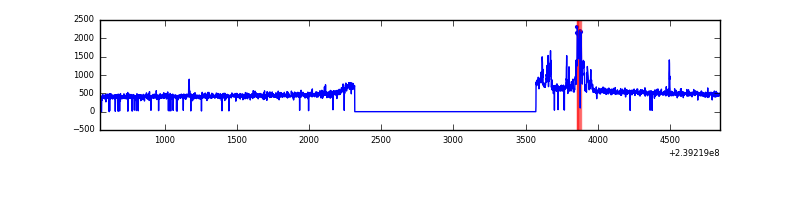 |
| B | 4295 | 3038 | 0 | 0 | 0.00% | 0.00% | 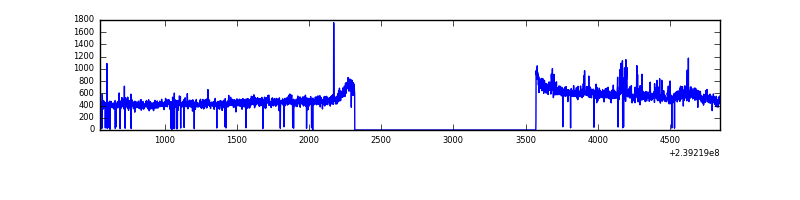 |
| C | 4295 | 3037 | 0 | 0 | 0.00% | 0.00% | 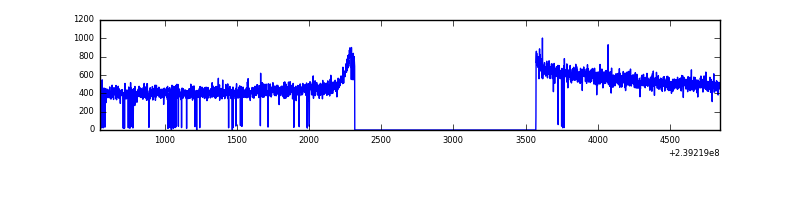 |
| D | 4295 | 3035 | 70 | 70 | 1.63% | 2.31% | 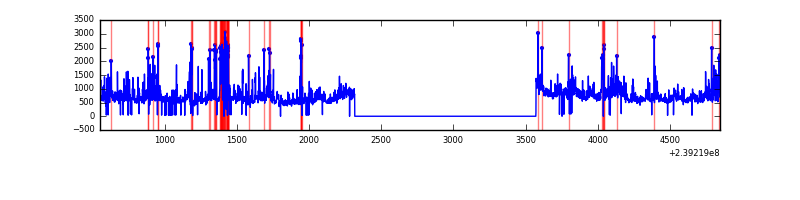 |
Top three noisy pixels from each quadrant. If the there are fewer than three noisy pixels in the level2.evt file, extra rows are filled as -1
| Pixel properties | Quadrant properties | ||||||
|---|---|---|---|---|---|---|---|
| Quadrant | DetID | PixID | Counts | Sigma | Mean | Median | Sigma |
| A | 14 | 254 | 107220 | 1343.02 | 380 | 372 | 79.6 |
| A | 13 | 251 | 4636 | 53.6 | 380 | 372 | 79.6 |
| A | 0 | 226 | 3575 | 40.26 | 380 | 372 | 79.6 |
| B | 0 | 219 | 20006 | 264.11 | 383 | 373 | 74.3 |
| B | 0 | 229 | 13140 | 171.75 | 383 | 373 | 74.3 |
| B | 4 | 48 | 9423 | 121.74 | 383 | 373 | 74.3 |
| C | 13 | 61 | 2765 | 27.91 | 371 | 372 | 85.7 |
| C | 8 | 222 | 1278 | 10.57 | 371 | 372 | 85.7 |
| C | 3 | 202 | 1005 | 7.38 | 371 | 372 | 85.7 |
| D | 1 | 52 | 563344 | 6005.06 | 362 | 352 | 93.8 |
| D | 8 | 195 | 143415 | 1525.96 | 362 | 352 | 93.8 |
| D | 12 | 233 | 102883 | 1093.63 | 362 | 352 | 93.8 |
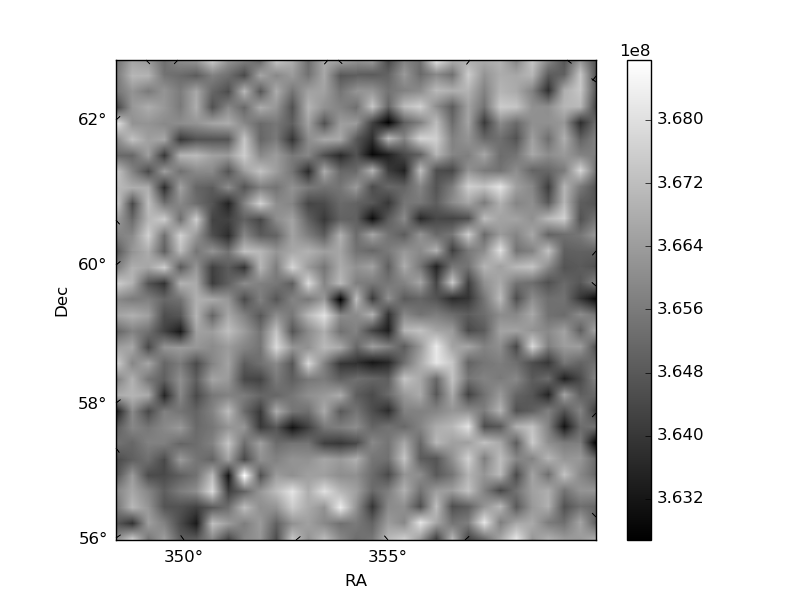
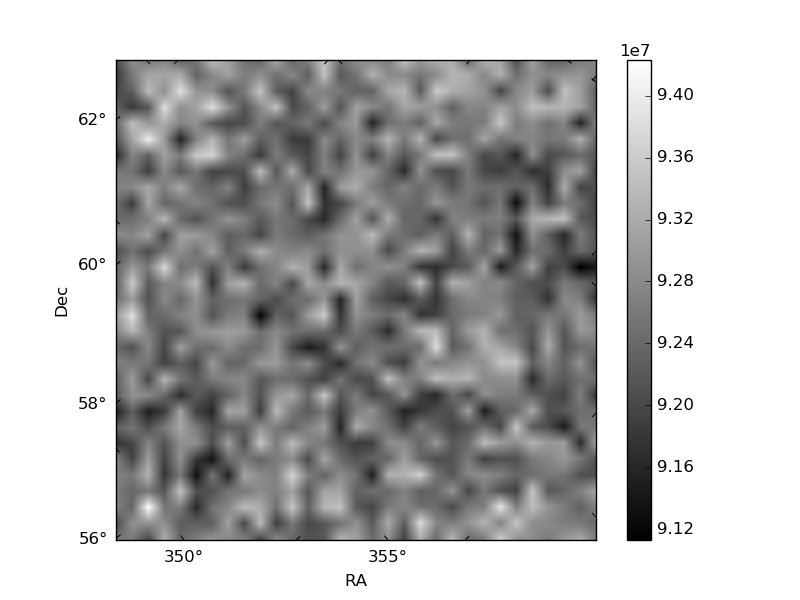
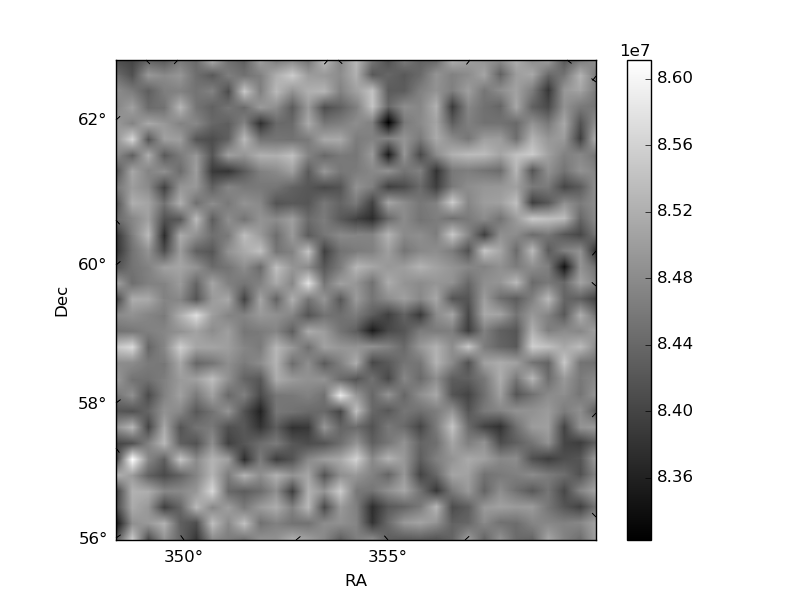
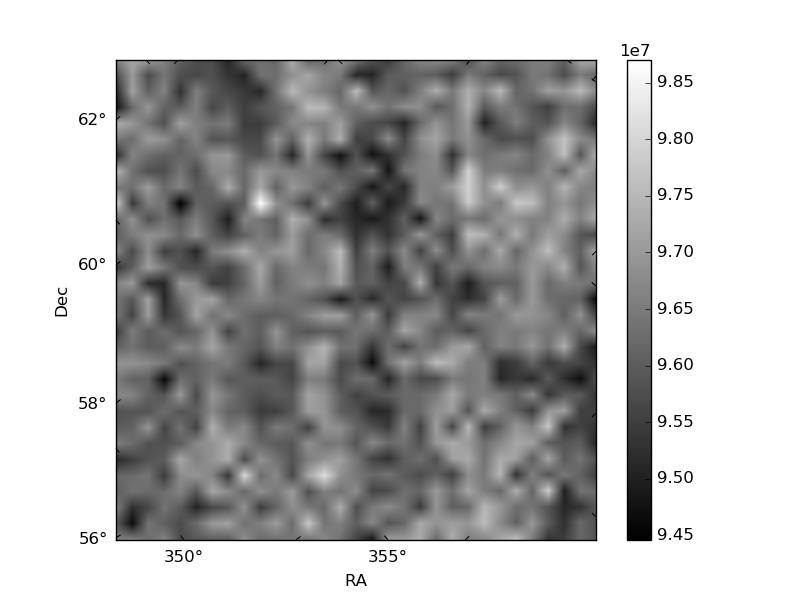
Histogram calculated using DETX and DETY for each event in the final _common_clean file
| Quadrant A |  |
 |
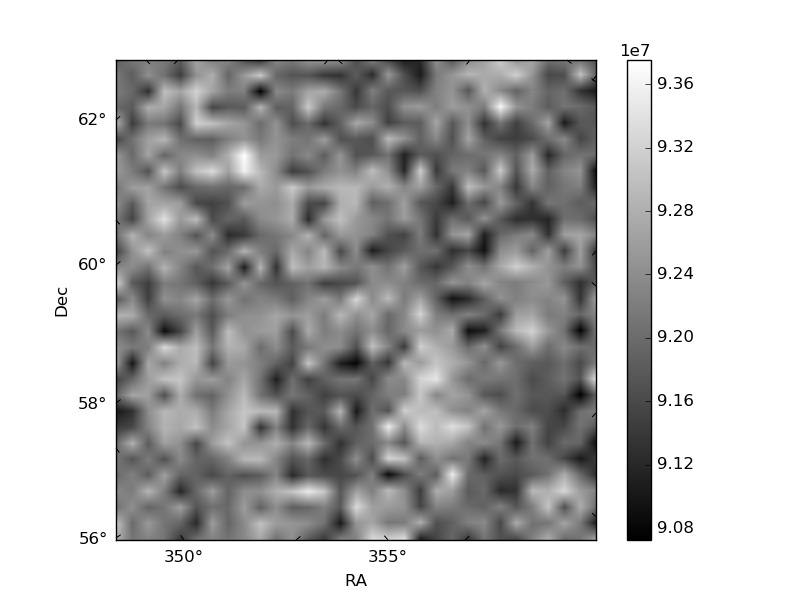
Quadrant B |
|---|---|---|---|
| Quadrant D |  |
 |
Quadrant C |
| Plot type | Count rate plots | Images |
|---|---|---|
| Comparison with Poisson distribution Blue bars denote a histogram of data divided into 1 sec bins. Red curve is a Poisson curve with rate = median count rate of data. |
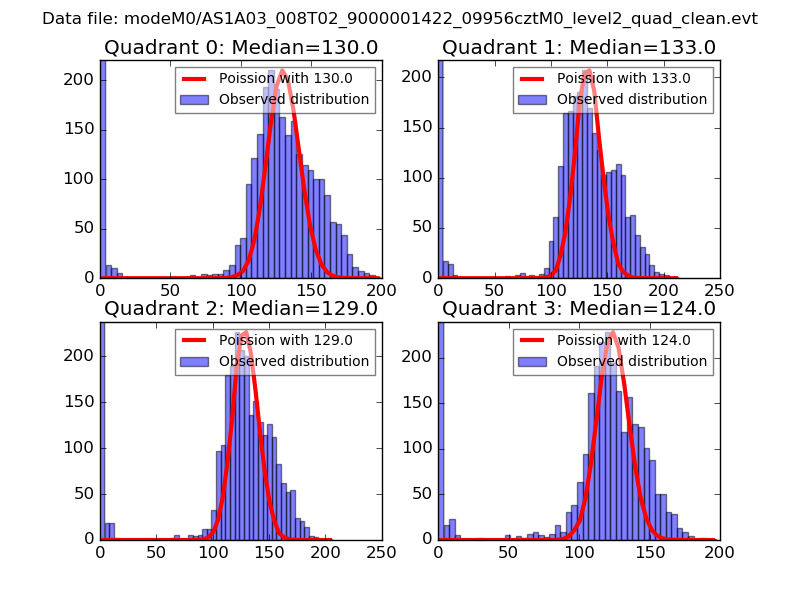 |
 |
| Quadrant-wise count rates Data is divided into 100 sec bins |
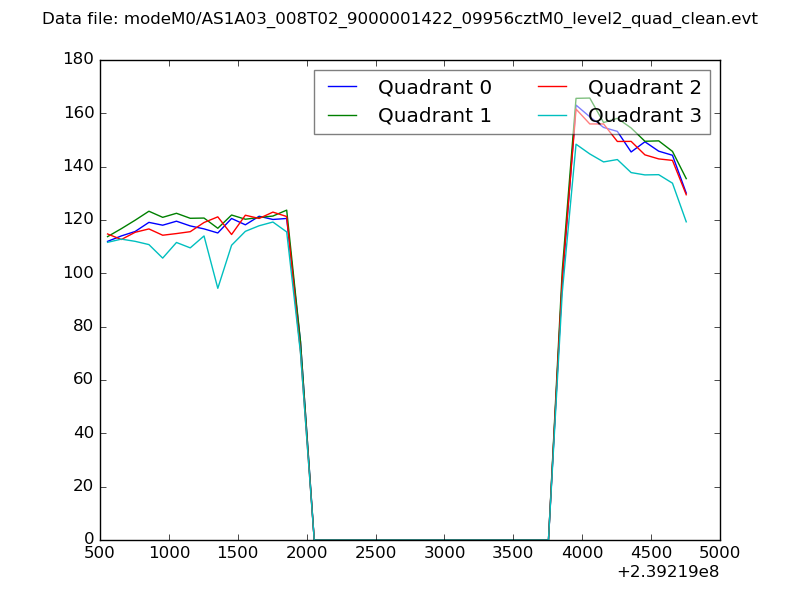 |
|
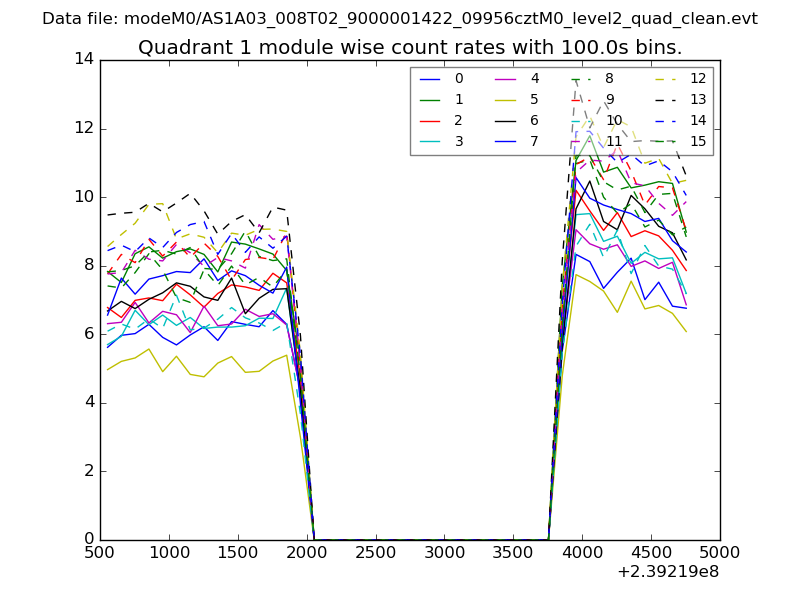
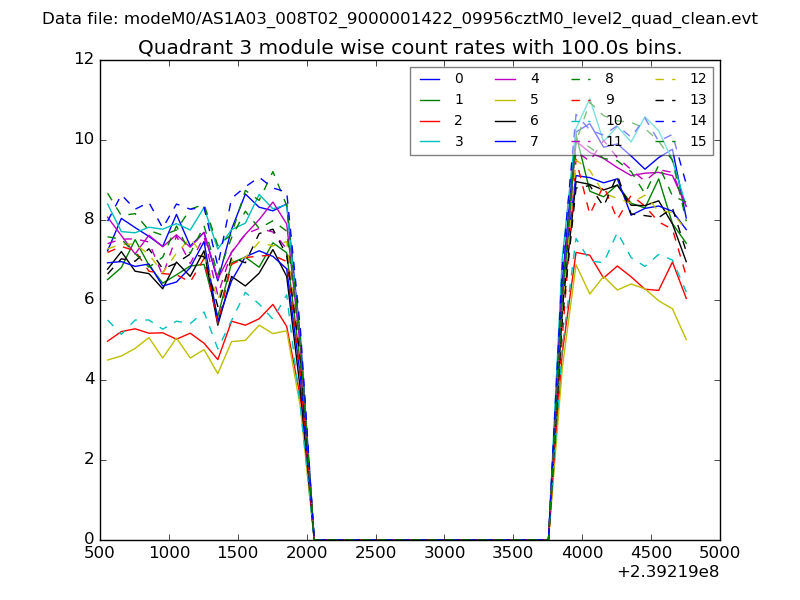
| Module-wise count rates for Quadrant A Data is divided into 100 sec bins |
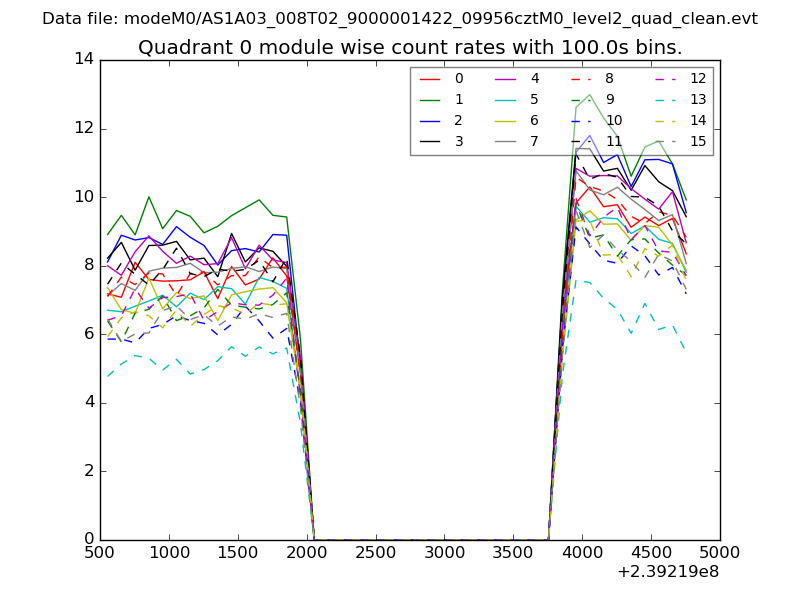 |
 |
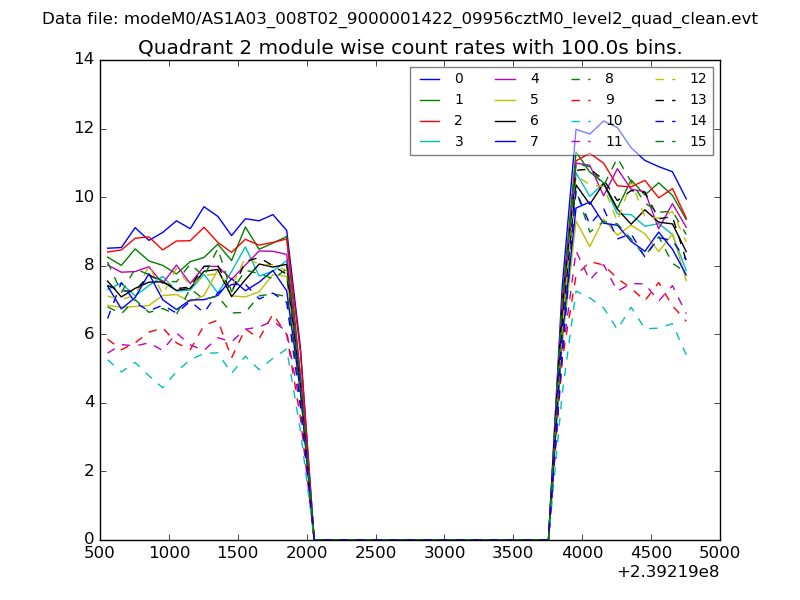
| Module-wise count rates for Quadrant B Data is divided into 100 sec bins |
 |
 |
| Module-wise count rates for Quadrant C Data is divided into 100 sec bins |
 |
 |
| Module-wise count rates for Quadrant D Data is divided into 100 sec bins |
 |
 |
| Parameter | Plot |
|---|---|
| CZT HV Monitor |  |
| D_VDD | 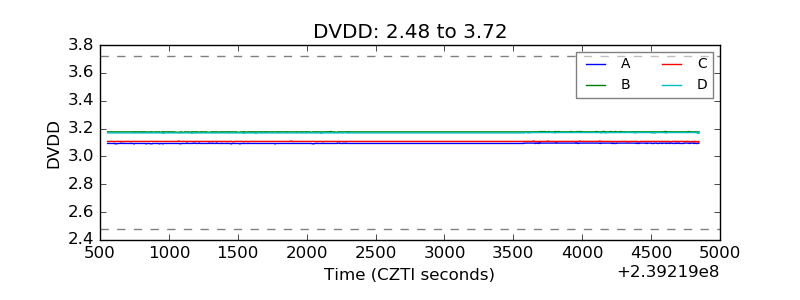 |
| Temperature 1 | 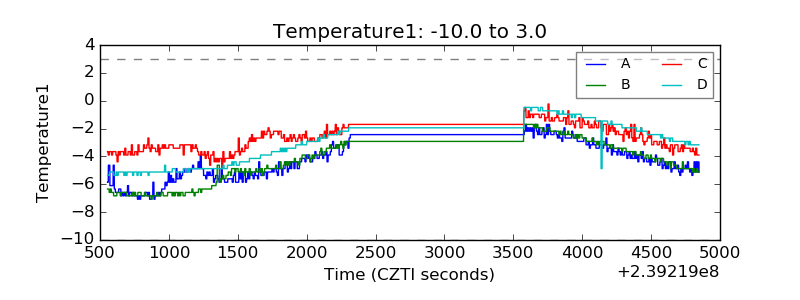 |
| Veto HV Monitor | 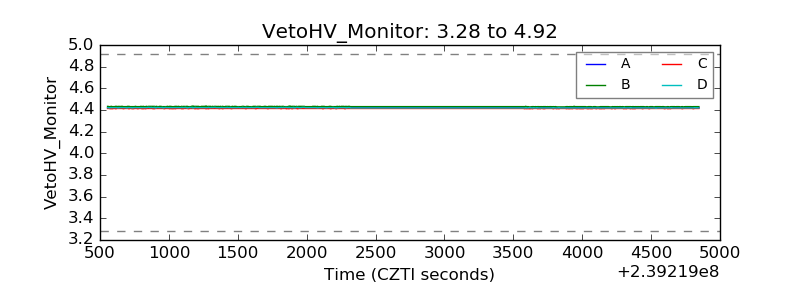 |
| Veto LLD | 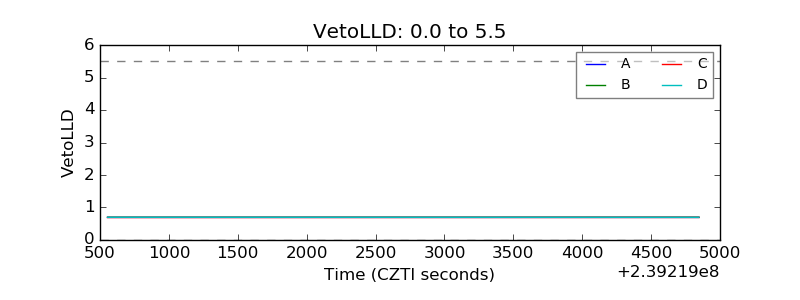 |
| Alpha Counter | 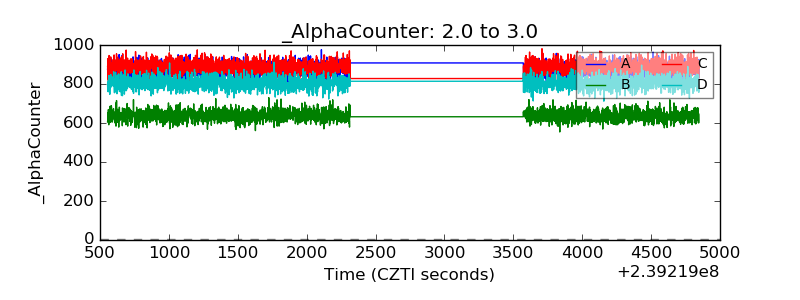 |
| _CPM_Rate | 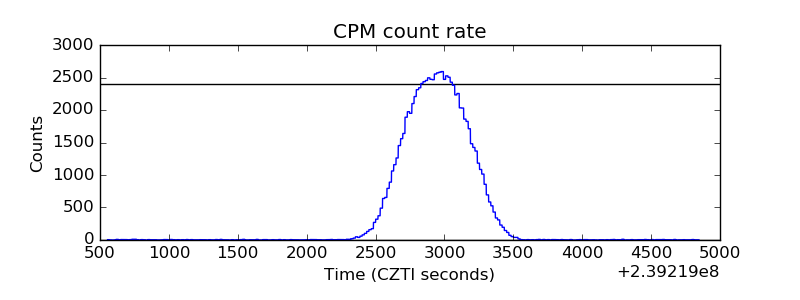 |
| CZT Counter | 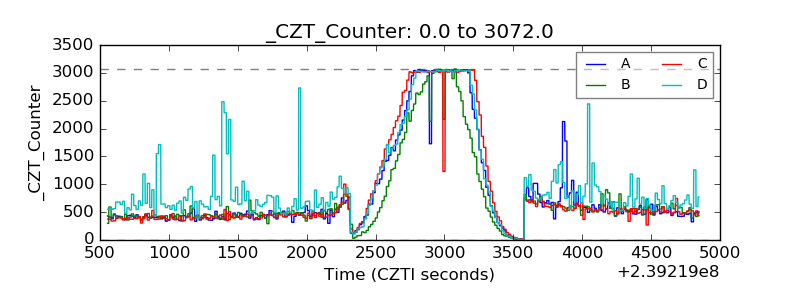 |
| +2.5 Volts monitor |  |
| +5 Volts monitor |  |
| _ROLL_ROT | 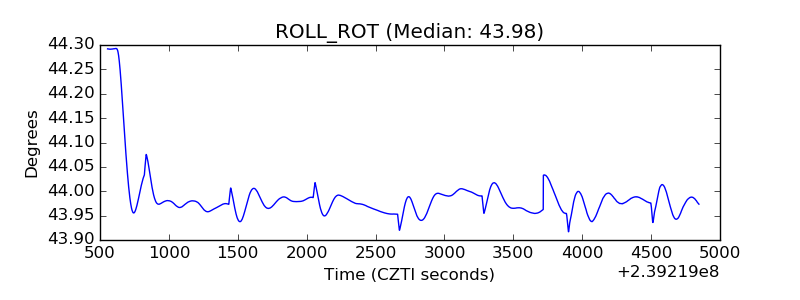 |
| _Roll_DEC | 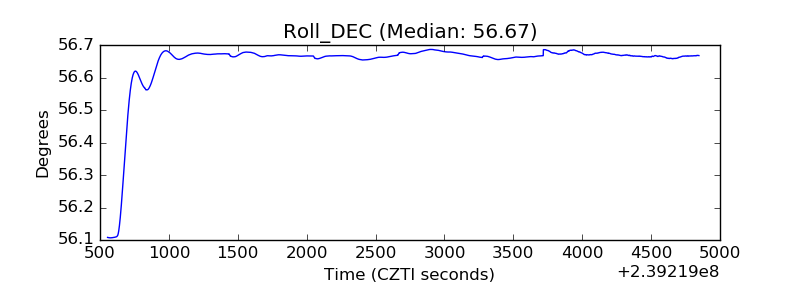 |
| _Roll_RA | 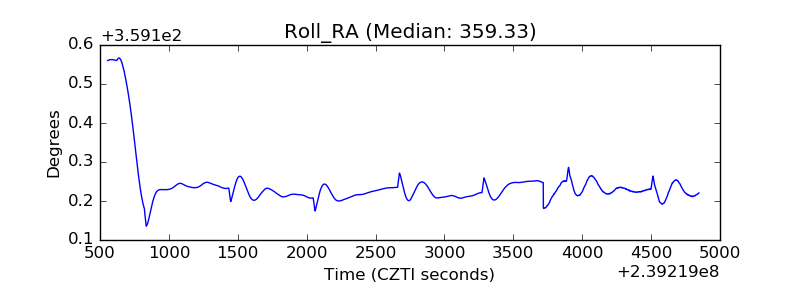 |
| Veto Counter | 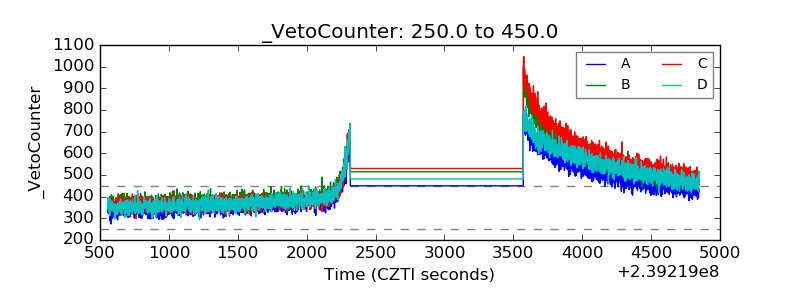 |