| Param | Original file | Final file |
|---|---|---|
| Filename | modeM0/AS1A03_008T02_9000001422_09957cztM0_level2.evt | modeM0/AS1A03_008T02_9000001422_09957cztM0_level2_quad_clean.evt |
| Size (bytes) | 576,457,920 | 129,240,000 |
| Size | 549.8 MB | 123.3 MB |
| Events in quadrant A | 3,593,400 | 851,115 |
| Events in quadrant B | 3,782,715 | 880,258 |
| Events in quadrant C | 3,523,522 | 865,376 |
| Events in quadrant D | 6,050,745 | 796,991 |
| Mode SS | |||
|---|---|---|---|
| Quadrant | BADHDUFLAG | Total packets | Discarded packets |
| A | 0 | 164 | 10 |
| B | 0 | 164 | 4 |
| C | 0 | 164 | 12 |
| D | 0 | 164 | 2 |
| Mode M9 | |||
|---|---|---|---|
| Quadrant | BADHDUFLAG | Total packets | Discarded packets |
| A | 0 | 25 | 0 |
| B | 0 | 25 | 1 |
| C | 0 | 25 | 0 |
| D | 0 | 25 | 0 |
| Mode M0 | |||
|---|---|---|---|
| Quadrant | BADHDUFLAG | Total packets | Discarded packets |
| A | 0 | 16964 | 1062 |
| B | 0 | 17292 | 867 |
| C | 0 | 16614 | 835 |
| D | 0 | 25004 | 1811 |
| Quadrant | Total seconds | Saturated seconds | Saturation percentage |
|---|---|---|---|
| A | 7464 | 120 | 1.607717% |
| B | 7520 | 128 | 1.702128% |
| C | 7512 | 94 | 1.251331% |
| D | 7364 | 399 | 5.418251% |
Noise dominated data is calculated using 1-second bins in cleaned event files. If a bin has >2000 counts, and if more than 50% of those come from <1% of pixels, then it is considered to be noise-dominated and hence unusable.
| Quadrant | # 1 sec bins | Bins with >0 counts | Bins with >2000 counts | High rate bins dominated by noise | Noise dominated (total time) | Noise dominated (detector-on time) | Marked lightcurve |
|---|---|---|---|---|---|---|---|
| A | 10444 | 7779 | 3 | 3 | 0.03% | 0.04% | 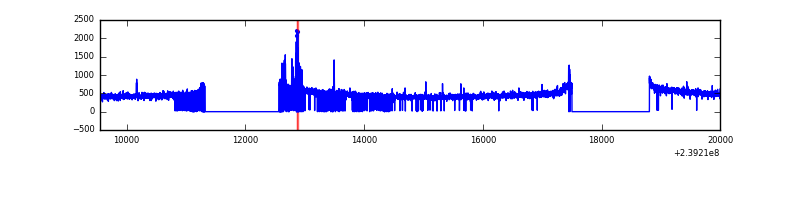 |
| B | 10444 | 7807 | 4 | 4 | 0.04% | 0.05% | 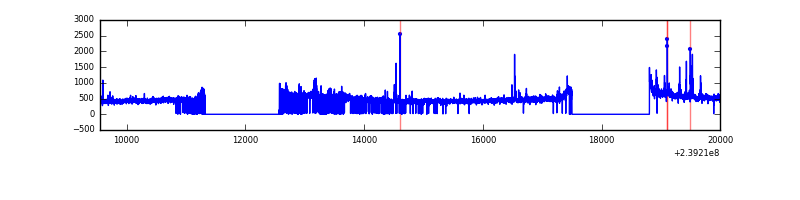 |
| C | 10444 | 7813 | 0 | 0 | 0.00% | 0.00% | 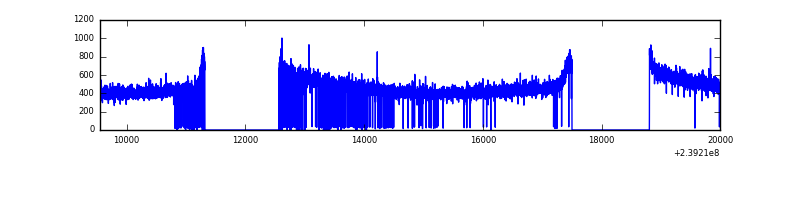 |
| D | 10443 | 7732 | 283 | 283 | 2.71% | 3.66% | 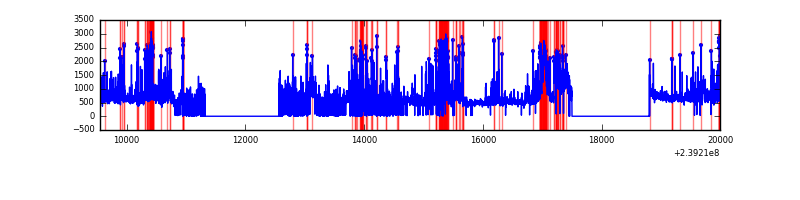 |
Top three noisy pixels from each quadrant. If the there are fewer than three noisy pixels in the level2.evt file, extra rows are filled as -1
| Pixel properties | Quadrant properties | ||||||
|---|---|---|---|---|---|---|---|
| Quadrant | DetID | PixID | Counts | Sigma | Mean | Median | Sigma |
| A | 14 | 254 | 71862 | 384.84 | 907 | 888 | 184.4 |
| A | 8 | 15 | 18007 | 92.82 | 907 | 888 | 184.4 |
| A | 15 | 174 | 13322 | 67.42 | 907 | 888 | 184.4 |
| B | 4 | 81 | 78910 | 446.35 | 928 | 905 | 174.8 |
| B | 0 | 219 | 31995 | 177.9 | 928 | 905 | 174.8 |
| B | 0 | 214 | 22280 | 122.31 | 928 | 905 | 174.8 |
| C | 13 | 61 | 6737 | 28.45 | 901 | 905 | 205.0 |
| C | 8 | 222 | 2977 | 10.11 | 901 | 905 | 205.0 |
| C | 14 | 67 | 2783 | 9.16 | 901 | 905 | 205.0 |
| D | 1 | 52 | 723152 | 3302.01 | 859 | 837 | 218.8 |
| D | 12 | 233 | 701653 | 3203.73 | 859 | 837 | 218.8 |
| D | 2 | 33 | 552005 | 2519.62 | 859 | 837 | 218.8 |
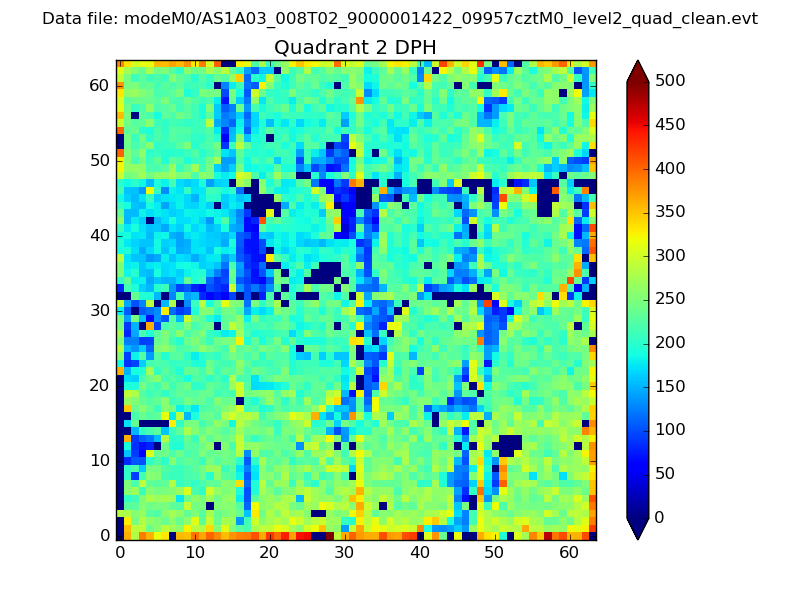
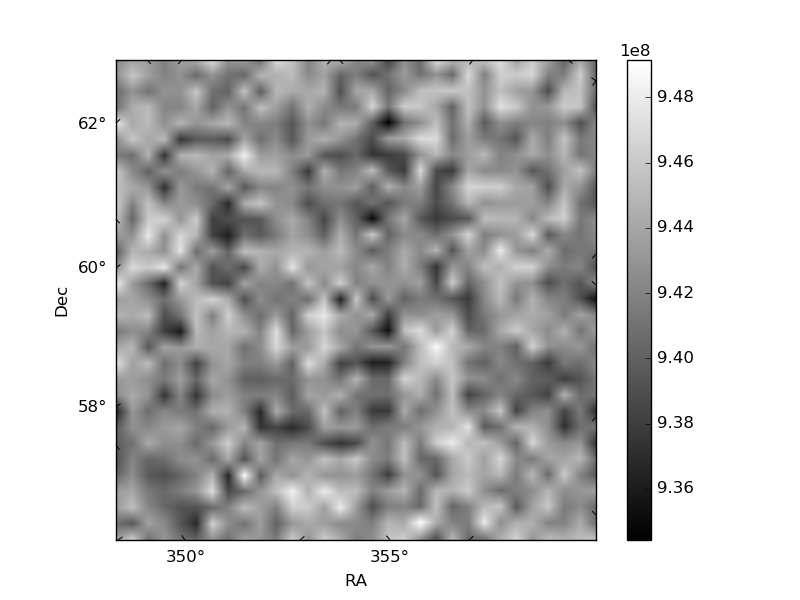
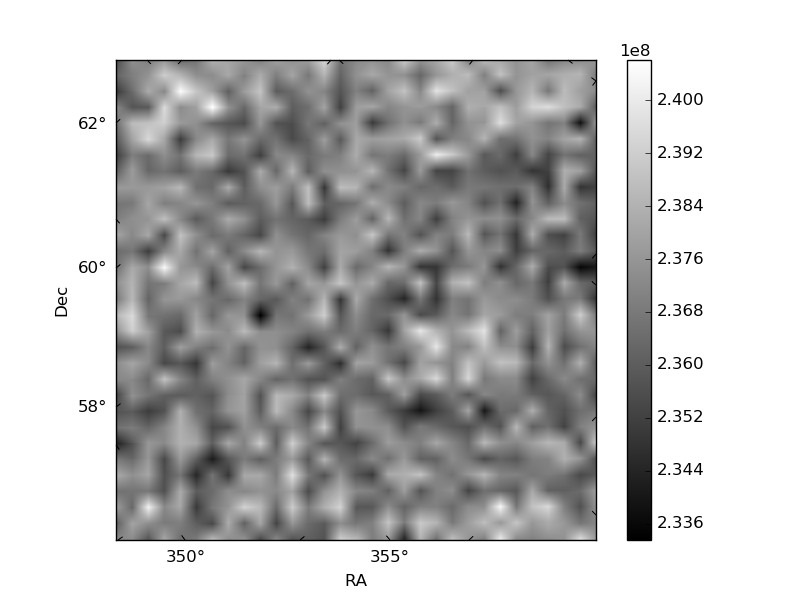
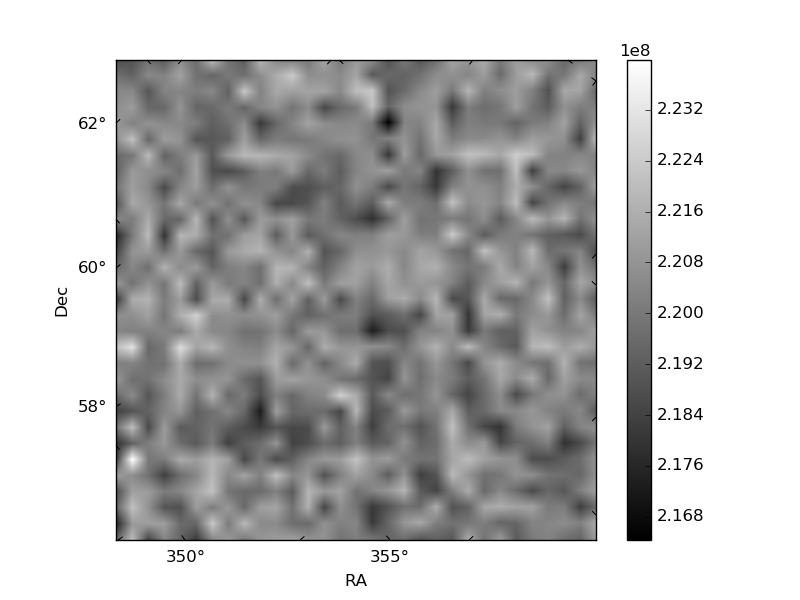
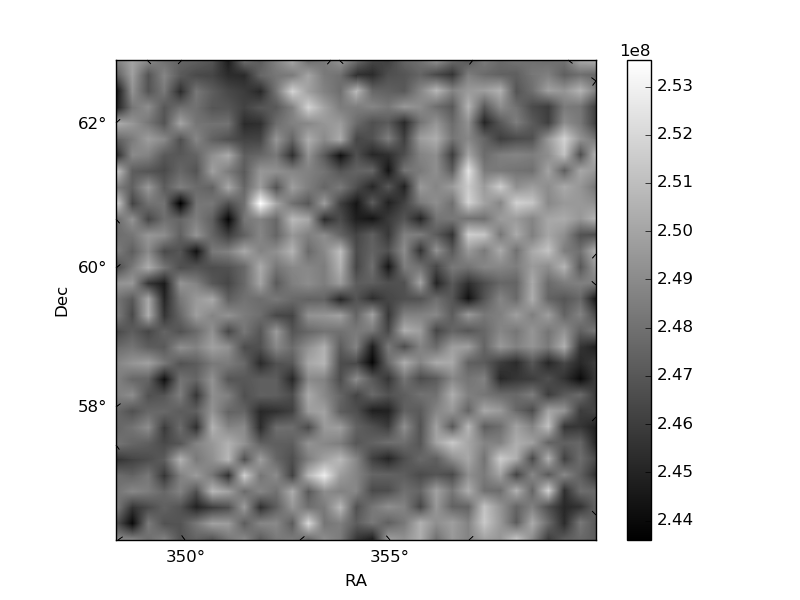
Histogram calculated using DETX and DETY for each event in the final _common_clean file
| Quadrant A | 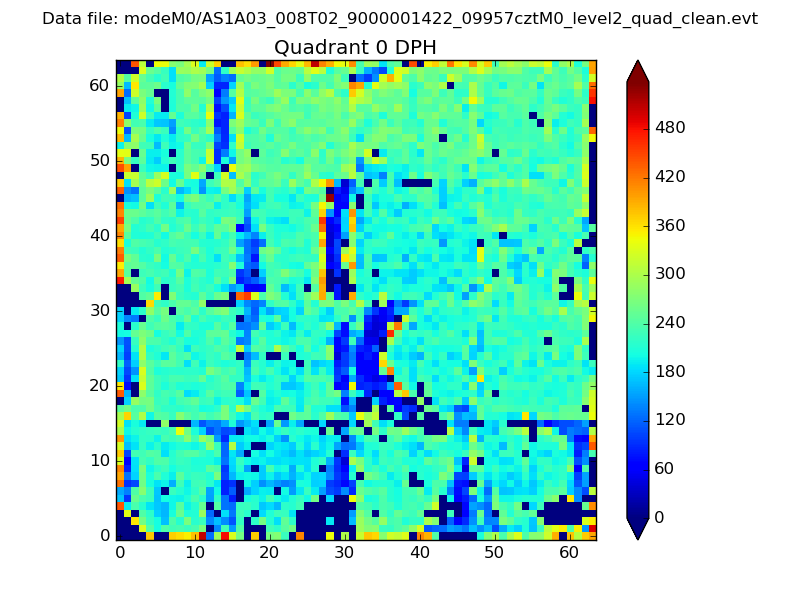 |
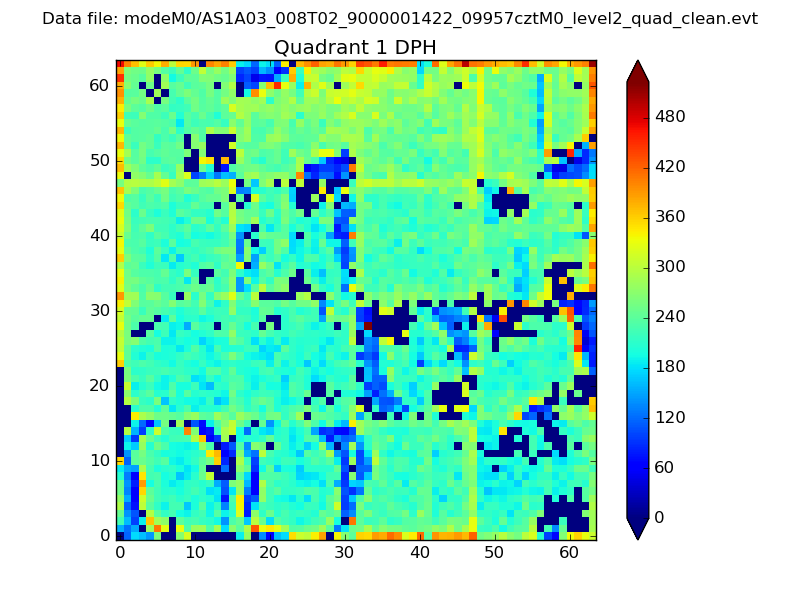 |
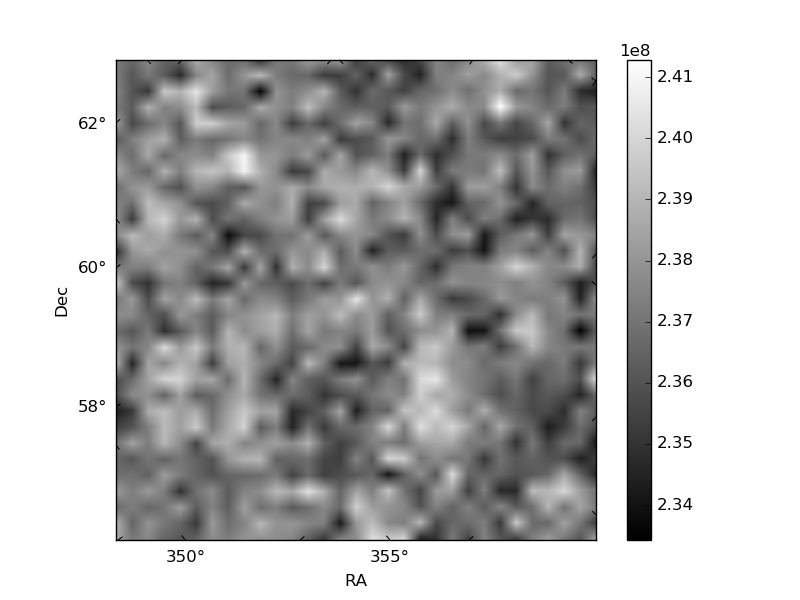
Quadrant B |
|---|---|---|---|
| Quadrant D | 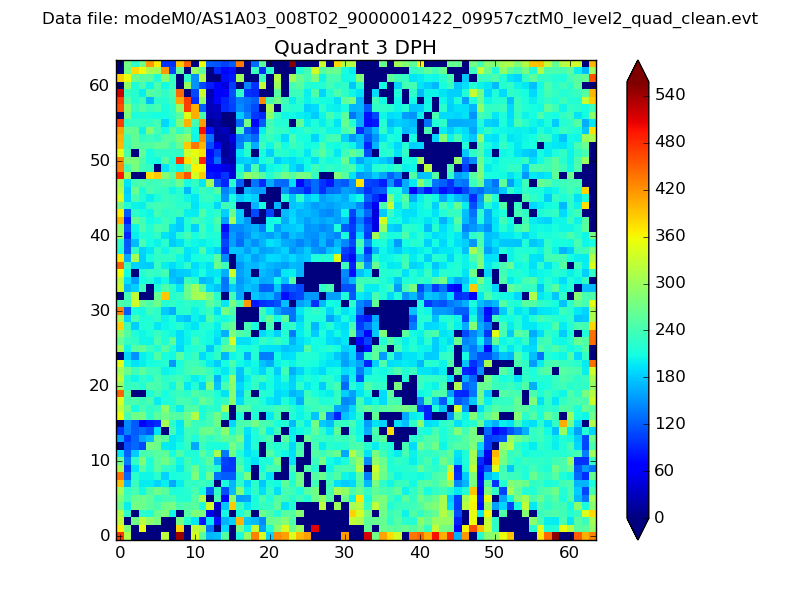 |
 |
Quadrant C |
| Plot type | Count rate plots | Images |
|---|---|---|
| Comparison with Poisson distribution Blue bars denote a histogram of data divided into 1 sec bins. Red curve is a Poisson curve with rate = median count rate of data. |
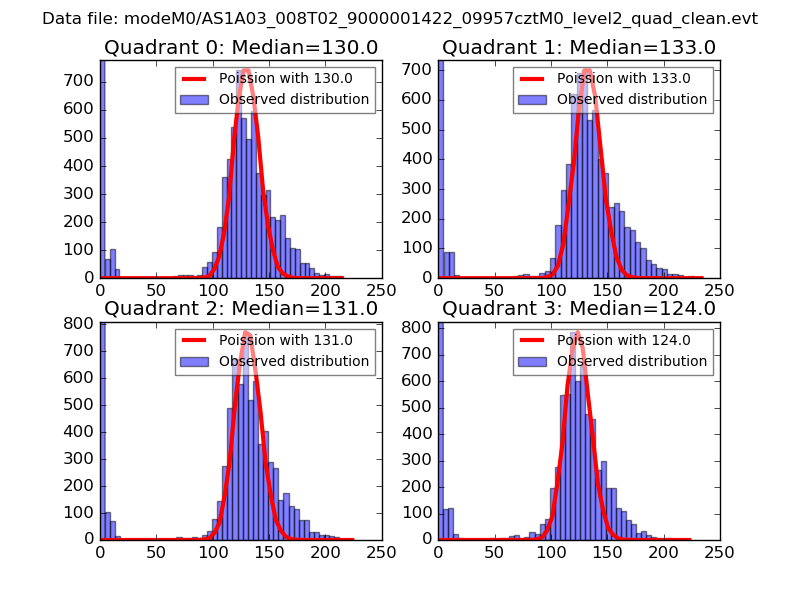 |
 |
| Quadrant-wise count rates Data is divided into 100 sec bins |
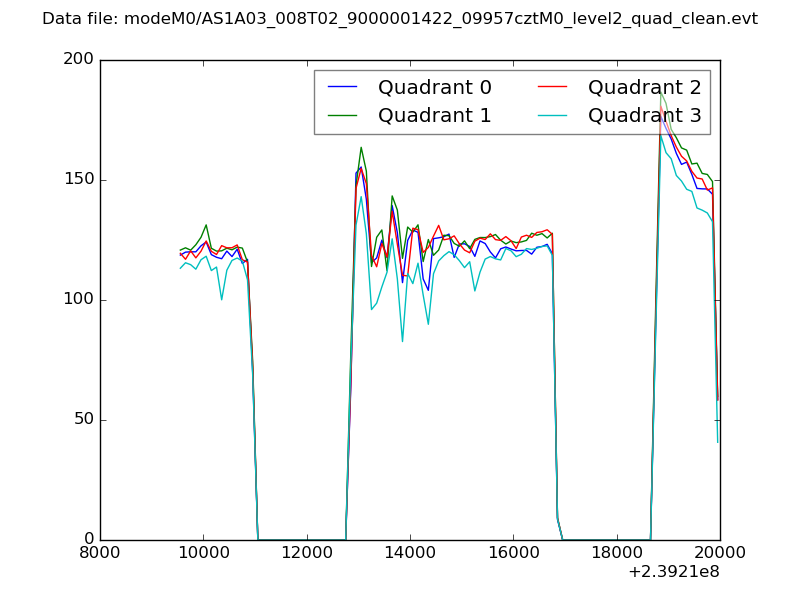 |
|
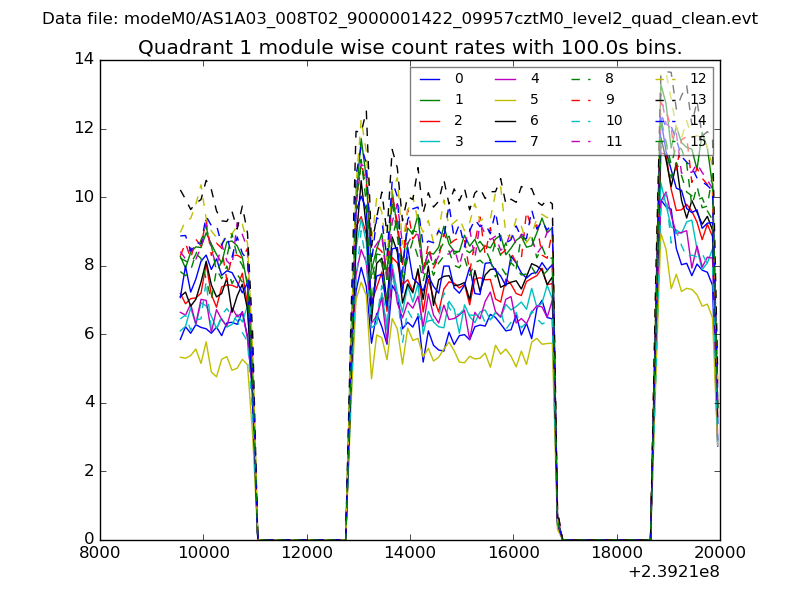
| Module-wise count rates for Quadrant A Data is divided into 100 sec bins |
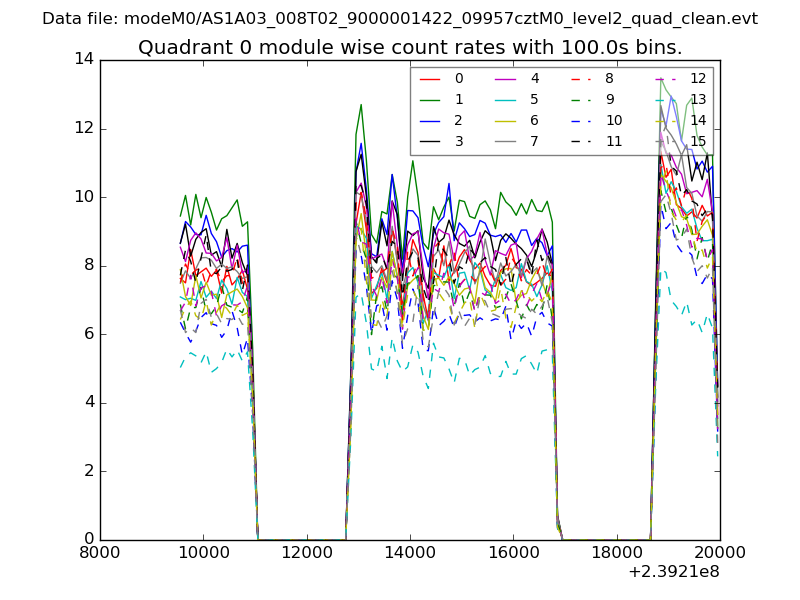 |
 |
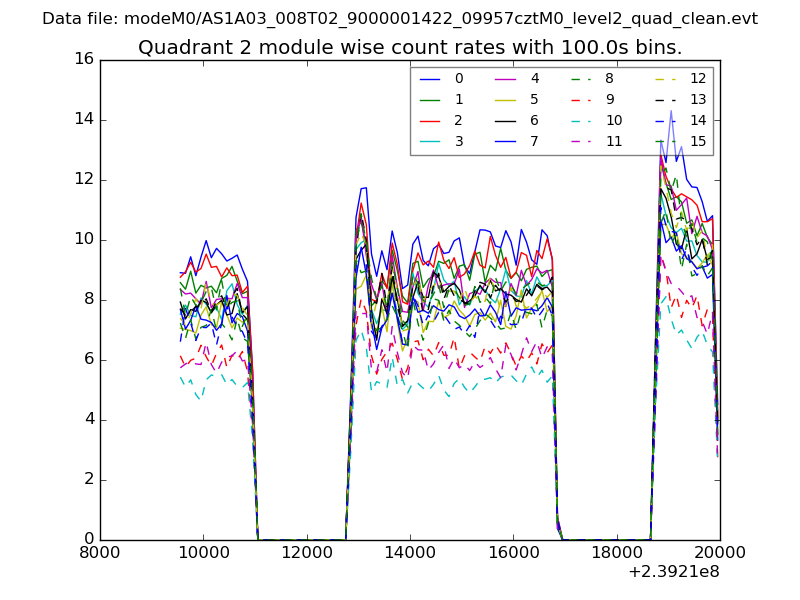
| Module-wise count rates for Quadrant B Data is divided into 100 sec bins |
 |
 |
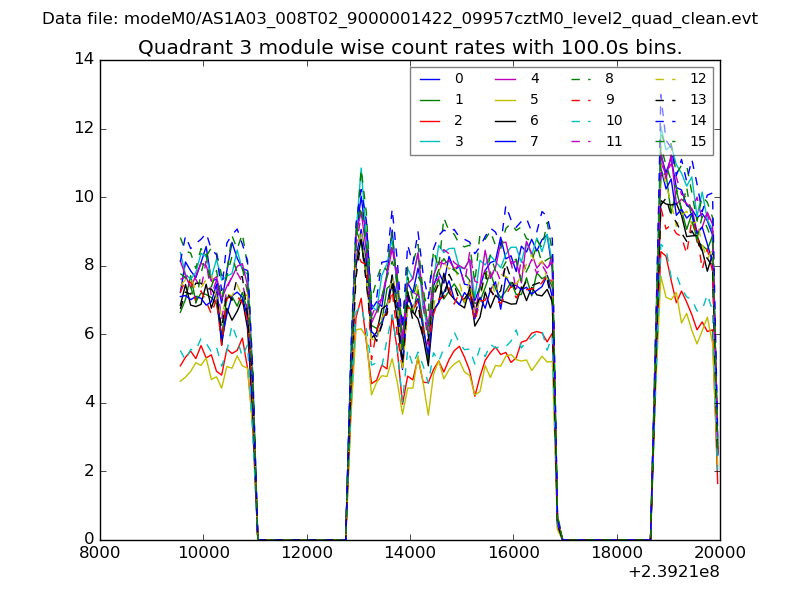
| Module-wise count rates for Quadrant C Data is divided into 100 sec bins |
 |
 |
| Module-wise count rates for Quadrant D Data is divided into 100 sec bins |
 |
 |
| Parameter | Plot |
|---|---|
| CZT HV Monitor | 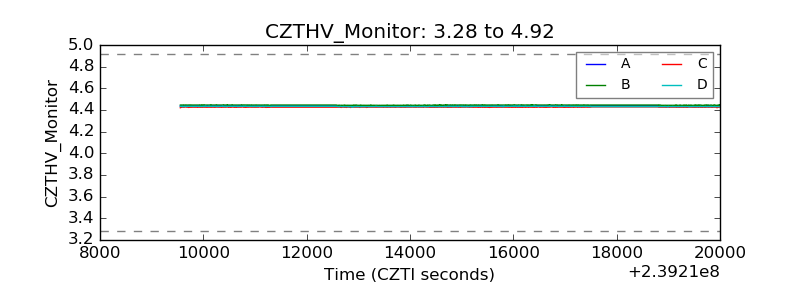 |
| D_VDD | 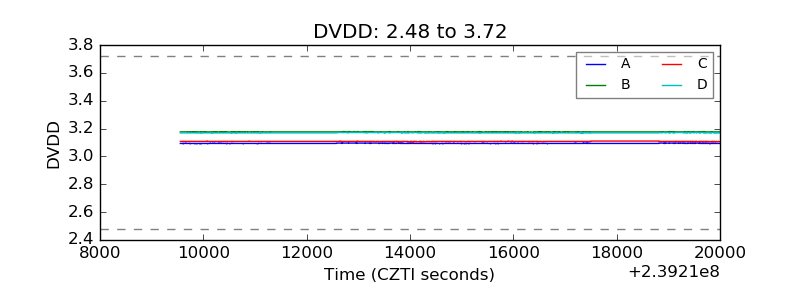 |
| Temperature 1 | 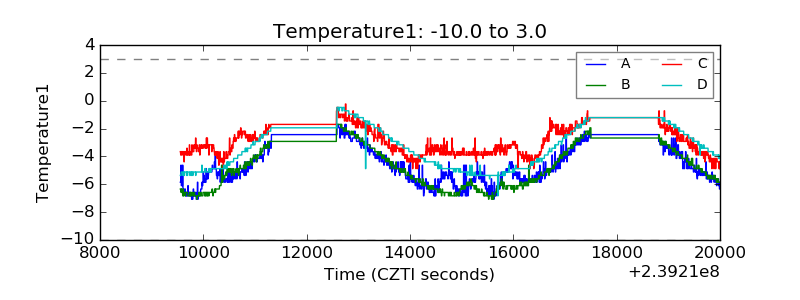 |
| Veto HV Monitor | 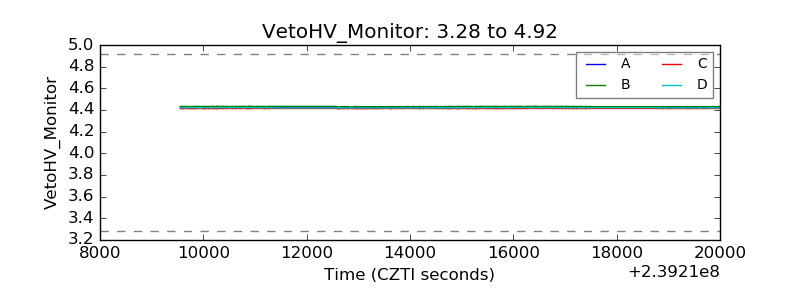 |
| Veto LLD | 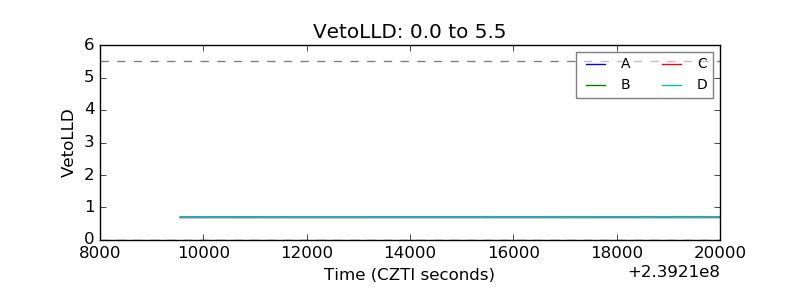 |
| Alpha Counter | 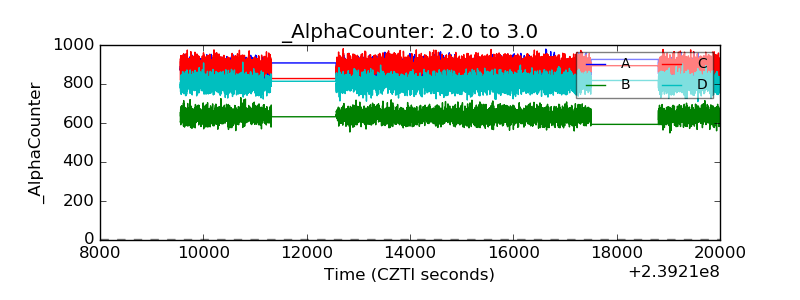 |
| _CPM_Rate | 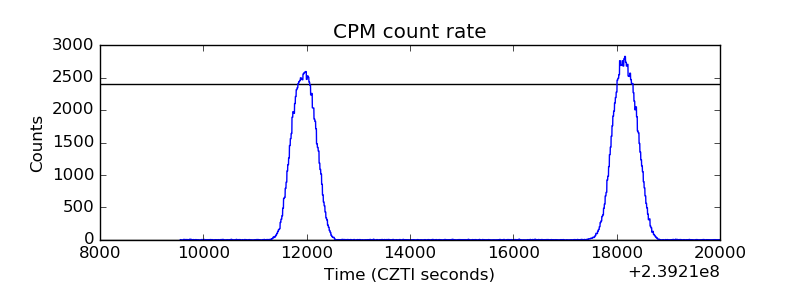 |
| CZT Counter | 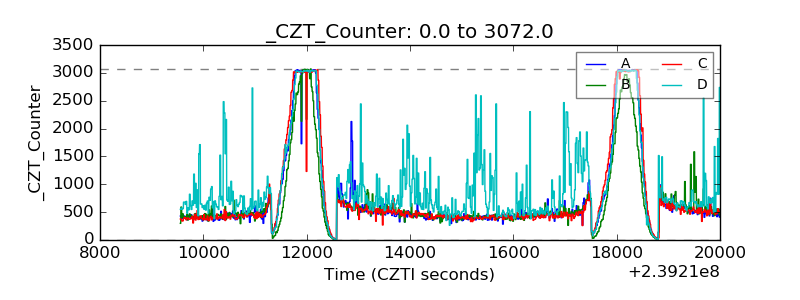 |
| +2.5 Volts monitor |  |
| +5 Volts monitor |  |
| _ROLL_ROT | 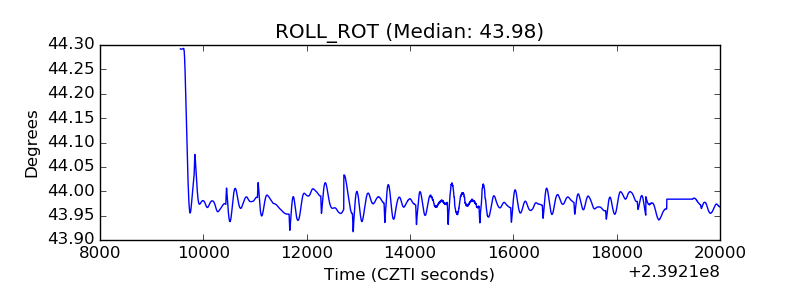 |
| _Roll_DEC | 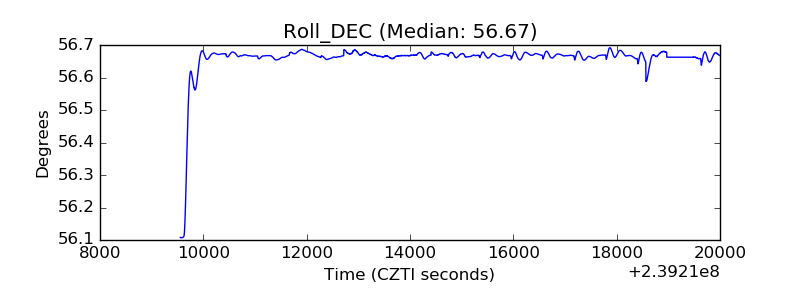 |
| _Roll_RA | 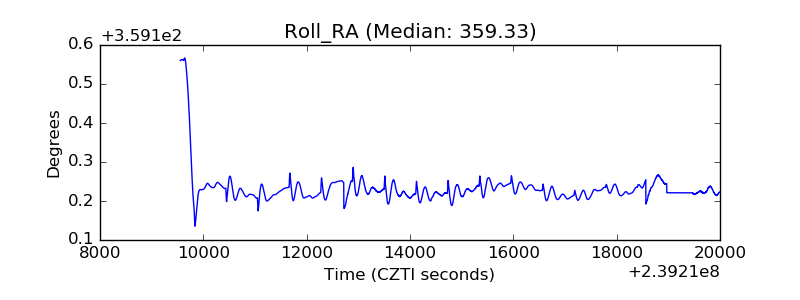 |
| Veto Counter | 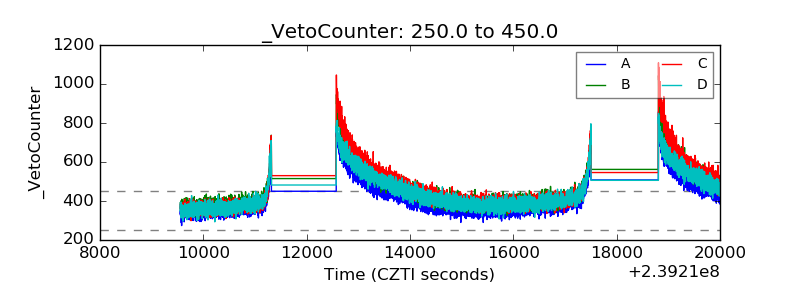 |