| Param | Original file | Final file |
|---|---|---|
| Filename | modeM0/AS1A03_008T02_9000001422_09959cztM0_level2.evt | modeM0/AS1A03_008T02_9000001422_09959cztM0_level2_quad_clean.evt |
| Size (bytes) | 915,065,280 | 200,790,720 |
| Size | 872.7 MB | 191.5 MB |
| Events in quadrant A | 5,743,296 | 1,317,996 |
| Events in quadrant B | 5,982,032 | 1,363,499 |
| Events in quadrant C | 5,570,543 | 1,340,229 |
| Events in quadrant D | 9,608,321 | 1,233,677 |
| Mode SS | |||
|---|---|---|---|
| Quadrant | BADHDUFLAG | Total packets | Discarded packets |
| A | 0 | 258 | 8 |
| B | 0 | 258 | 4 |
| C | 0 | 258 | 12 |
| D | 0 | 258 | 20 |
| Mode M9 | |||
|---|---|---|---|
| Quadrant | BADHDUFLAG | Total packets | Discarded packets |
| A | 0 | 39 | 0 |
| B | 0 | 39 | 1 |
| C | 0 | 39 | 0 |
| D | 0 | 39 | 1 |
| Mode M0 | |||
|---|---|---|---|
| Quadrant | BADHDUFLAG | Total packets | Discarded packets |
| A | 0 | 26651 | 1208 |
| B | 0 | 27233 | 1237 |
| C | 0 | 26201 | 1212 |
| D | 0 | 39896 | 3086 |
| Quadrant | Total seconds | Saturated seconds | Saturation percentage |
|---|---|---|---|
| A | 11980 | 155 | 1.293823% |
| B | 12000 | 172 | 1.433333% |
| C | 11981 | 114 | 0.951507% |
| D | 11779 | 534 | 4.533492% |
Noise dominated data is calculated using 1-second bins in cleaned event files. If a bin has >2000 counts, and if more than 50% of those come from <1% of pixels, then it is considered to be noise-dominated and hence unusable.
| Quadrant | # 1 sec bins | Bins with >0 counts | Bins with >2000 counts | High rate bins dominated by noise | Noise dominated (total time) | Noise dominated (detector-on time) | Marked lightcurve |
|---|---|---|---|---|---|---|---|
| A | 16474 | 12423 | 8 | 8 | 0.05% | 0.06% | 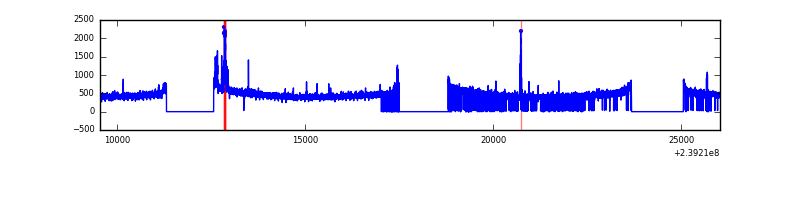 |
| B | 16474 | 12442 | 4 | 4 | 0.02% | 0.03% | 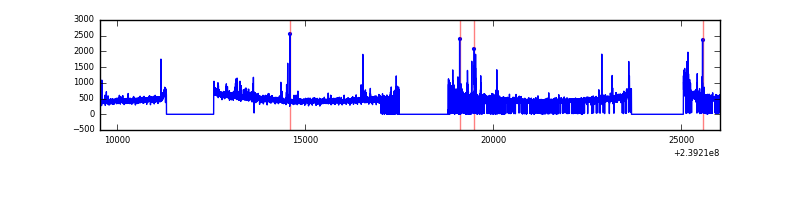 |
| C | 16474 | 12457 | 0 | 0 | 0.00% | 0.00% | 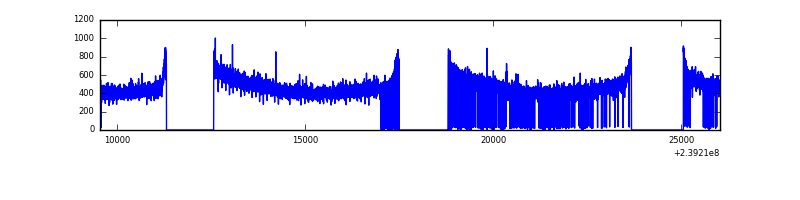 |
| D | 16474 | 12289 | 365 | 365 | 2.22% | 2.97% | 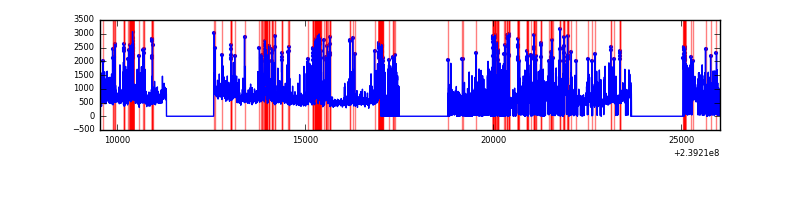 |
Top three noisy pixels from each quadrant. If the there are fewer than three noisy pixels in the level2.evt file, extra rows are filled as -1
| Pixel properties | Quadrant properties | ||||||
|---|---|---|---|---|---|---|---|
| Quadrant | DetID | PixID | Counts | Sigma | Mean | Median | Sigma |
| A | 14 | 254 | 115496 | 392.78 | 1443 | 1415 | 290.4 |
| A | 15 | 174 | 49947 | 167.1 | 1443 | 1415 | 290.4 |
| A | 8 | 15 | 21000 | 67.43 | 1443 | 1415 | 290.4 |
| B | 4 | 81 | 82699 | 296.9 | 1468 | 1437 | 273.7 |
| B | 4 | 239 | 57192 | 203.71 | 1468 | 1437 | 273.7 |
| B | 0 | 219 | 51309 | 182.22 | 1468 | 1437 | 273.7 |
| C | 13 | 61 | 10647 | 28.63 | 1424 | 1432 | 321.8 |
| C | 14 | 67 | 6366 | 15.33 | 1424 | 1432 | 321.8 |
| C | 12 | 4 | 5935 | 13.99 | 1424 | 1432 | 321.8 |
| D | 12 | 233 | 1459405 | 4261.4 | 1360 | 1325 | 342.2 |
| D | 1 | 52 | 1002834 | 2927.02 | 1360 | 1325 | 342.2 |
| D | 8 | 195 | 634237 | 1849.76 | 1360 | 1325 | 342.2 |
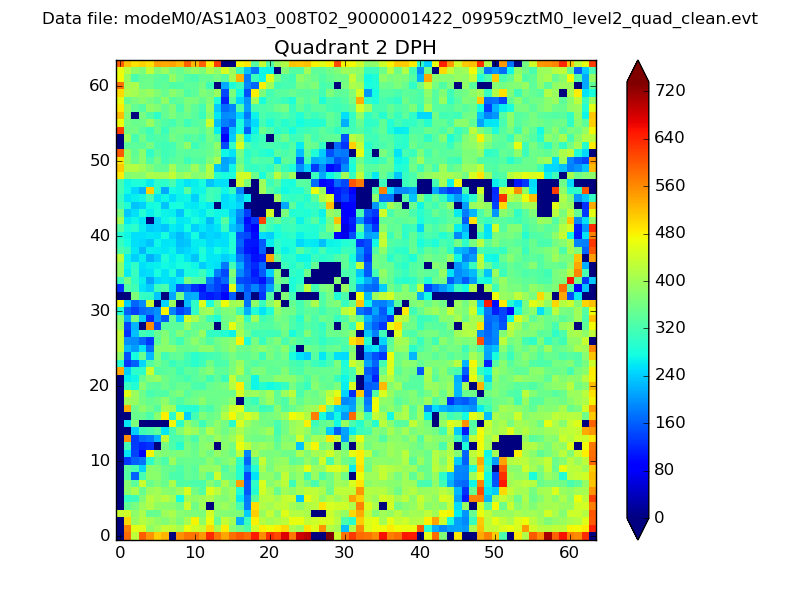
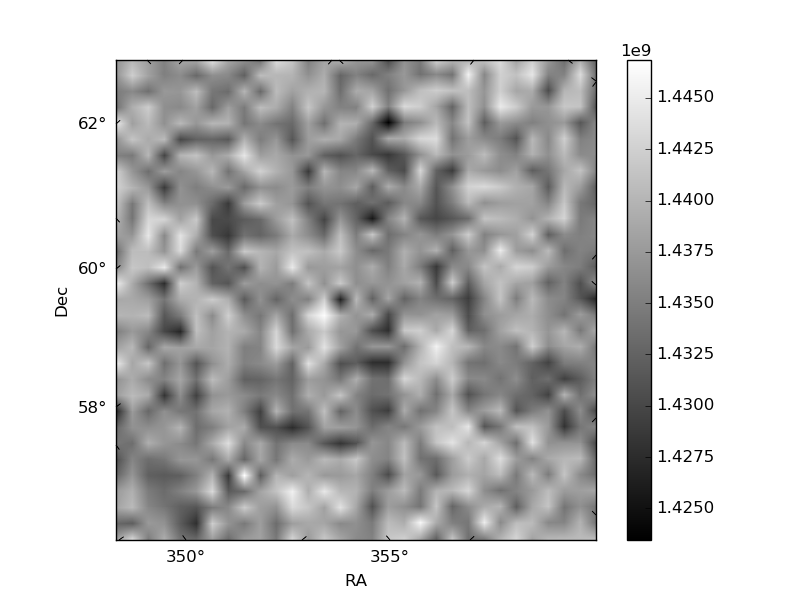
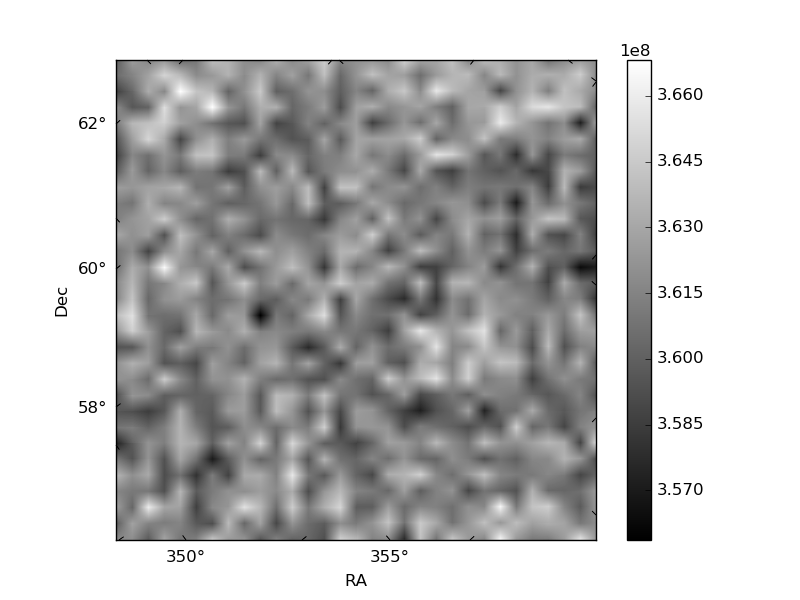
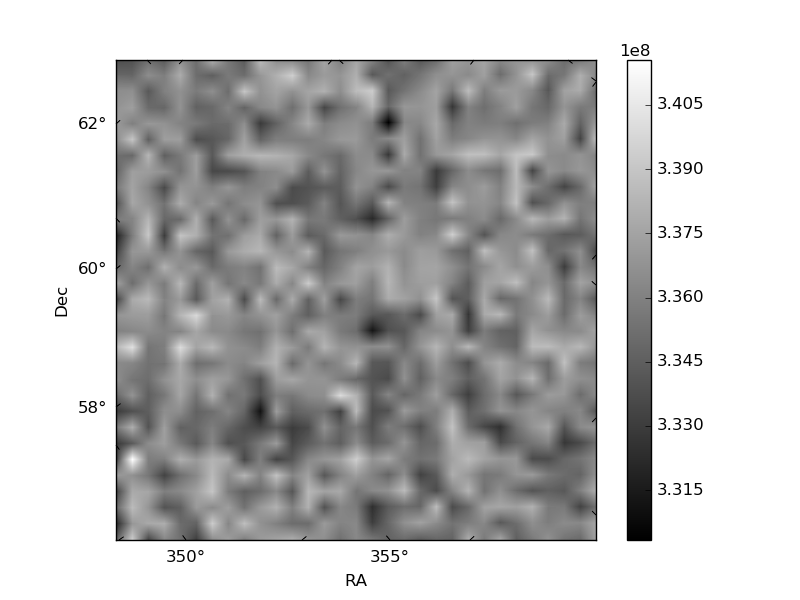
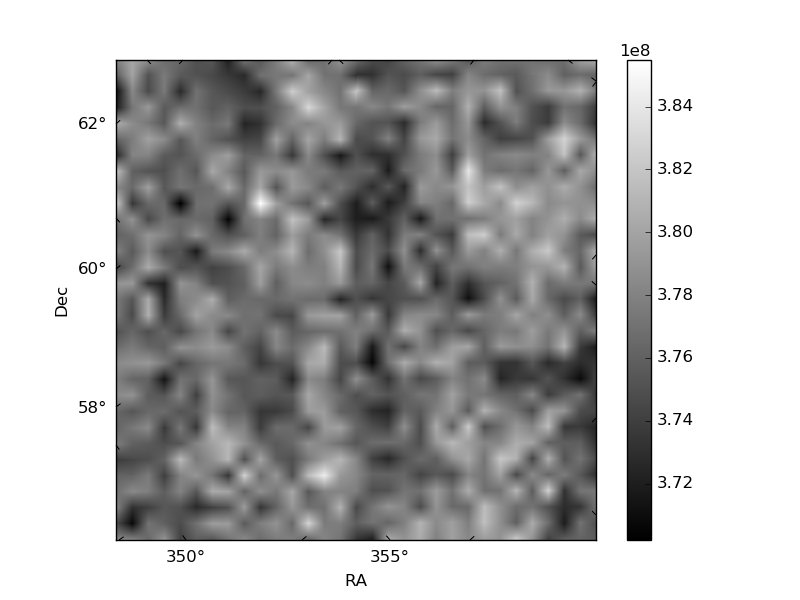
Histogram calculated using DETX and DETY for each event in the final _common_clean file
| Quadrant A | 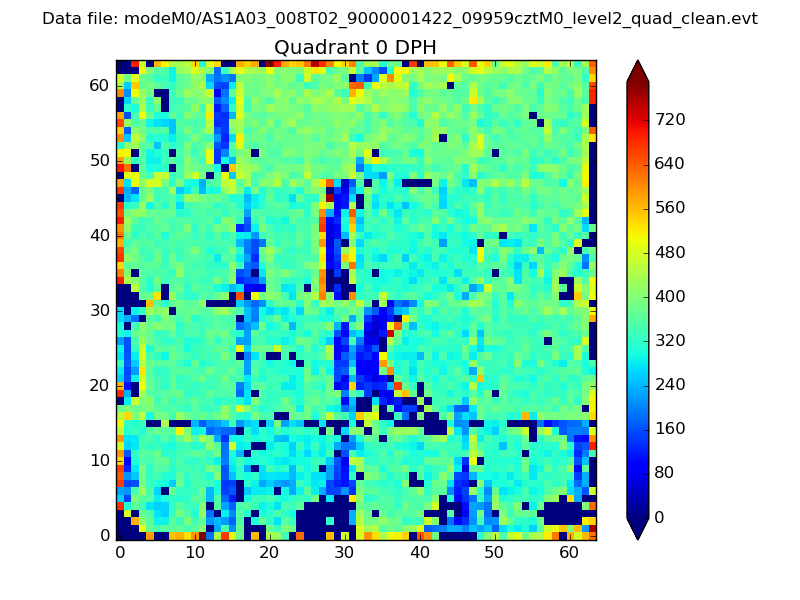 |
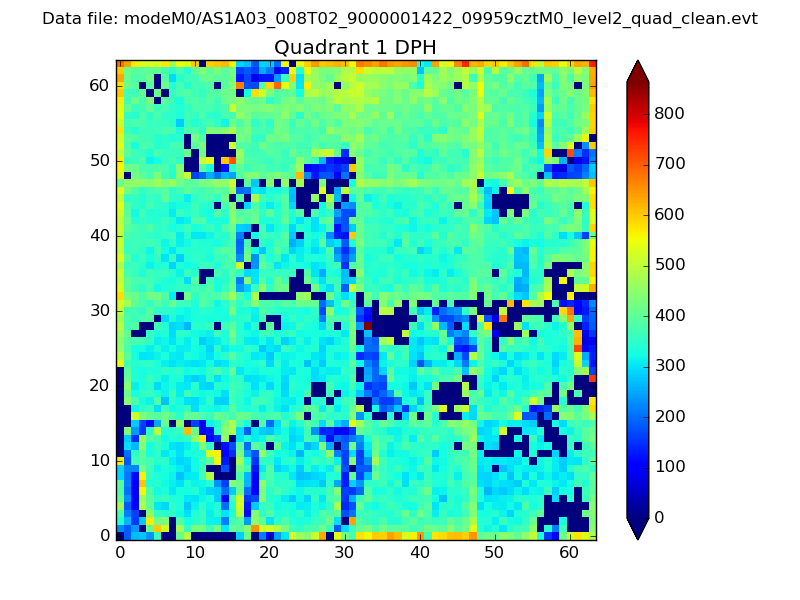 |
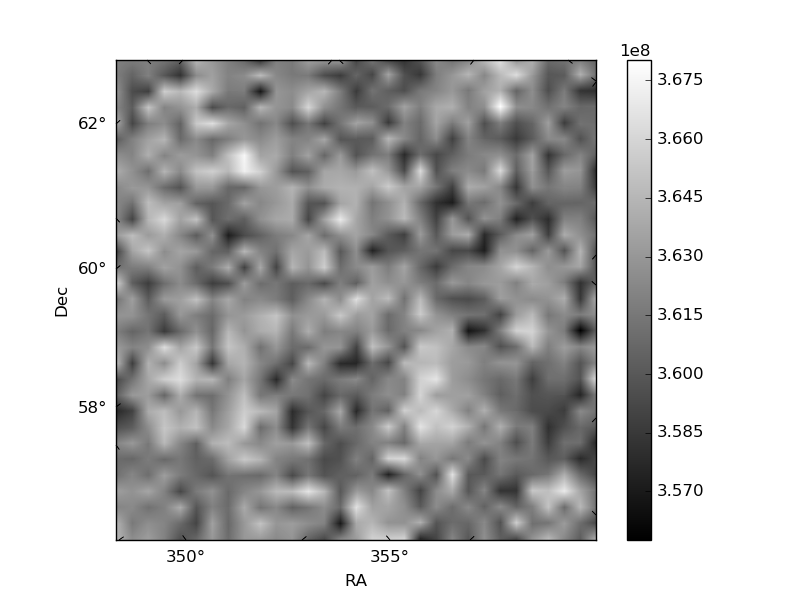
Quadrant B |
|---|---|---|---|
| Quadrant D | 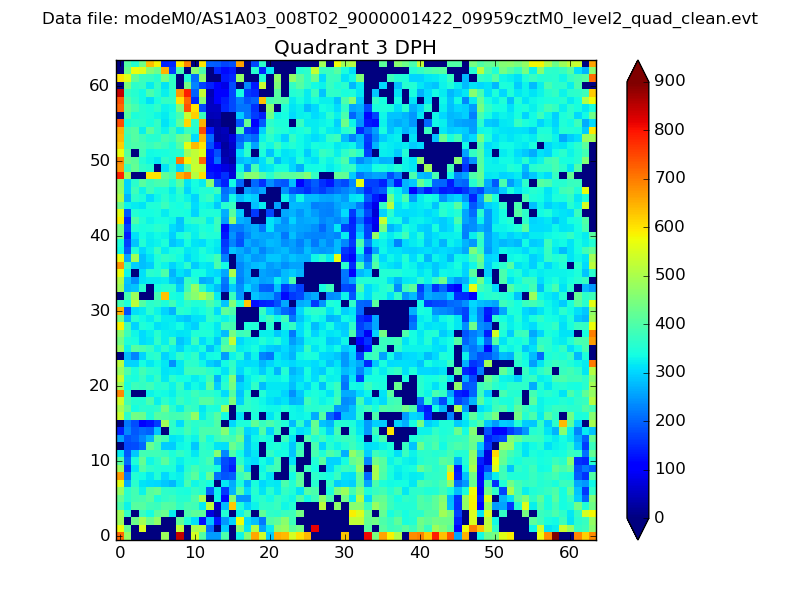 |
 |
Quadrant C |
| Plot type | Count rate plots | Images |
|---|---|---|
| Comparison with Poisson distribution Blue bars denote a histogram of data divided into 1 sec bins. Red curve is a Poisson curve with rate = median count rate of data. |
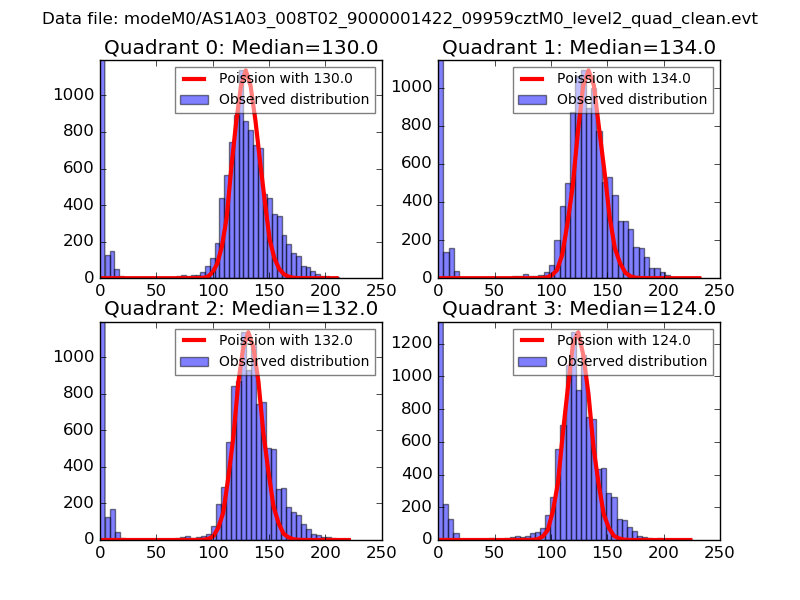 |
 |
| Quadrant-wise count rates Data is divided into 100 sec bins |
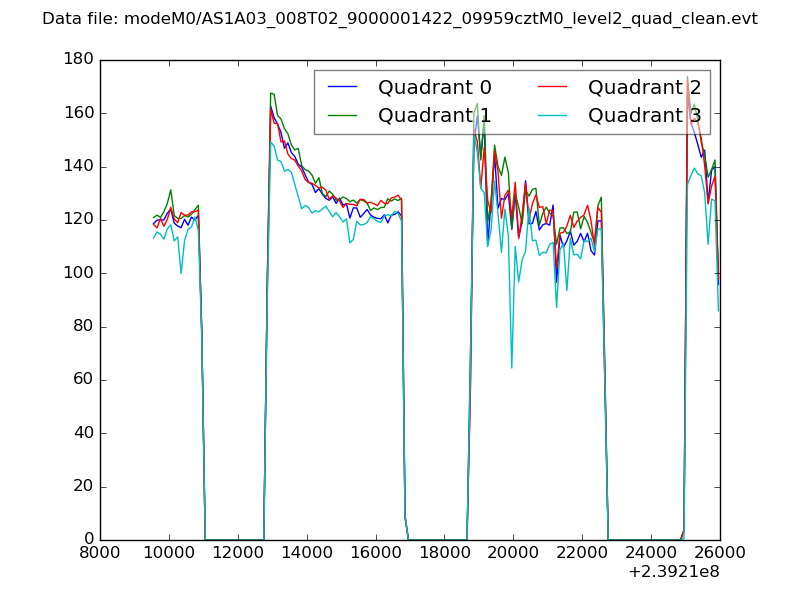 |
|
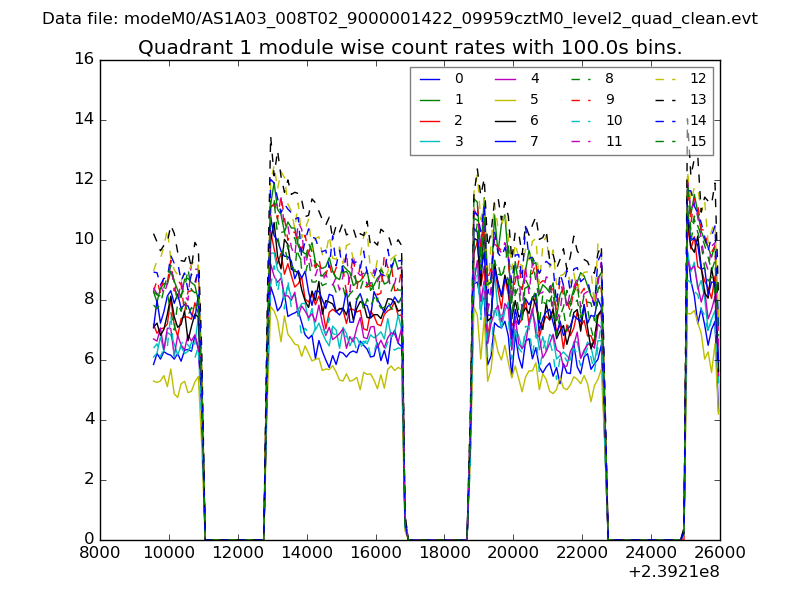
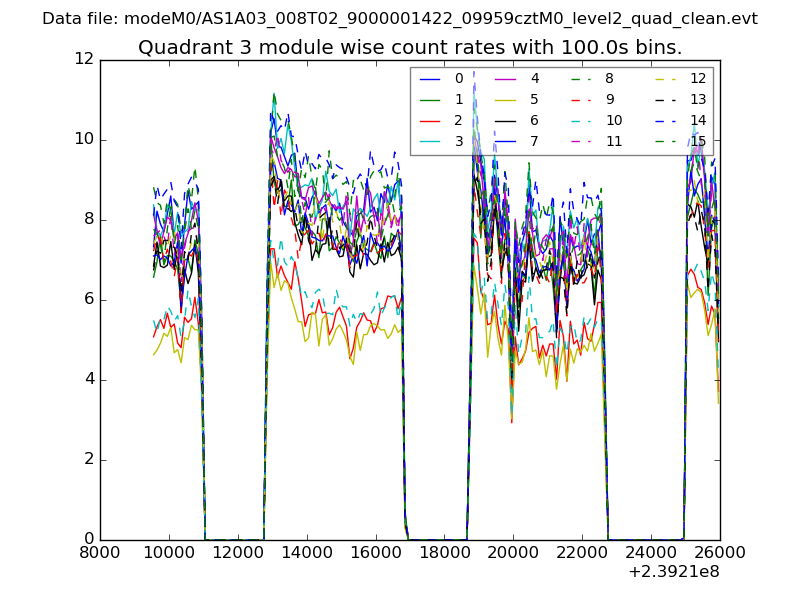
| Module-wise count rates for Quadrant A Data is divided into 100 sec bins |
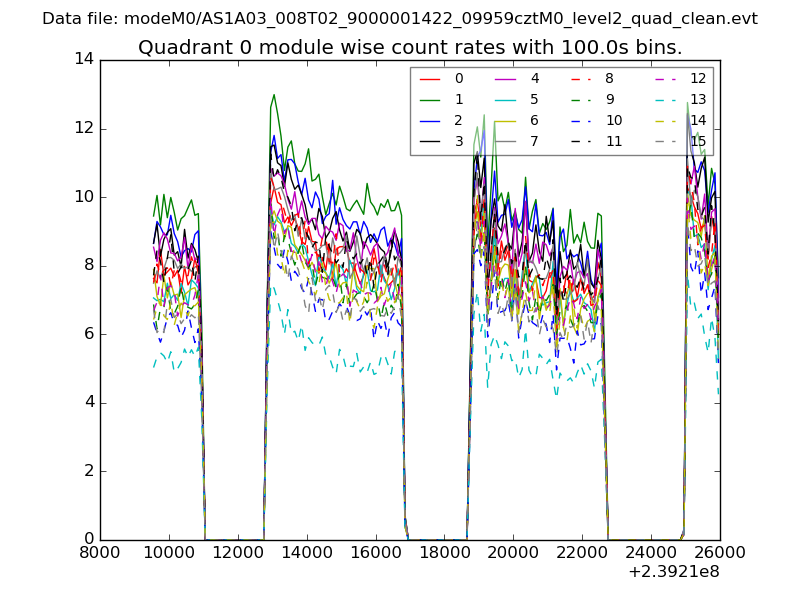 |
 |
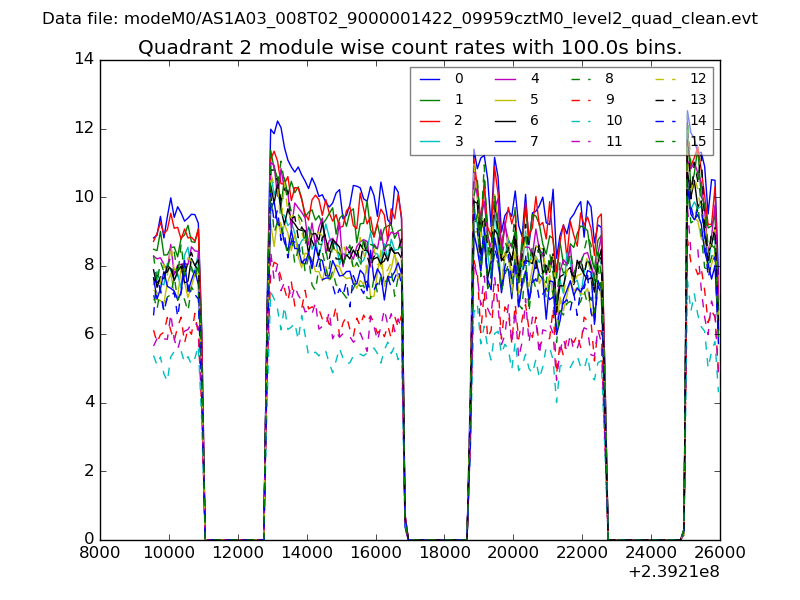
| Module-wise count rates for Quadrant B Data is divided into 100 sec bins |
 |
 |
| Module-wise count rates for Quadrant C Data is divided into 100 sec bins |
 |
 |
| Module-wise count rates for Quadrant D Data is divided into 100 sec bins |
 |
 |
| Parameter | Plot |
|---|---|
| CZT HV Monitor | 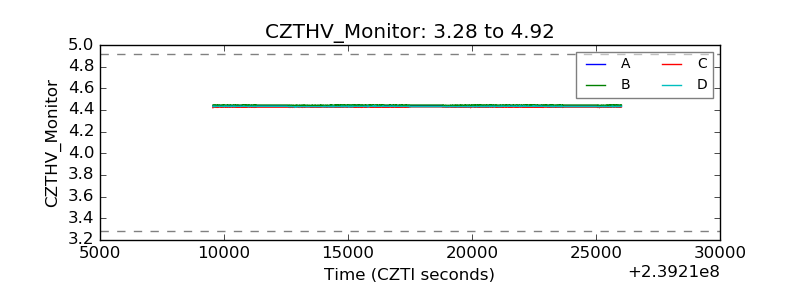 |
| D_VDD | 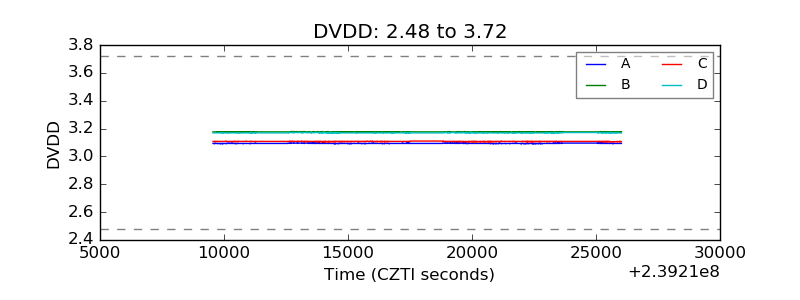 |
| Temperature 1 | 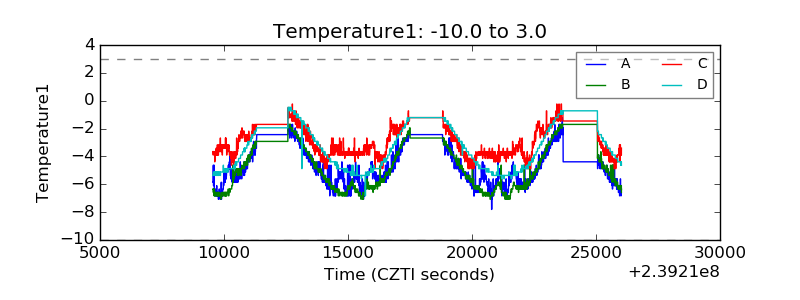 |
| Veto HV Monitor |  |
| Veto LLD | 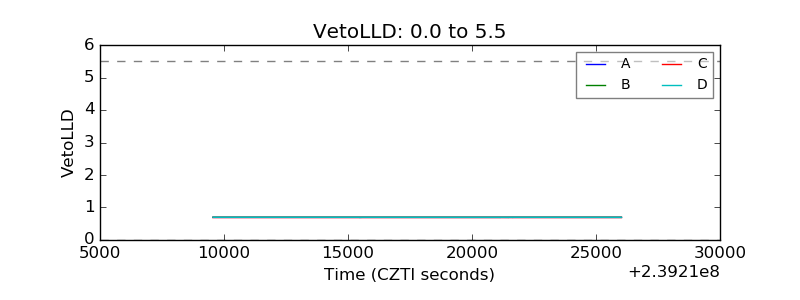 |
| Alpha Counter | 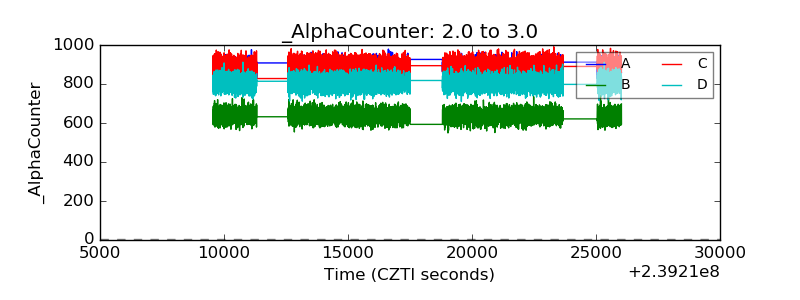 |
| _CPM_Rate | 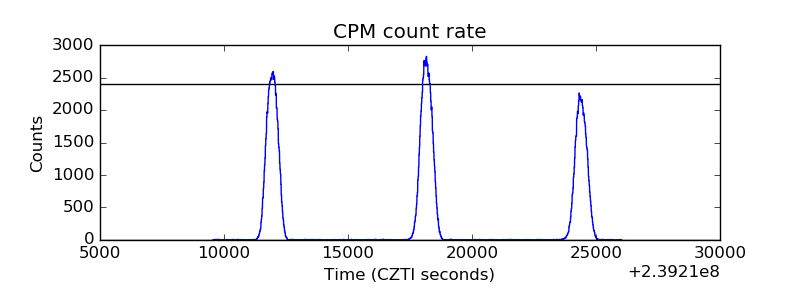 |
| CZT Counter | 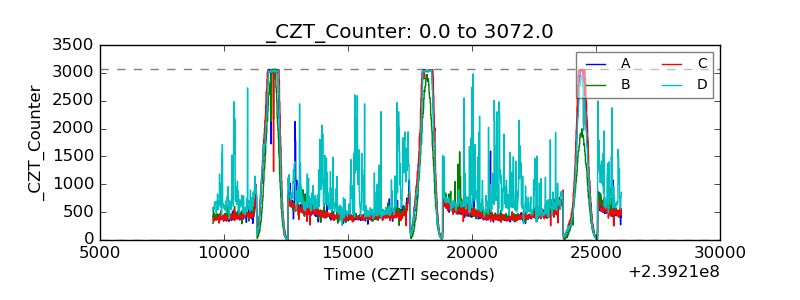 |
| +2.5 Volts monitor |  |
| +5 Volts monitor | 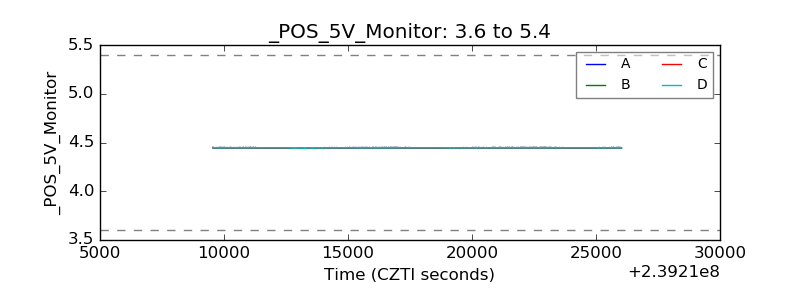 |
| _ROLL_ROT | 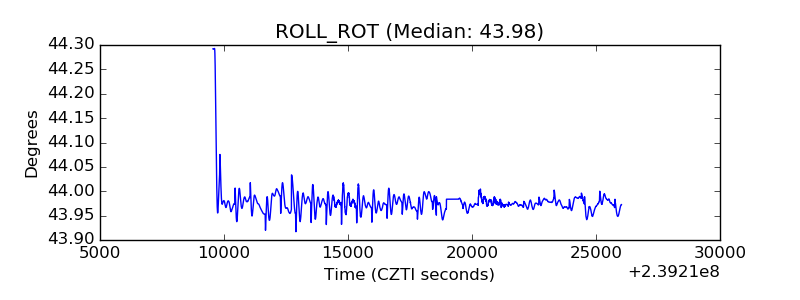 |
| _Roll_DEC | 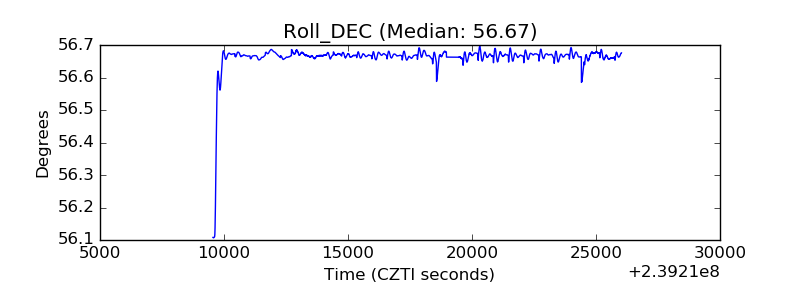 |
| _Roll_RA | 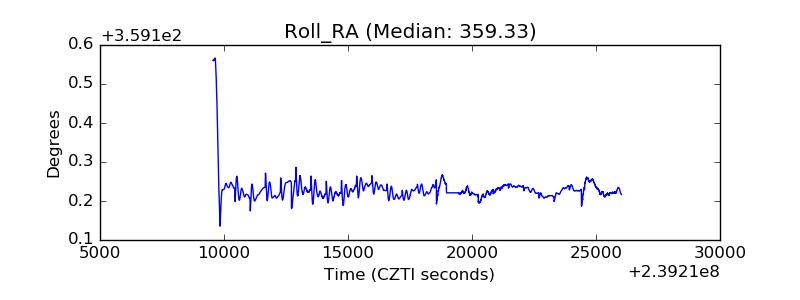 |
| Veto Counter | 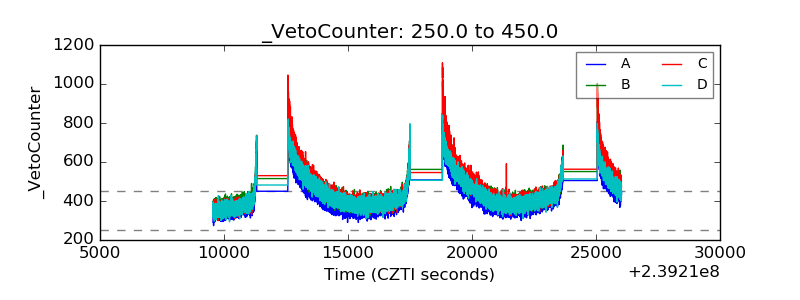 |