| Param | Original file | Final file |
|---|---|---|
| Filename | modeM0/AS1G07_047T01_9000001424cztM0_level2.fits | modeM0/AS1G07_047T01_9000001424cztM0_level2_quad_clean.evt |
| Size (bytes) | 730,707,840 | 684,429,120 |
| Size | 696.9 MB | 652.7 MB |
| Events in quadrant A | 4,360,840 | 3,949,207 |
| Events in quadrant B | 4,293,698 | 4,039,341 |
| Events in quadrant C | 4,412,614 | 3,935,460 |
| Events in quadrant D | 3,609,324 | 3,355,488 |
| Mode M0 | |||
|---|---|---|---|
| Quadrant | BADHDUFLAG | Total packets | Discarded packets |
| A | 0 | 195867 | 0 |
| B | 0 | 174542 | 0 |
| C | 0 | 162925 | 0 |
| D | 0 | 241086 | 0 |
| Mode SS | |||
|---|---|---|---|
| Quadrant | BADHDUFLAG | Total packets | Discarded packets |
| A | 0 | 1619 | 0 |
| B | 0 | 1628 | 0 |
| C | 0 | 1627 | 0 |
| D | 0 | 1624 | 0 |
| Mode M9 | |||
|---|---|---|---|
| Quadrant | BADHDUFLAG | Total packets | Discarded packets |
| A | 0 | 134 | 0 |
| B | 0 | 132 | 0 |
| C | 0 | 133 | 0 |
| D | 0 | 135 | 0 |
| Quadrant | Total seconds | Saturated seconds | Saturation percentage |
|---|---|---|---|
| A | 79590 | 3793 | 4.765674% |
| B | 79546 | 1480 | 1.860559% |
| C | 79593 | 559 | 0.702323% |
| D | 78970 | 5294 | 6.703812% |
Noise dominated data is calculated using 1-second bins in cleaned event files. If a bin has >2000 counts, and if more than 50% of those come from <1% of pixels, then it is considered to be noise-dominated and hence unusable.
| Quadrant | # 1 sec bins | Bins with >0 counts | Bins with >2000 counts | High rate bins dominated by noise | Noise dominated (total time) | Noise dominated (detector-on time) | Marked lightcurve |
|---|---|---|---|---|---|---|---|
| A | 95570 | 80663 | 0 | 0 | 0.00% | 0.00% |  |
| B | 95570 | 80611 | 0 | 0 | 0.00% | 0.00% |  |
| C | 95570 | 80649 | 0 | 0 | 0.00% | 0.00% |  |
| D | 95570 | 79867 | 0 | 0 | 0.00% | 0.00% |  |
Top three noisy pixels from each quadrant. If the there are fewer than three noisy pixels in the level2.evt file, extra rows are filled as -1
| Pixel properties | Quadrant properties | ||||||
|---|---|---|---|---|---|---|---|
| Quadrant | DetID | PixID | Counts | Sigma | Mean | Median | Sigma |
| A | 0 | 29 | 4268 | 11.24 | 1132 | 1055 | 286.0 |
| A | 7 | 110 | 3725 | 9.34 | 1132 | 1055 | 286.0 |
| A | 0 | 30 | 3266 | 7.73 | 1132 | 1055 | 286.0 |
| B | 2 | 9 | 3745 | 11.87 | 1135 | 1079 | 224.6 |
| B | 12 | 226 | 2890 | 8.06 | 1135 | 1079 | 224.6 |
| B | 14 | 254 | 2886 | 8.05 | 1135 | 1079 | 224.6 |
| C | 12 | 241 | 3082 | 6.53 | 1166 | 1082 | 306.2 |
| C | 3 | 126 | 2926 | 6.02 | 1166 | 1082 | 306.2 |
| C | 2 | 191 | 2911 | 5.97 | 1166 | 1082 | 306.2 |
| D | 7 | 3 | 2635 | 6.18 | 1027 | 930 | 275.7 |
| D | 3 | 14 | 2619 | 6.13 | 1027 | 930 | 275.7 |
| D | 7 | 5 | 2589 | 6.02 | 1027 | 930 | 275.7 |
Histogram calculated using DETX and DETY for each event in the final _common_clean file
| Quadrant A |  |
 |
Quadrant B |
|---|---|---|---|
| Quadrant D | 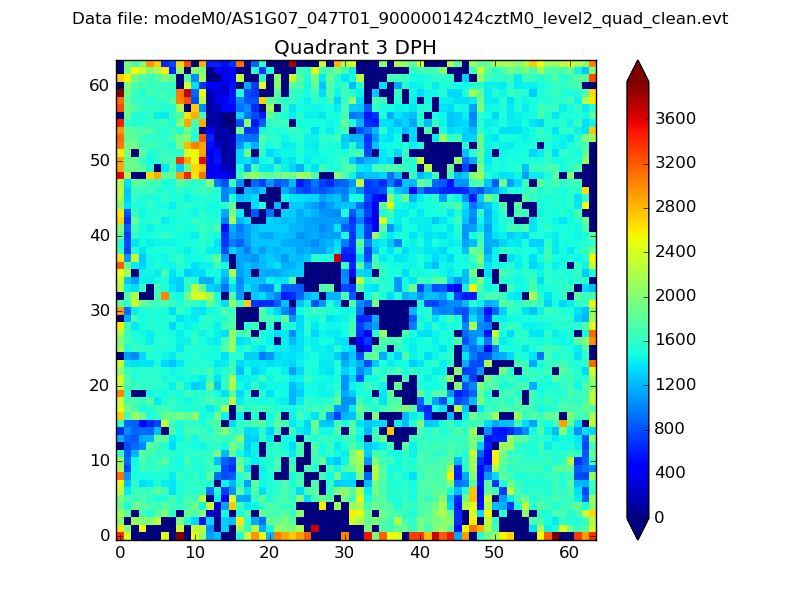 |
 |
Quadrant C |
| Plot type | Count rate plots | Images |
|---|---|---|
| Comparison with Poisson distribution Blue bars denote a histogram of data divided into 1 sec bins. Red curve is a Poisson curve with rate = median count rate of data. |
 |
 |
| Quadrant-wise count rates Data is divided into 100 sec bins |
 |
|
| Module-wise count rates for Quadrant A Data is divided into 100 sec bins |
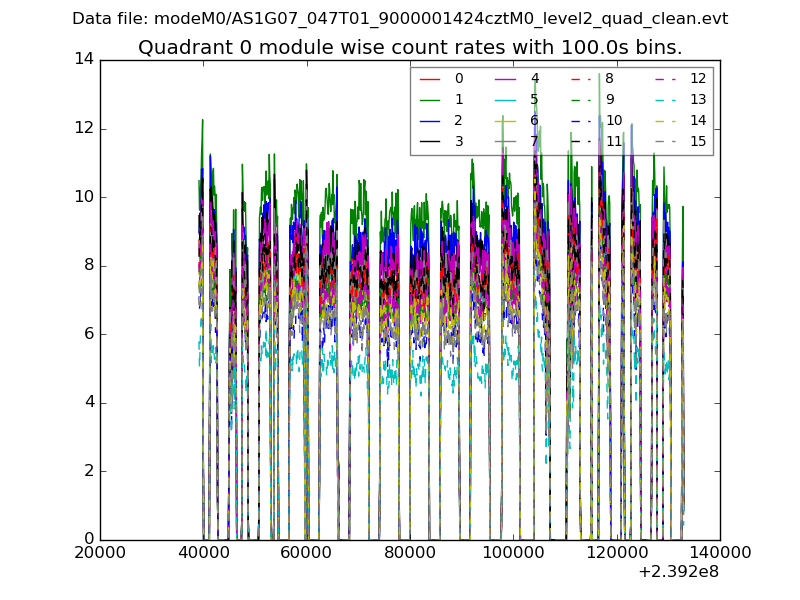 |
 |
| Module-wise count rates for Quadrant B Data is divided into 100 sec bins |
 |
 |
| Module-wise count rates for Quadrant C Data is divided into 100 sec bins |
 |
 |
| Module-wise count rates for Quadrant D Data is divided into 100 sec bins |
 |
 |
| Parameter | Plot |
|---|---|
| CZT HV Monitor |  |
| D_VDD |  |
| Temperature 1 |  |
| Veto HV Monitor |  |
| Veto LLD |  |
| Alpha Counter |  |
| _CPM_Rate |  |
| CZT Counter |  |
| +2.5 Volts monitor |  |
| +5 Volts monitor |  |
| _ROLL_ROT |  |
| _Roll_DEC |  |
| _Roll_RA |  |
| Veto Counter |  |