| Param | Original file | Final file |
|---|---|---|
| Filename | modeM0/AS1G07_047T01_9000001424_09959cztM0_level2.evt | modeM0/AS1G07_047T01_9000001424_09959cztM0_level2_quad_clean.evt |
| Size (bytes) | 386,124,480 | 47,076,480 |
| Size | 368.2 MB | 44.9 MB |
| Events in quadrant A | 1,887,227 | 303,738 |
| Events in quadrant B | 2,897,024 | 303,793 |
| Events in quadrant C | 1,887,438 | 313,330 |
| Events in quadrant D | 4,752,296 | 224,188 |
| Mode M0 | |||
|---|---|---|---|
| Quadrant | BADHDUFLAG | Total packets | Discarded packets |
| A | 0 | 8461 | 143 |
| B | 0 | 11444 | 181 |
| C | 0 | 8401 | 123 |
| D | 0 | 17078 | 365 |
| Mode SS | |||
|---|---|---|---|
| Quadrant | BADHDUFLAG | Total packets | Discarded packets |
| A | 0 | 80 | 0 |
| B | 0 | 80 | 4 |
| C | 0 | 80 | 2 |
| D | 0 | 80 | 0 |
| Mode M9 | |||
|---|---|---|---|
| Quadrant | BADHDUFLAG | Total packets | Discarded packets |
| A | 0 | 14 | 0 |
| B | 0 | 14 | 0 |
| C | 0 | 14 | 0 |
| D | 0 | 14 | 0 |
| Quadrant | Total seconds | Saturated seconds | Saturation percentage |
|---|---|---|---|
| A | 3972 | 33 | 0.830816% |
| B | 3975 | 262 | 6.591195% |
| C | 3981 | 7 | 0.175835% |
| D | 3962 | 820 | 20.696618% |
Noise dominated data is calculated using 1-second bins in cleaned event files. If a bin has >2000 counts, and if more than 50% of those come from <1% of pixels, then it is considered to be noise-dominated and hence unusable.
| Quadrant | # 1 sec bins | Bins with >0 counts | Bins with >2000 counts | High rate bins dominated by noise | Noise dominated (total time) | Noise dominated (detector-on time) | Marked lightcurve |
|---|---|---|---|---|---|---|---|
| A | 5344 | 4039 | 0 | 0 | 0.00% | 0.00% | 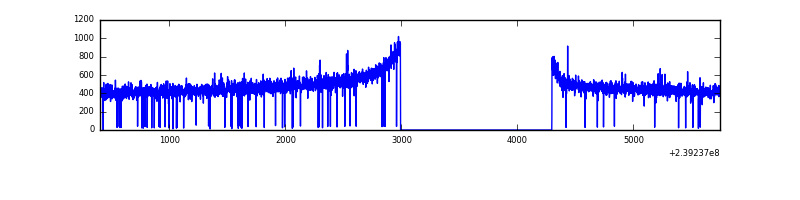 |
| B | 5344 | 4033 | 174 | 174 | 3.26% | 4.31% | 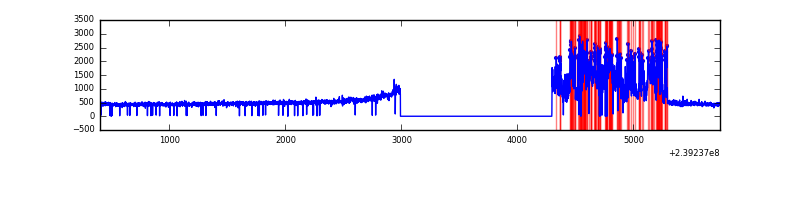 |
| C | 5344 | 4038 | 0 | 0 | 0.00% | 0.00% | 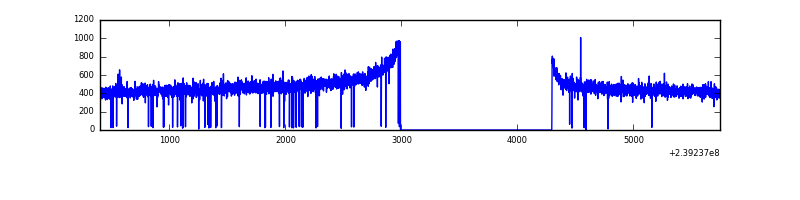 |
| D | 5344 | 4015 | 712 | 712 | 13.32% | 17.73% | 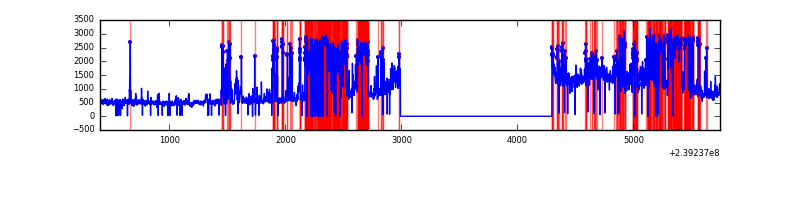 |
Top three noisy pixels from each quadrant. If the there are fewer than three noisy pixels in the level2.evt file, extra rows are filled as -1
| Pixel properties | Quadrant properties | ||||||
|---|---|---|---|---|---|---|---|
| Quadrant | DetID | PixID | Counts | Sigma | Mean | Median | Sigma |
| A | 0 | 226 | 4510 | 40.1 | 488 | 479 | 100.5 |
| A | 13 | 253 | 4241 | 37.42 | 488 | 479 | 100.5 |
| A | 12 | 194 | 3998 | 35.0 | 488 | 479 | 100.5 |
| B | 4 | 81 | 899742 | 9386.81 | 490 | 479 | 95.8 |
| B | 4 | 239 | 45534 | 470.3 | 490 | 479 | 95.8 |
| B | 0 | 214 | 15306 | 154.77 | 490 | 479 | 95.8 |
| C | 13 | 61 | 3653 | 28.05 | 483 | 486 | 112.9 |
| C | 14 | 67 | 3072 | 22.91 | 483 | 486 | 112.9 |
| C | 8 | 222 | 1634 | 10.17 | 483 | 486 | 112.9 |
| D | 1 | 52 | 1809157 | 17812.18 | 415 | 403 | 101.5 |
| D | 2 | 16 | 801141 | 7885.48 | 415 | 403 | 101.5 |
| D | 8 | 195 | 289491 | 2846.87 | 415 | 403 | 101.5 |
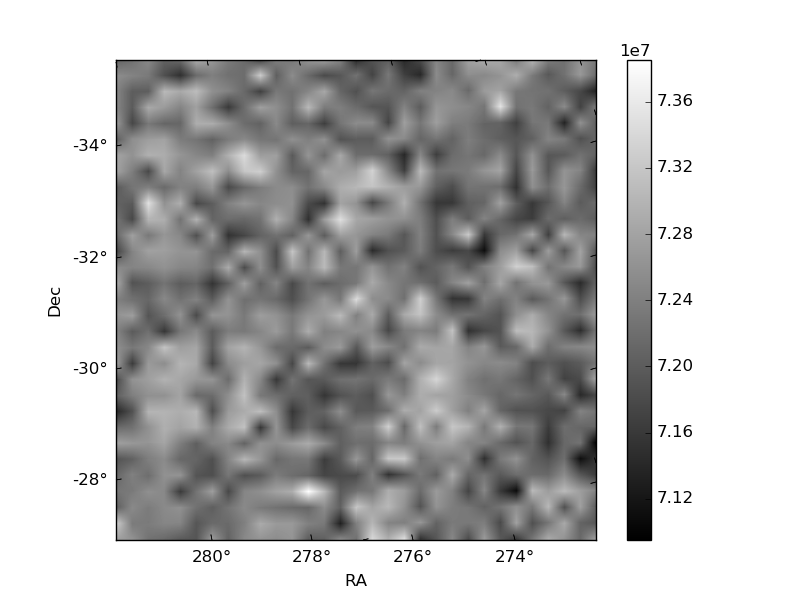
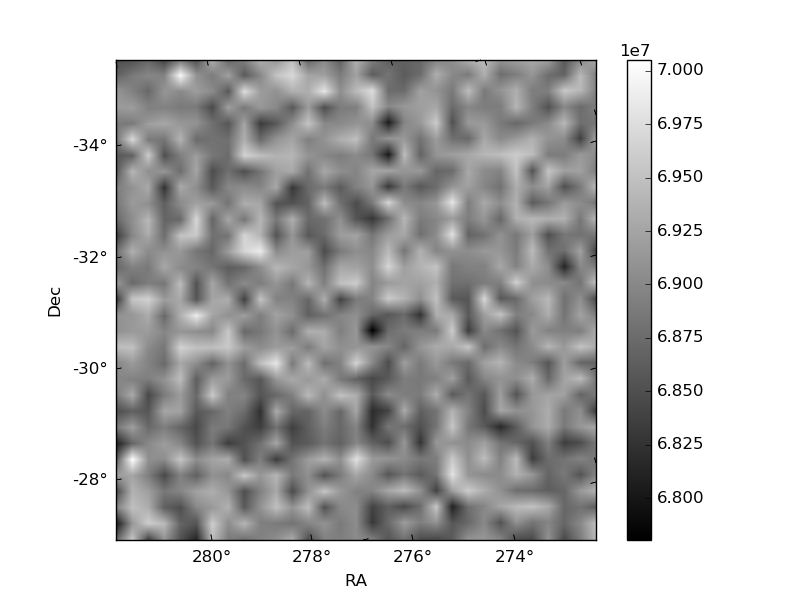
Histogram calculated using DETX and DETY for each event in the final _common_clean file
| Quadrant A | 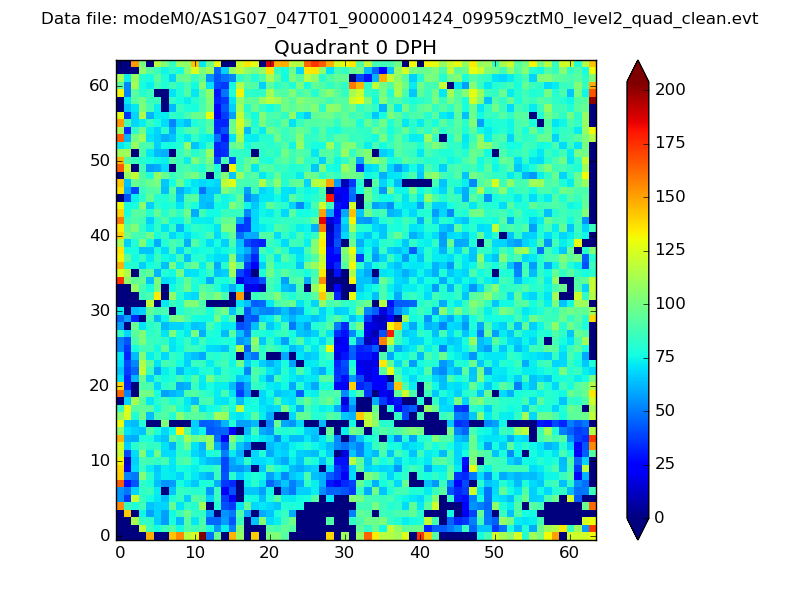 |
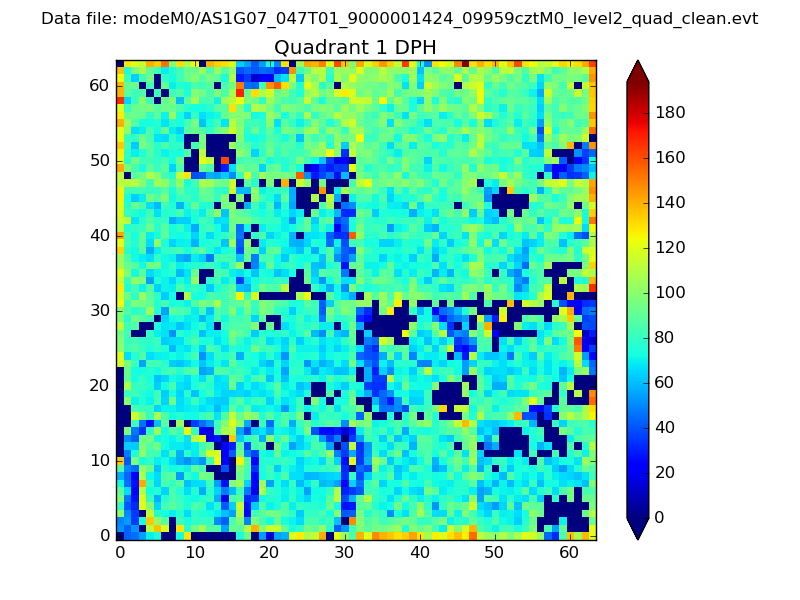 |
Quadrant B |
|---|---|---|---|
| Quadrant D | 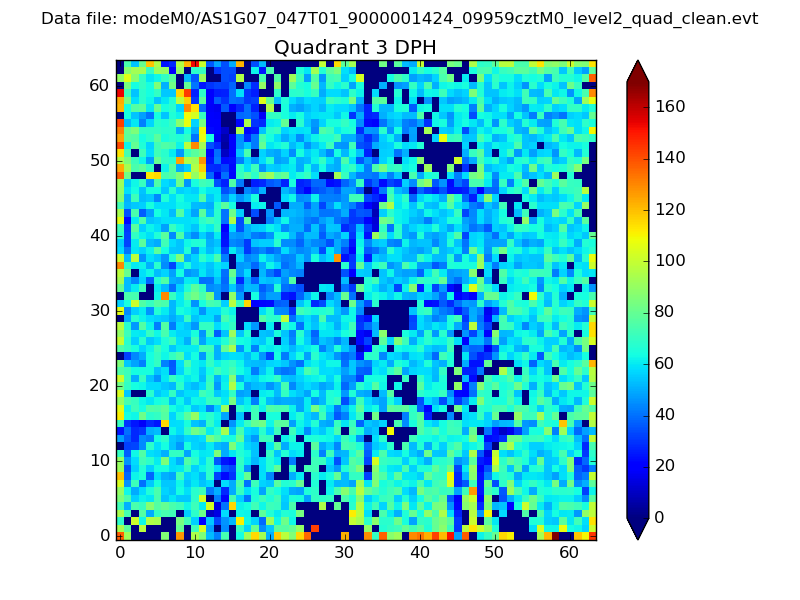 |
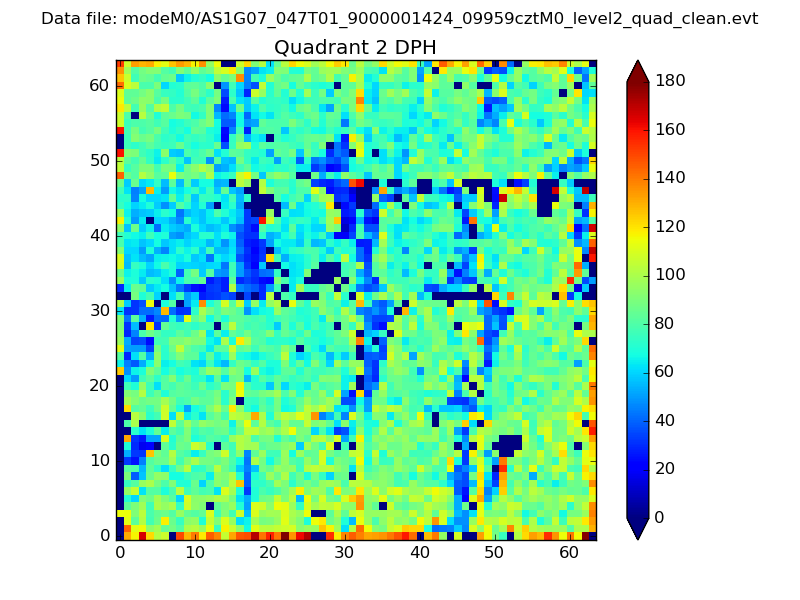 |
Quadrant C |
| Plot type | Count rate plots | Images |
|---|---|---|
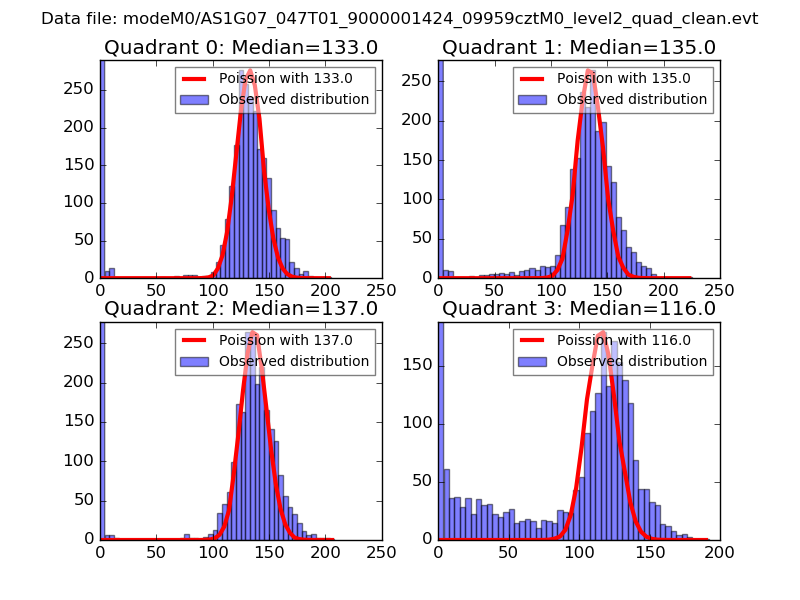
| Comparison with Poisson distribution Blue bars denote a histogram of data divided into 1 sec bins. Red curve is a Poisson curve with rate = median count rate of data. |
 |
 |
| Quadrant-wise count rates Data is divided into 100 sec bins |
 |
|
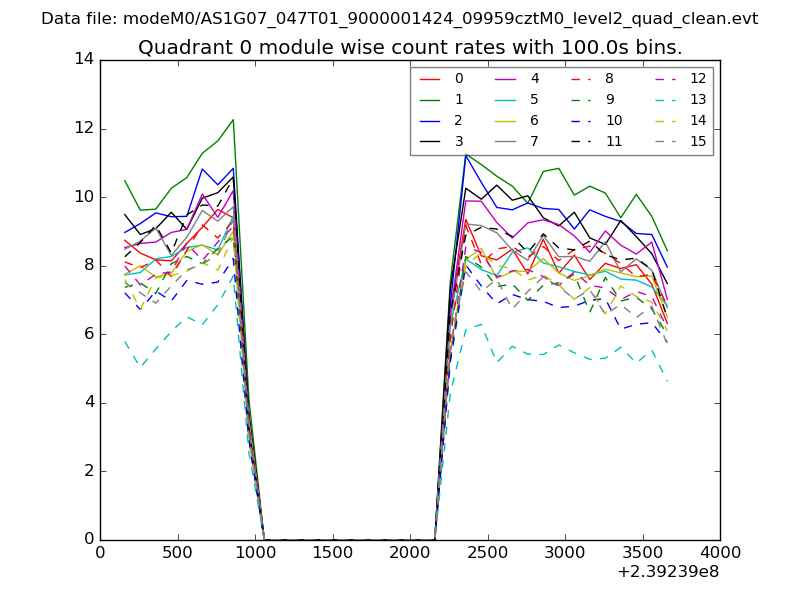
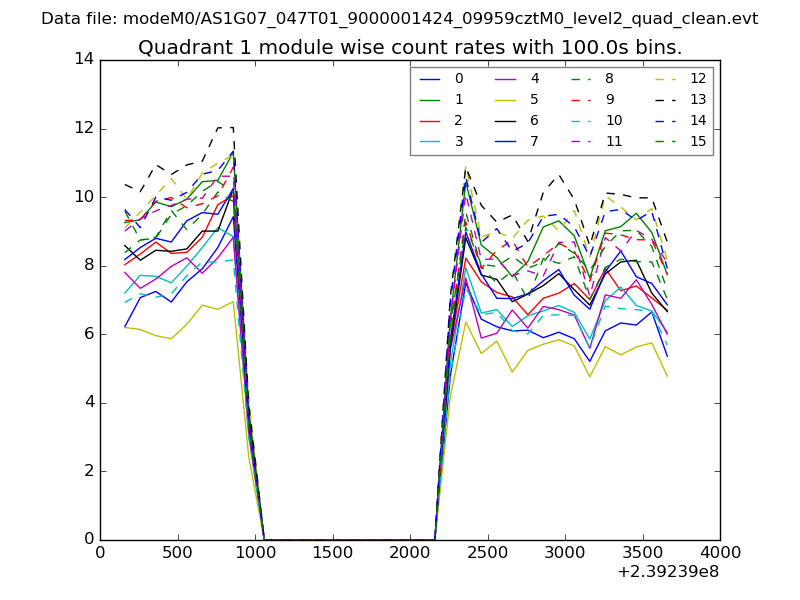
| Module-wise count rates for Quadrant A Data is divided into 100 sec bins |
 |
 |
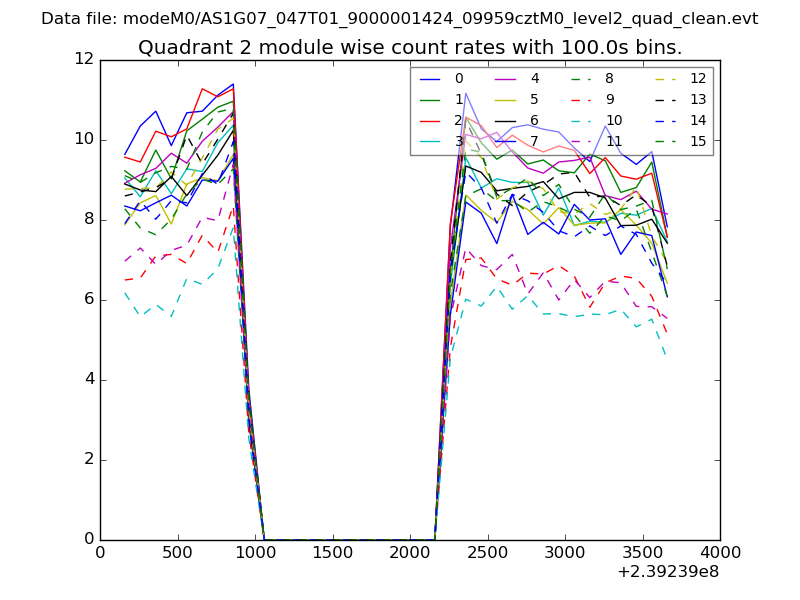
| Module-wise count rates for Quadrant B Data is divided into 100 sec bins |
 |
 |
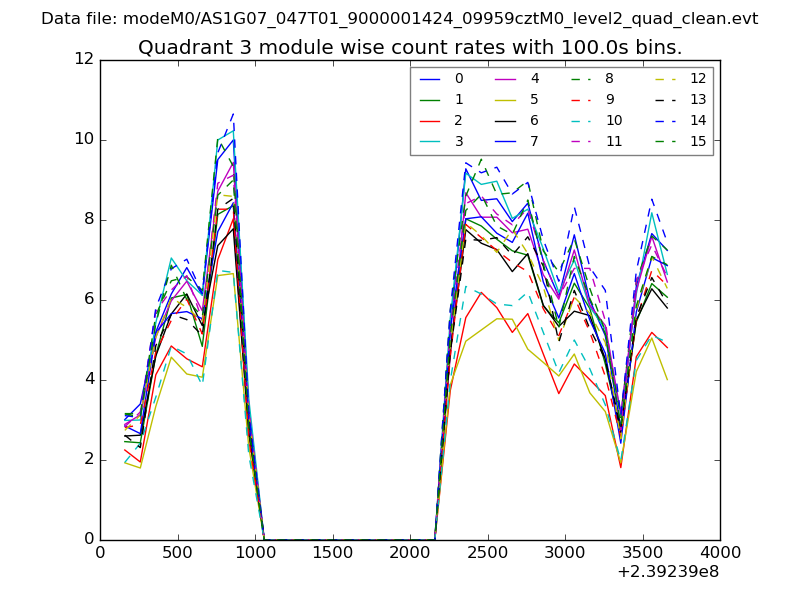
| Module-wise count rates for Quadrant C Data is divided into 100 sec bins |
 |
 |
| Module-wise count rates for Quadrant D Data is divided into 100 sec bins |
 |
 |
| Parameter | Plot |
|---|---|
| CZT HV Monitor | 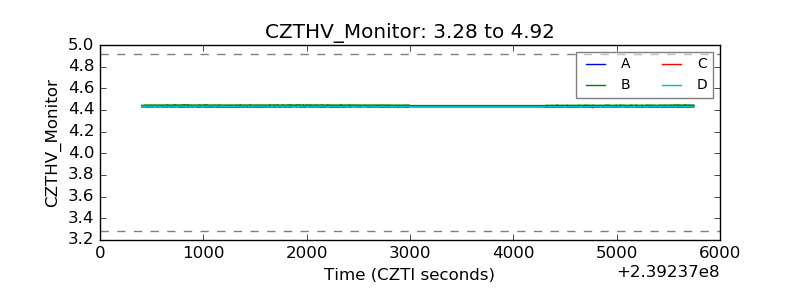 |
| D_VDD | 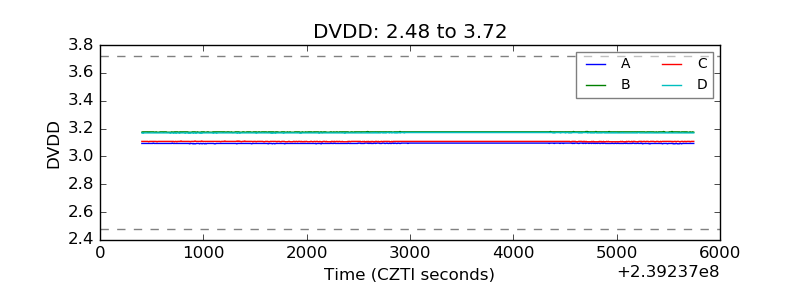 |
| Temperature 1 | 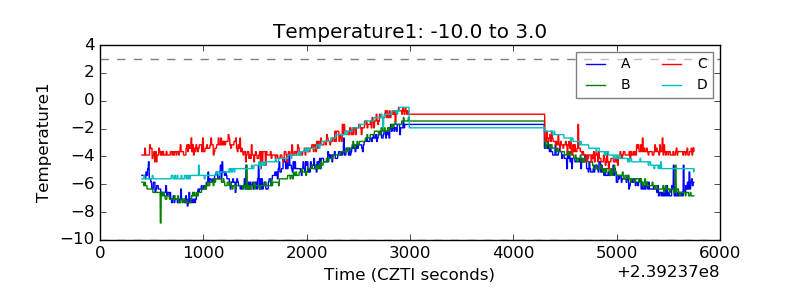 |
| Veto HV Monitor | 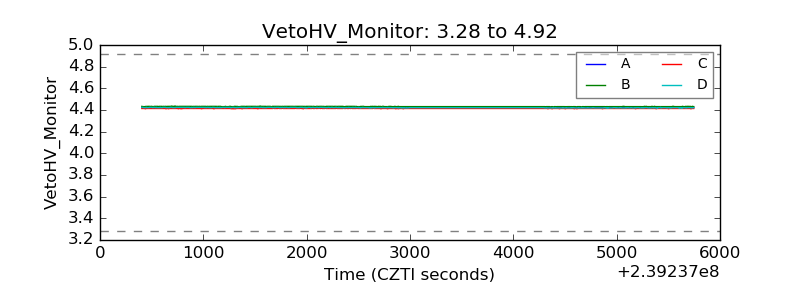 |
| Veto LLD |  |
| Alpha Counter |  |
| _CPM_Rate | 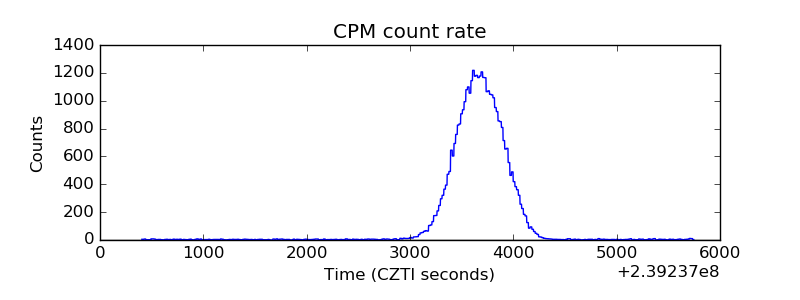 |
| CZT Counter | 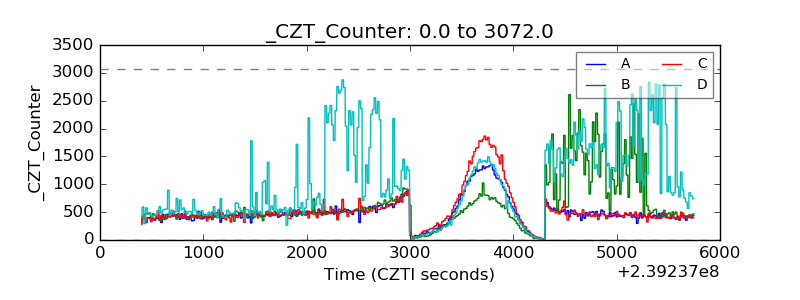 |
| +2.5 Volts monitor |  |
| +5 Volts monitor |  |
| _ROLL_ROT | 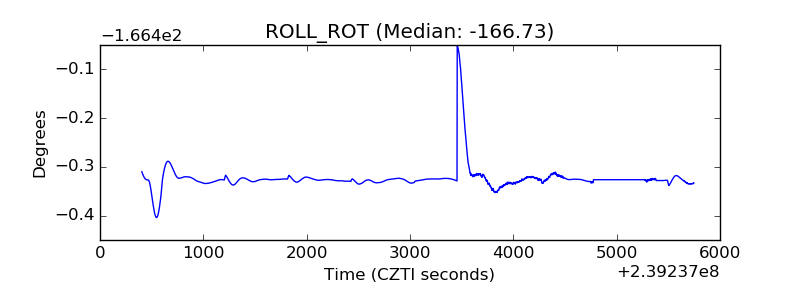 |
| _Roll_DEC | 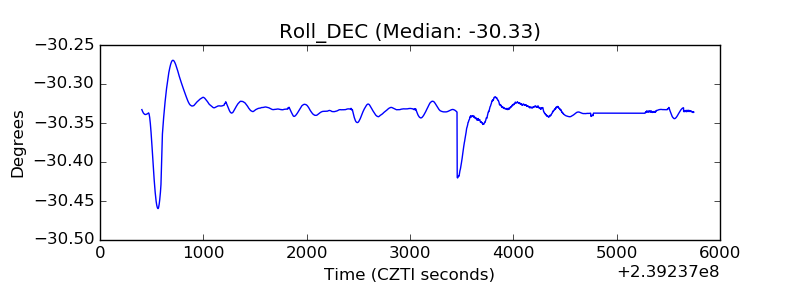 |
| _Roll_RA | 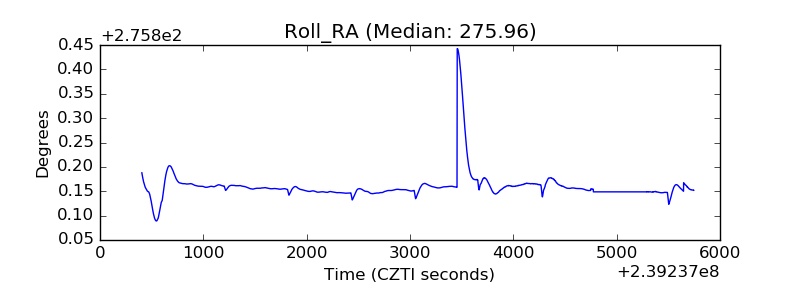 |
| Veto Counter | 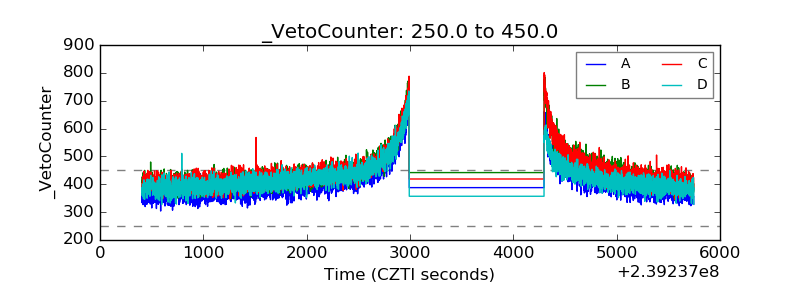 |