| Param | Original file | Final file |
|---|---|---|
| Filename | modeM0/AS1G07_047T01_9000001424_09961cztM0_level2.evt | modeM0/AS1G07_047T01_9000001424_09961cztM0_level2_quad_clean.evt |
| Size (bytes) | 513,207,360 | 83,871,360 |
| Size | 489.4 MB | 80.0 MB |
| Events in quadrant A | 3,247,495 | 510,440 |
| Events in quadrant B | 3,615,514 | 521,914 |
| Events in quadrant C | 3,167,099 | 522,428 |
| Events in quadrant D | 5,024,017 | 483,804 |
| Mode M0 | |||
|---|---|---|---|
| Quadrant | BADHDUFLAG | Total packets | Discarded packets |
| A | 0 | 14764 | 3 |
| B | 0 | 15582 | 2 |
| C | 0 | 14621 | 2 |
| D | 0 | 19831 | 2 |
| Mode SS | |||
|---|---|---|---|
| Quadrant | BADHDUFLAG | Total packets | Discarded packets |
| A | 0 | 146 | 0 |
| B | 0 | 146 | 0 |
| C | 0 | 146 | 0 |
| D | 0 | 146 | 0 |
| Mode M9 | |||
|---|---|---|---|
| Quadrant | BADHDUFLAG | Total packets | Discarded packets |
| A | 0 | 8 | 0 |
| B | 0 | 8 | 0 |
| C | 0 | 8 | 0 |
| D | 0 | 9 | 0 |
| Quadrant | Total seconds | Saturated seconds | Saturation percentage |
|---|---|---|---|
| A | 7195 | 30 | 0.416956% |
| B | 7195 | 94 | 1.306463% |
| C | 7195 | 19 | 0.264072% |
| D | 7195 | 281 | 3.905490% |
Noise dominated data is calculated using 1-second bins in cleaned event files. If a bin has >2000 counts, and if more than 50% of those come from <1% of pixels, then it is considered to be noise-dominated and hence unusable.
| Quadrant | # 1 sec bins | Bins with >0 counts | Bins with >2000 counts | High rate bins dominated by noise | Noise dominated (total time) | Noise dominated (detector-on time) | Marked lightcurve |
|---|---|---|---|---|---|---|---|
| A | 7890 | 7196 | 7 | 7 | 0.09% | 0.10% | 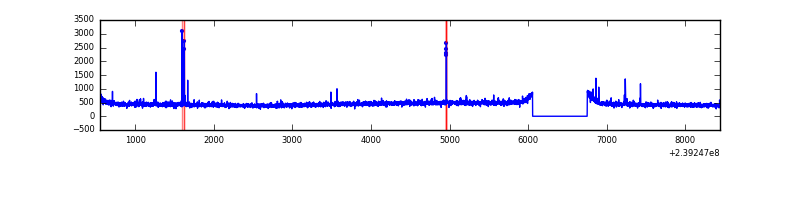 |
| B | 7890 | 7196 | 26 | 26 | 0.33% | 0.36% | 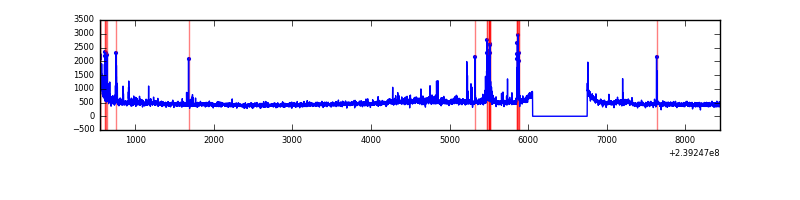 |
| C | 7890 | 7195 | 0 | 0 | 0.00% | 0.00% | 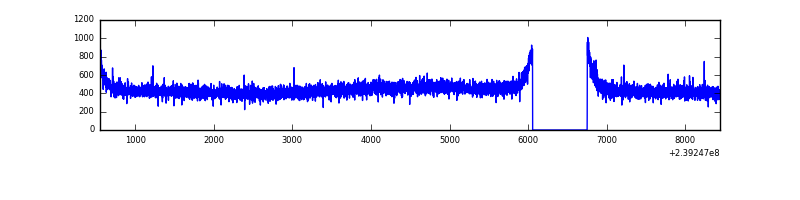 |
| D | 7890 | 7195 | 183 | 183 | 2.32% | 2.54% | 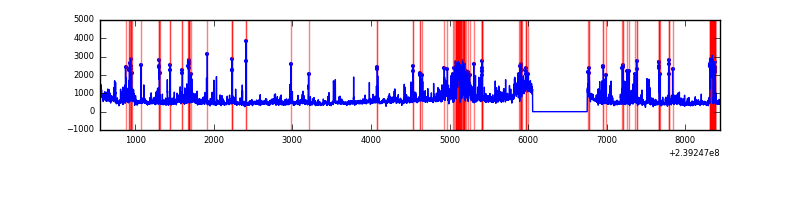 |
Top three noisy pixels from each quadrant. If the there are fewer than three noisy pixels in the level2.evt file, extra rows are filled as -1
| Pixel properties | Quadrant properties | ||||||
|---|---|---|---|---|---|---|---|
| Quadrant | DetID | PixID | Counts | Sigma | Mean | Median | Sigma |
| A | 15 | 239 | 17796 | 99.89 | 828 | 810 | 170.0 |
| A | 15 | 174 | 17564 | 98.53 | 828 | 810 | 170.0 |
| A | 14 | 111 | 9965 | 53.84 | 828 | 810 | 170.0 |
| B | 4 | 81 | 120966 | 741.56 | 838 | 815 | 162.0 |
| B | 4 | 239 | 88016 | 538.19 | 838 | 815 | 162.0 |
| B | 0 | 214 | 53590 | 325.72 | 838 | 815 | 162.0 |
| C | 13 | 61 | 6072 | 27.81 | 810 | 813 | 189.1 |
| C | 14 | 67 | 4444 | 19.2 | 810 | 813 | 189.1 |
| C | 8 | 222 | 2738 | 10.18 | 810 | 813 | 189.1 |
| D | 1 | 52 | 665843 | 3245.55 | 788 | 771 | 204.9 |
| D | 8 | 195 | 359609 | 1751.13 | 788 | 771 | 204.9 |
| D | 2 | 152 | 283634 | 1380.37 | 788 | 771 | 204.9 |
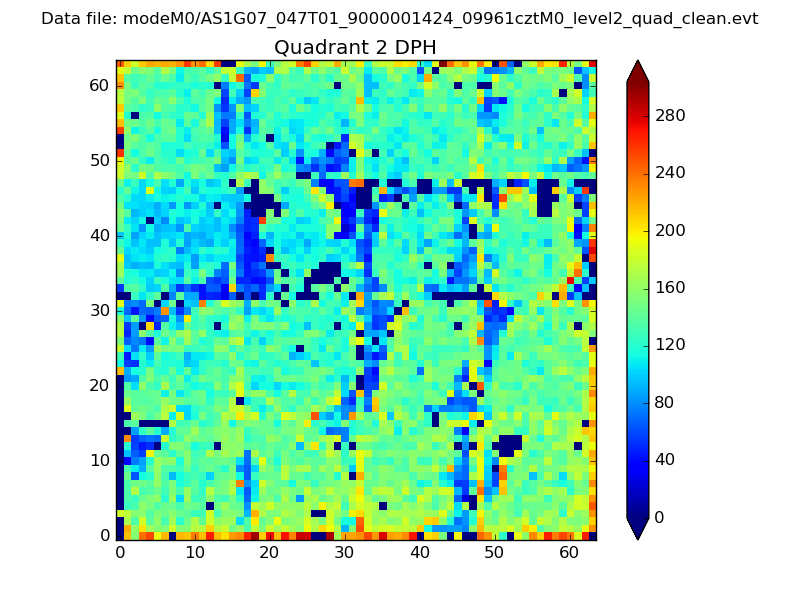
Histogram calculated using DETX and DETY for each event in the final _common_clean file
| Quadrant A |  |
 |
Quadrant B |
|---|---|---|---|
| Quadrant D | 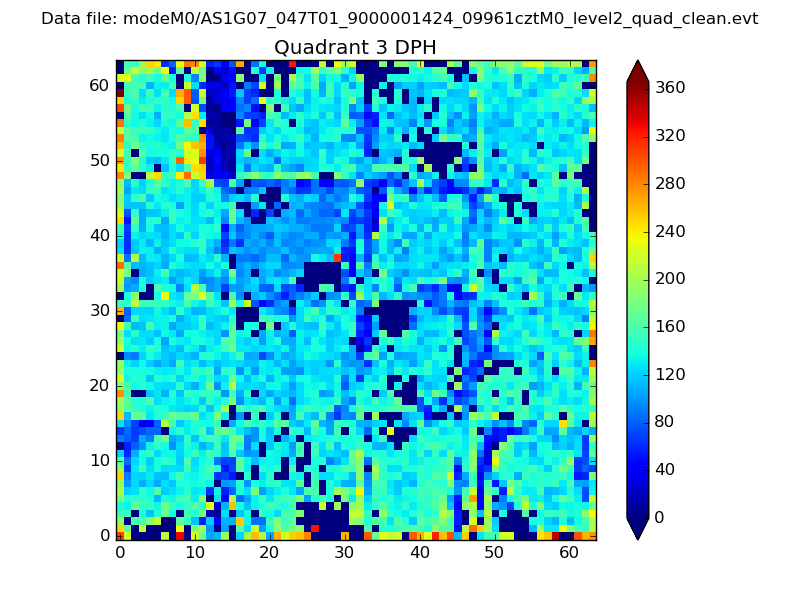 |
 |
Quadrant C |
| Plot type | Count rate plots | Images |
|---|---|---|
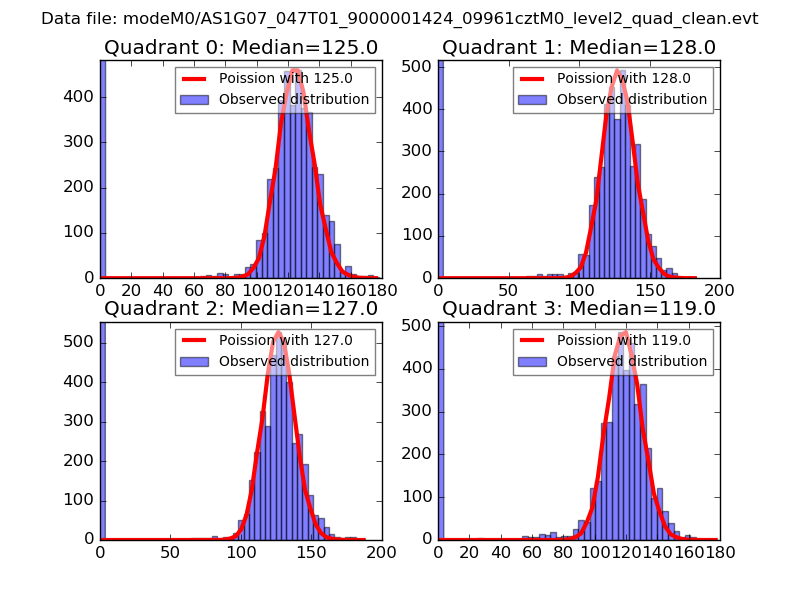
| Comparison with Poisson distribution Blue bars denote a histogram of data divided into 1 sec bins. Red curve is a Poisson curve with rate = median count rate of data. |
 |
 |
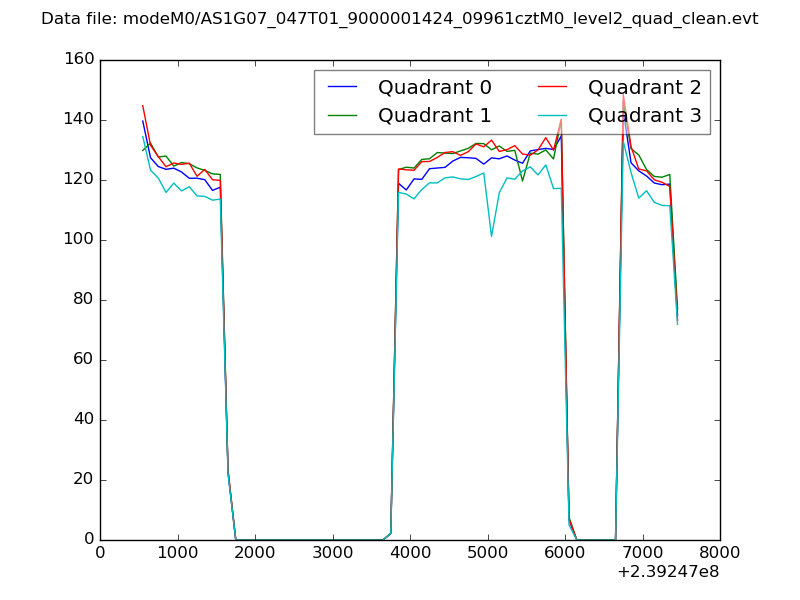
| Quadrant-wise count rates Data is divided into 100 sec bins |
 |
|
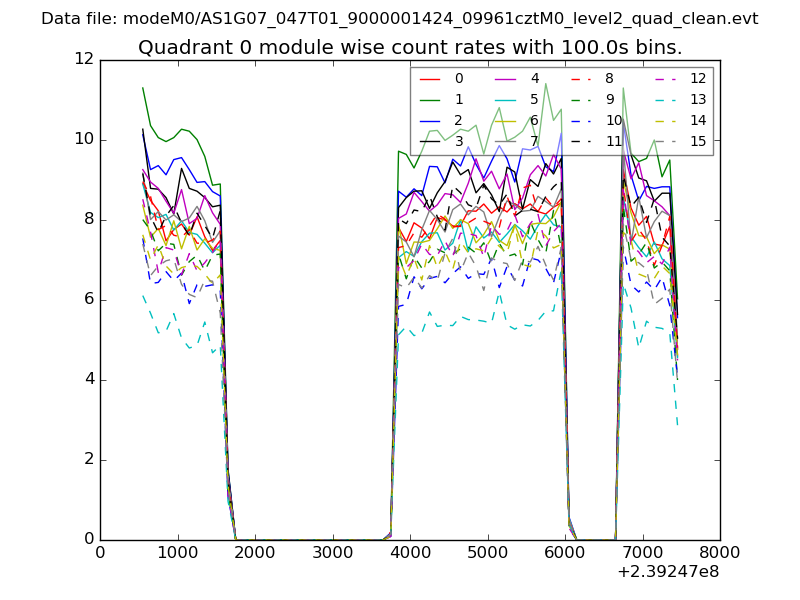
| Module-wise count rates for Quadrant A Data is divided into 100 sec bins |
 |
 |
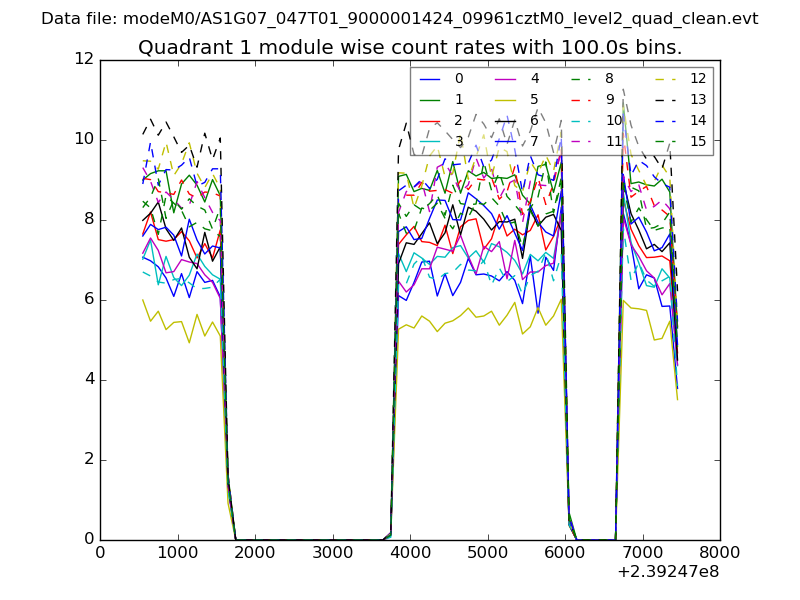
| Module-wise count rates for Quadrant B Data is divided into 100 sec bins |
 |
 |
| Module-wise count rates for Quadrant C Data is divided into 100 sec bins |
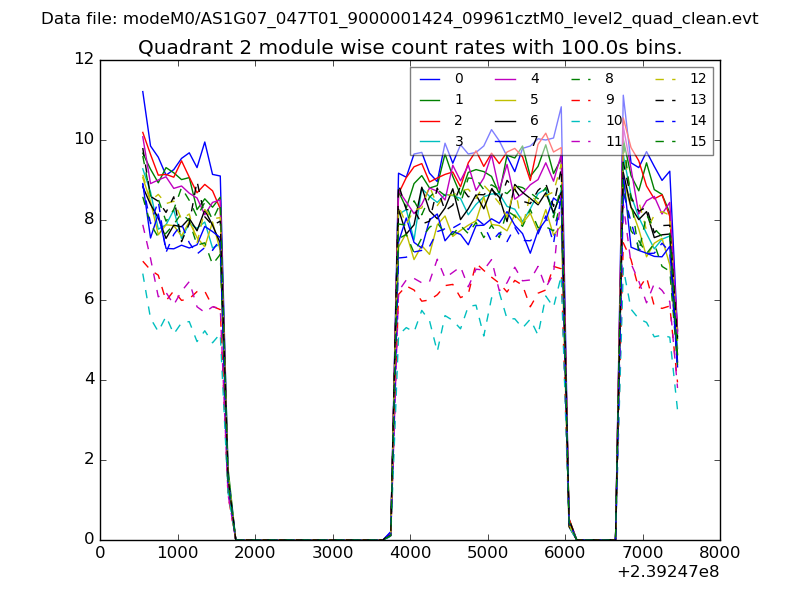 |
 |
| Module-wise count rates for Quadrant D Data is divided into 100 sec bins |
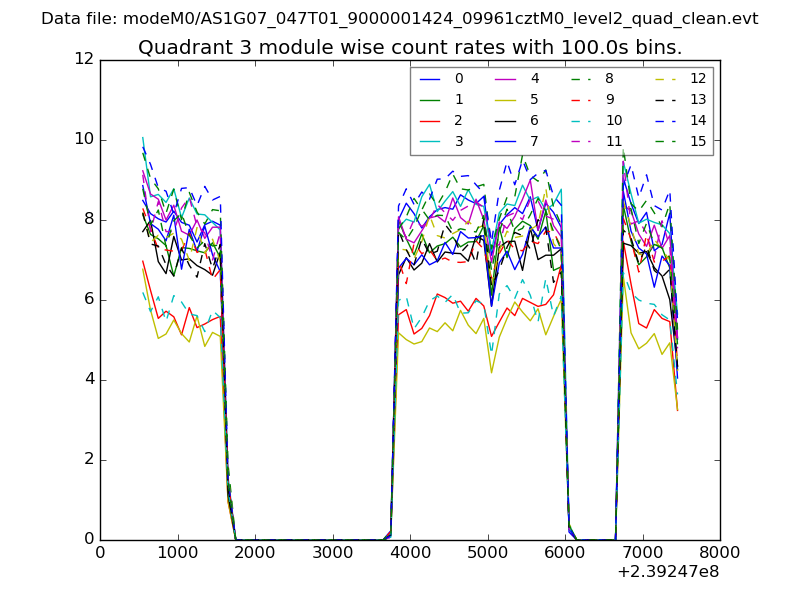 |
 |
| Parameter | Plot |
|---|---|
| CZT HV Monitor | 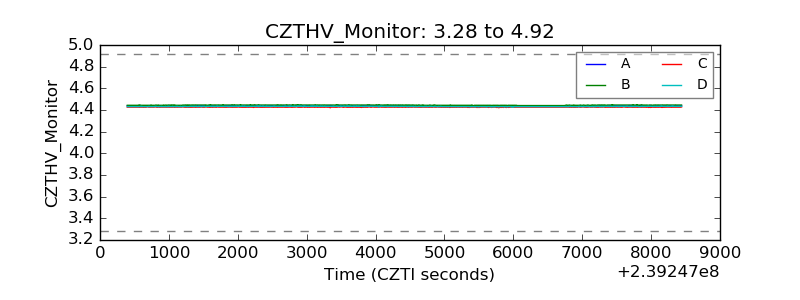 |
| D_VDD | 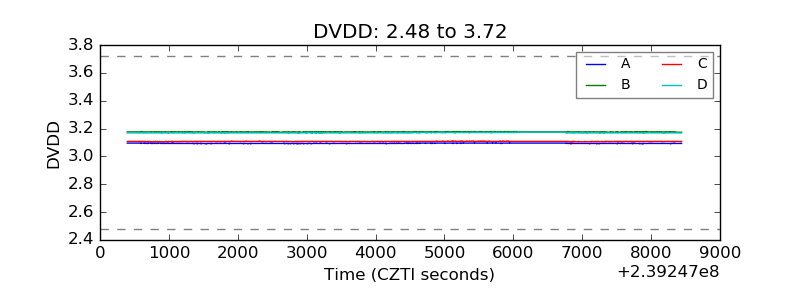 |
| Temperature 1 | 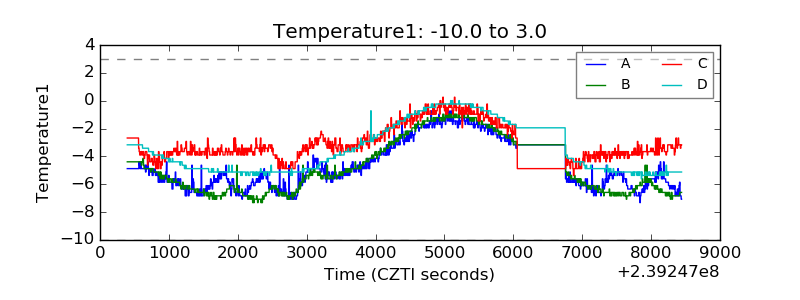 |
| Veto HV Monitor | 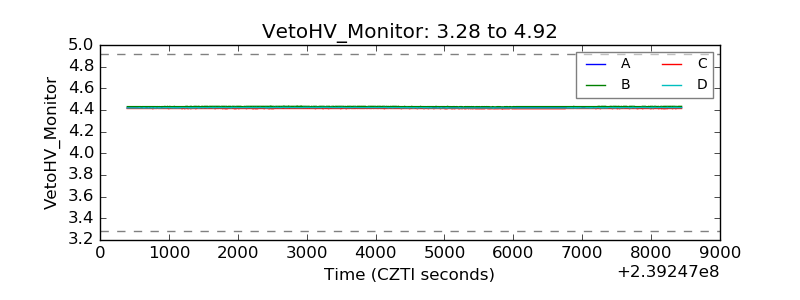 |
| Veto LLD | 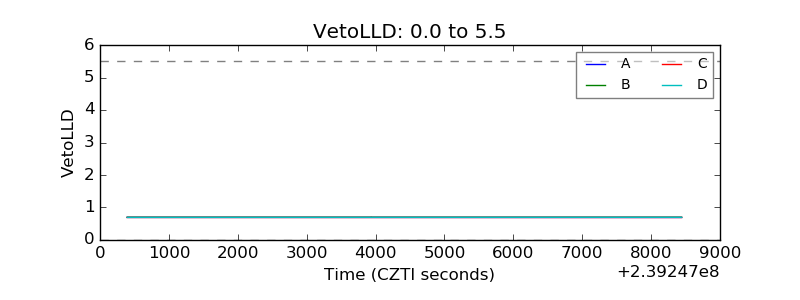 |
| Alpha Counter | 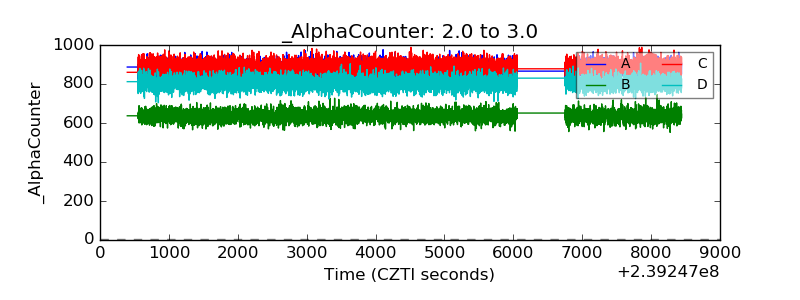 |
| _CPM_Rate | 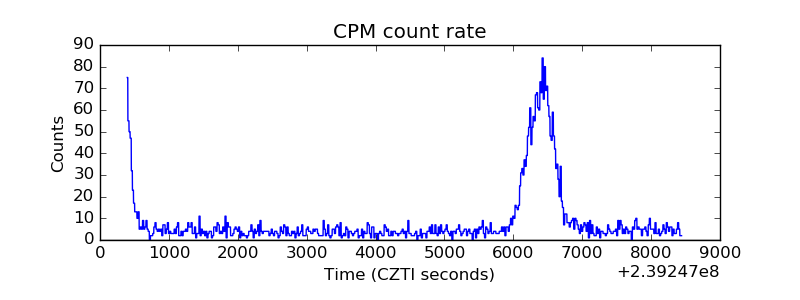 |
| CZT Counter | 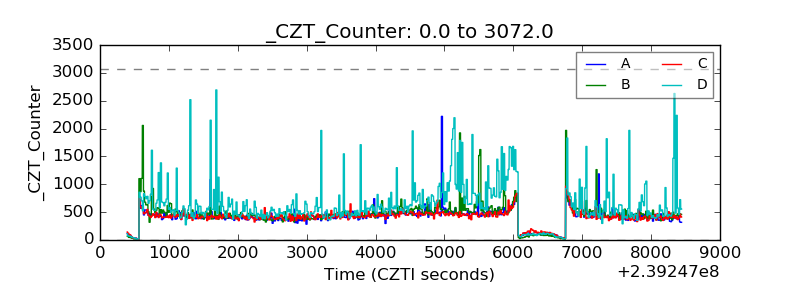 |
| +2.5 Volts monitor |  |
| +5 Volts monitor |  |
| _ROLL_ROT | 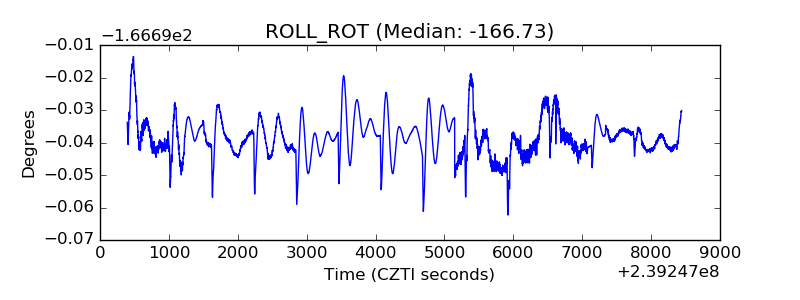 |
| _Roll_DEC | 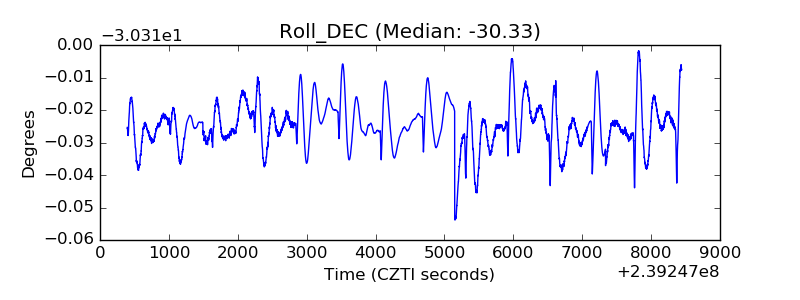 |
| _Roll_RA |  |
| Veto Counter | 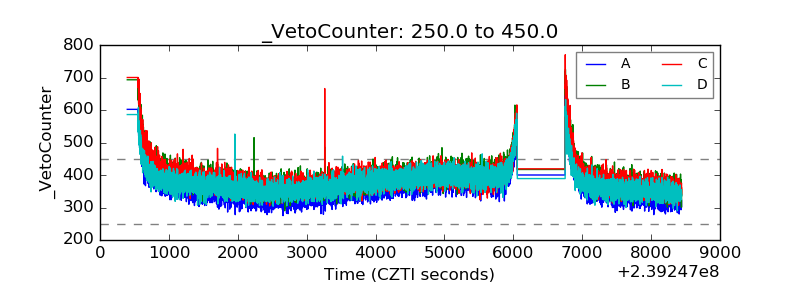 |