| Param | Original file | Final file |
|---|---|---|
| Filename | modeM0/AS1G07_047T01_9000001424_09962cztM0_level2.evt | modeM0/AS1G07_047T01_9000001424_09962cztM0_level2_quad_clean.evt |
| Size (bytes) | 1,280,327,040 | 196,807,680 |
| Size | 1.2 GB | 187.7 MB |
| Events in quadrant A | 7,871,144 | 1,200,124 |
| Events in quadrant B | 8,689,022 | 1,225,068 |
| Events in quadrant C | 7,732,430 | 1,223,753 |
| Events in quadrant D | 13,307,514 | 1,112,790 |
| Mode M0 | |||
|---|---|---|---|
| Quadrant | BADHDUFLAG | Total packets | Discarded packets |
| A | 0 | 35645 | 4 |
| B | 0 | 37541 | 3 |
| C | 0 | 35453 | 3 |
| D | 0 | 51541 | 3 |
| Mode SS | |||
|---|---|---|---|
| Quadrant | BADHDUFLAG | Total packets | Discarded packets |
| A | 0 | 354 | 0 |
| B | 0 | 354 | 0 |
| C | 0 | 354 | 0 |
| D | 0 | 354 | 0 |
| Mode M9 | |||
|---|---|---|---|
| Quadrant | BADHDUFLAG | Total packets | Discarded packets |
| A | 0 | 21 | 0 |
| B | 0 | 21 | 0 |
| C | 0 | 21 | 0 |
| D | 0 | 21 | 0 |
| Quadrant | Total seconds | Saturated seconds | Saturation percentage |
|---|---|---|---|
| A | 17384 | 83 | 0.477451% |
| B | 17384 | 221 | 1.271284% |
| C | 17384 | 64 | 0.368155% |
| D | 17384 | 919 | 5.286470% |
Noise dominated data is calculated using 1-second bins in cleaned event files. If a bin has >2000 counts, and if more than 50% of those come from <1% of pixels, then it is considered to be noise-dominated and hence unusable.
| Quadrant | # 1 sec bins | Bins with >0 counts | Bins with >2000 counts | High rate bins dominated by noise | Noise dominated (total time) | Noise dominated (detector-on time) | Marked lightcurve |
|---|---|---|---|---|---|---|---|
| A | 19504 | 17387 | 7 | 7 | 0.04% | 0.04% | 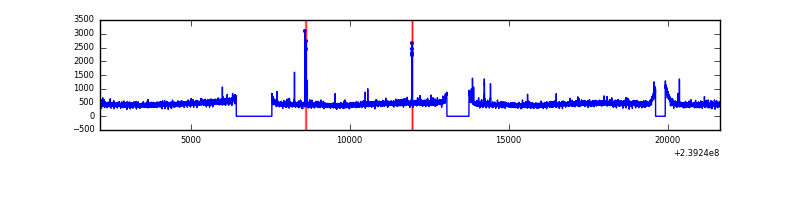 |
| B | 19504 | 17386 | 77 | 77 | 0.39% | 0.44% | 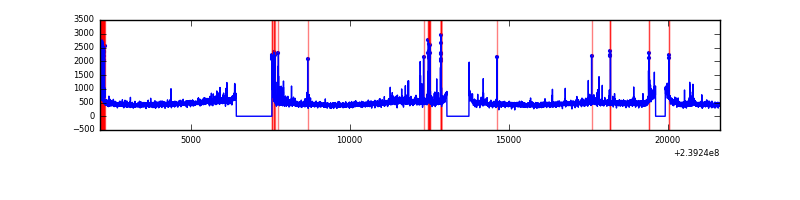 |
| C | 19504 | 17386 | 0 | 0 | 0.00% | 0.00% | 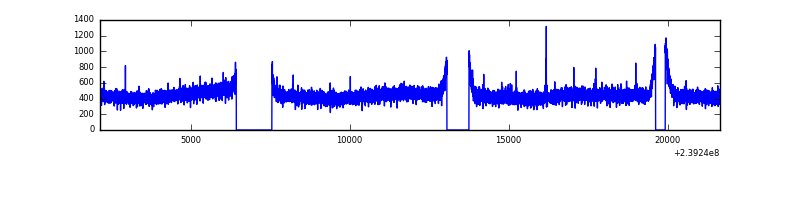 |
| D | 19504 | 17385 | 749 | 749 | 3.84% | 4.31% | 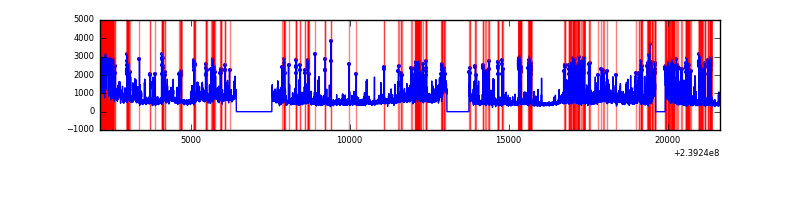 |
Top three noisy pixels from each quadrant. If the there are fewer than three noisy pixels in the level2.evt file, extra rows are filled as -1
| Pixel properties | Quadrant properties | ||||||
|---|---|---|---|---|---|---|---|
| Quadrant | DetID | PixID | Counts | Sigma | Mean | Median | Sigma |
| A | 15 | 174 | 27484 | 62.25 | 2021 | 1975 | 409.8 |
| A | 15 | 239 | 20254 | 44.61 | 2021 | 1975 | 409.8 |
| A | 14 | 111 | 18985 | 41.51 | 2021 | 1975 | 409.8 |
| B | 4 | 81 | 309237 | 791.42 | 2042 | 1993 | 388.2 |
| B | 0 | 214 | 118625 | 300.43 | 2042 | 1993 | 388.2 |
| B | 0 | 219 | 116689 | 295.44 | 2042 | 1993 | 388.2 |
| C | 13 | 61 | 14708 | 27.68 | 1978 | 1989 | 459.6 |
| C | 14 | 67 | 7635 | 12.29 | 1978 | 1989 | 459.6 |
| C | 8 | 222 | 7002 | 10.91 | 1978 | 1989 | 459.6 |
| D | 1 | 52 | 2864802 | 5952.7 | 1906 | 1859 | 480.9 |
| D | 8 | 195 | 879615 | 1825.05 | 1906 | 1859 | 480.9 |
| D | 2 | 16 | 634020 | 1314.4 | 1906 | 1859 | 480.9 |
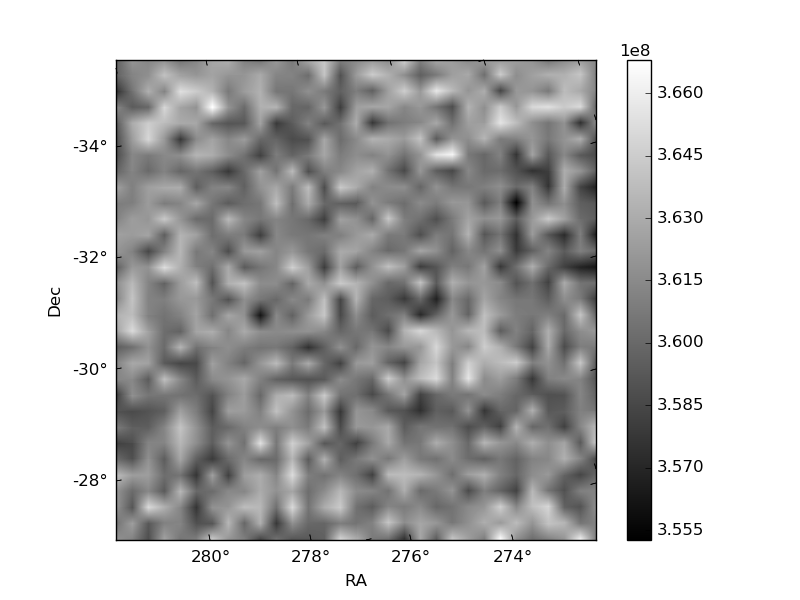
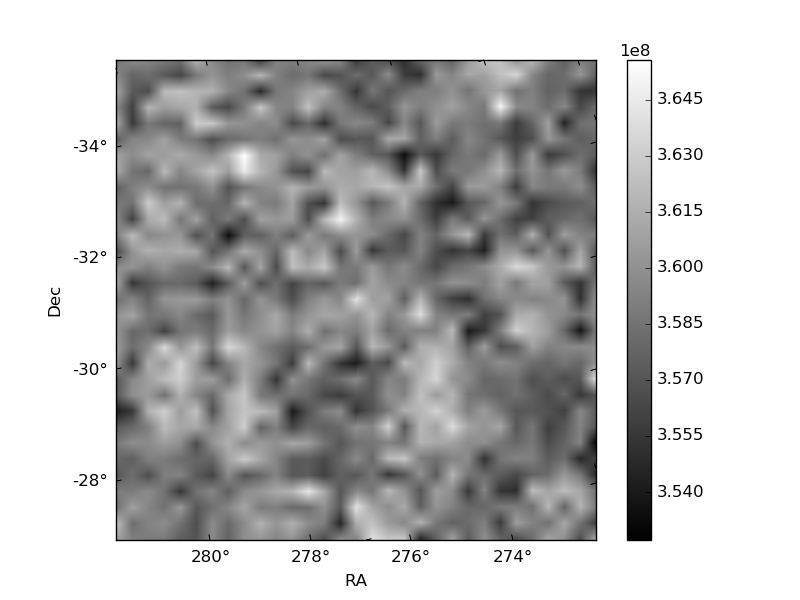
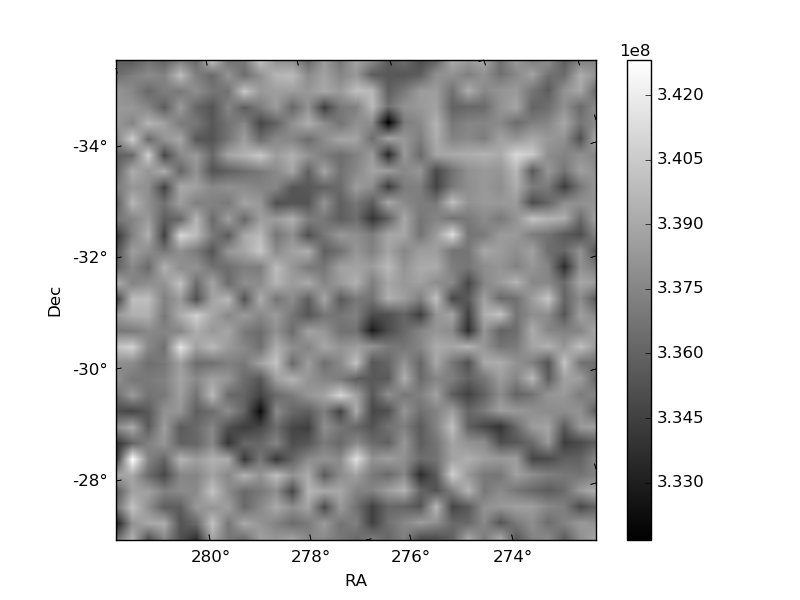
Histogram calculated using DETX and DETY for each event in the final _common_clean file
| Quadrant A | 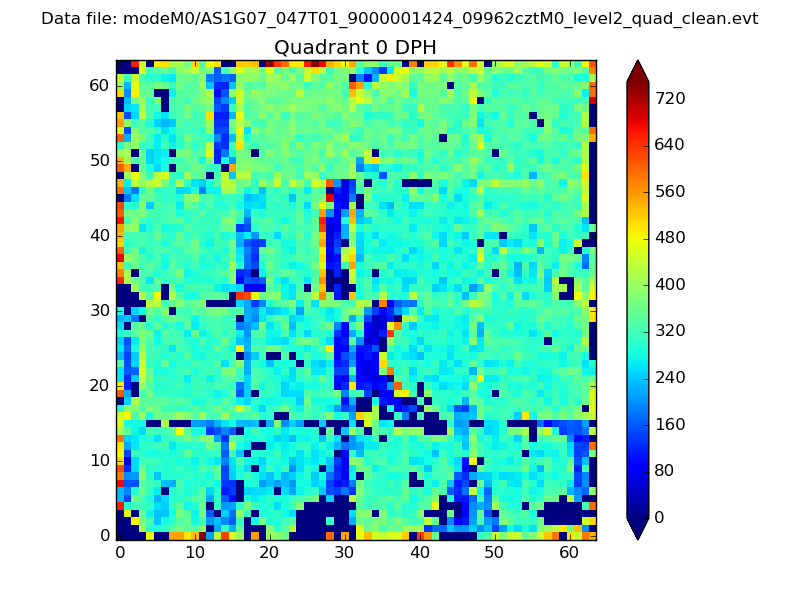 |
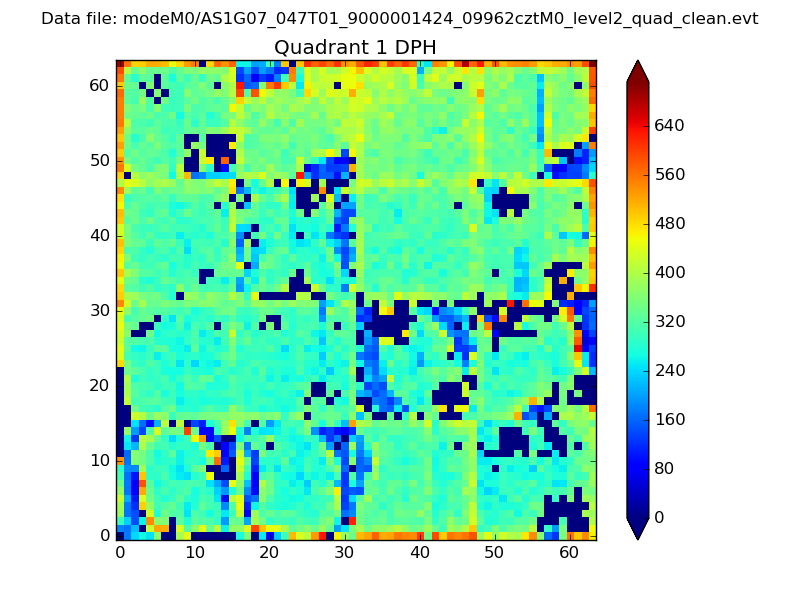 |
Quadrant B |
|---|---|---|---|
| Quadrant D |  |
 |
Quadrant C |
| Plot type | Count rate plots | Images |
|---|---|---|
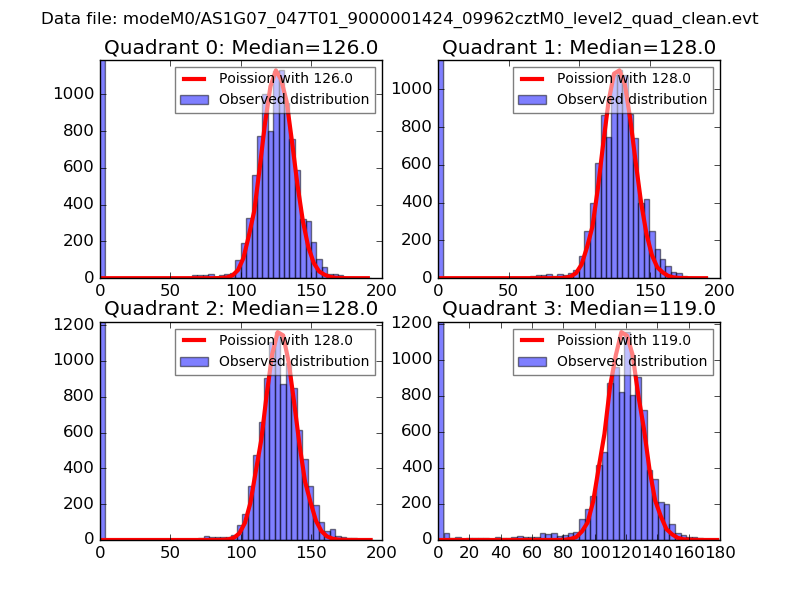
| Comparison with Poisson distribution Blue bars denote a histogram of data divided into 1 sec bins. Red curve is a Poisson curve with rate = median count rate of data. |
 |
 |
| Quadrant-wise count rates Data is divided into 100 sec bins |
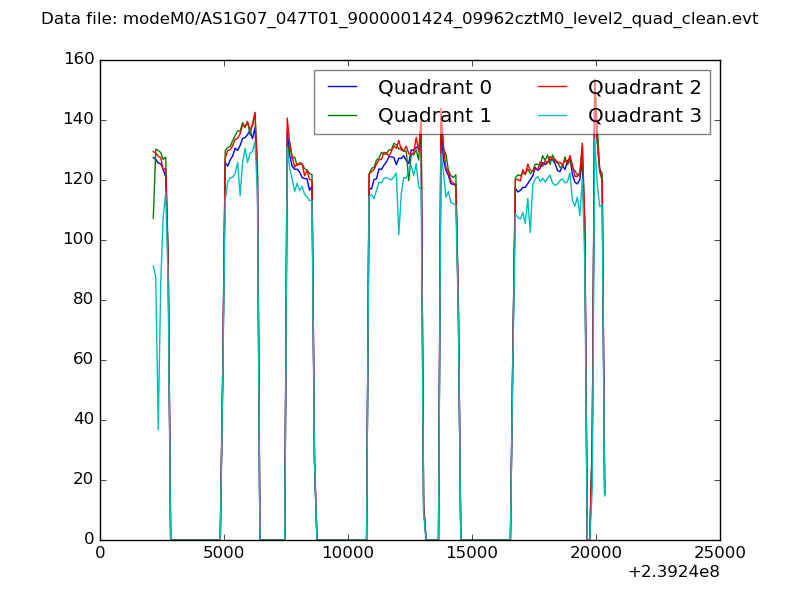 |
|
| Module-wise count rates for Quadrant A Data is divided into 100 sec bins |
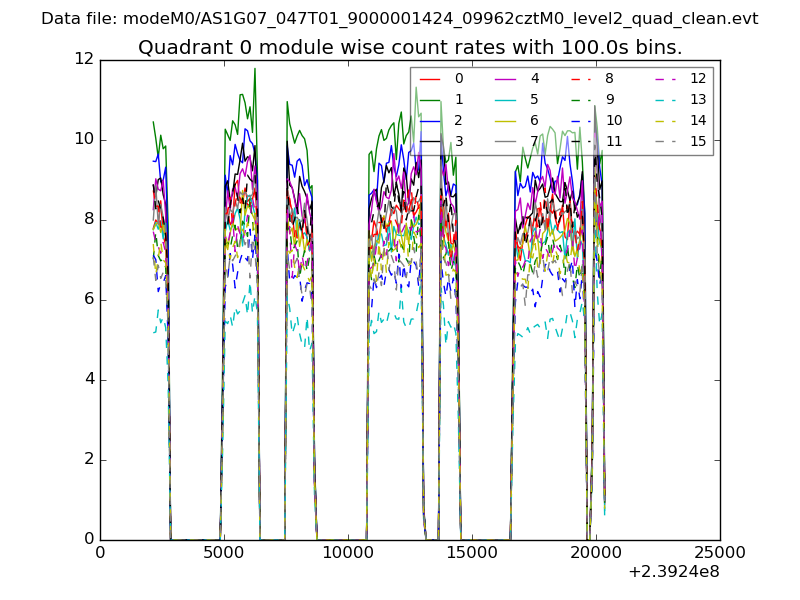 |
 |
| Module-wise count rates for Quadrant B Data is divided into 100 sec bins |
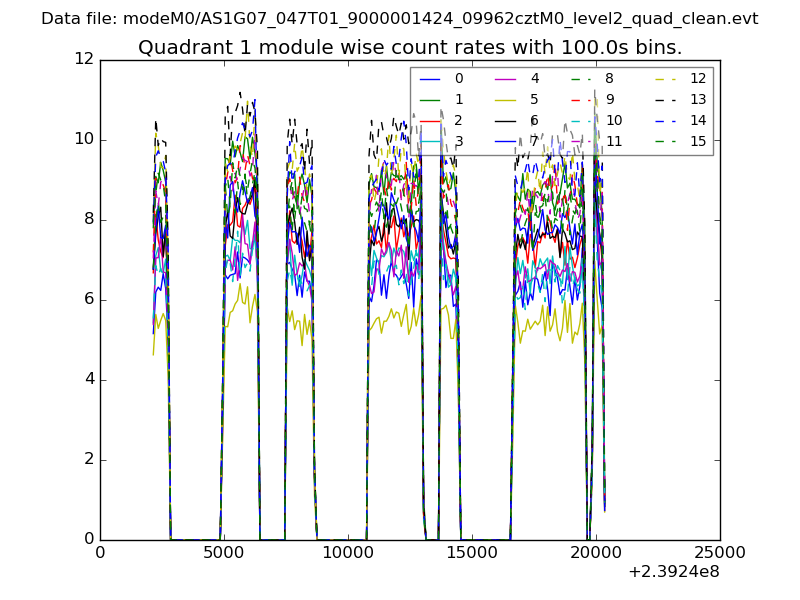 |
 |
| Module-wise count rates for Quadrant C Data is divided into 100 sec bins |
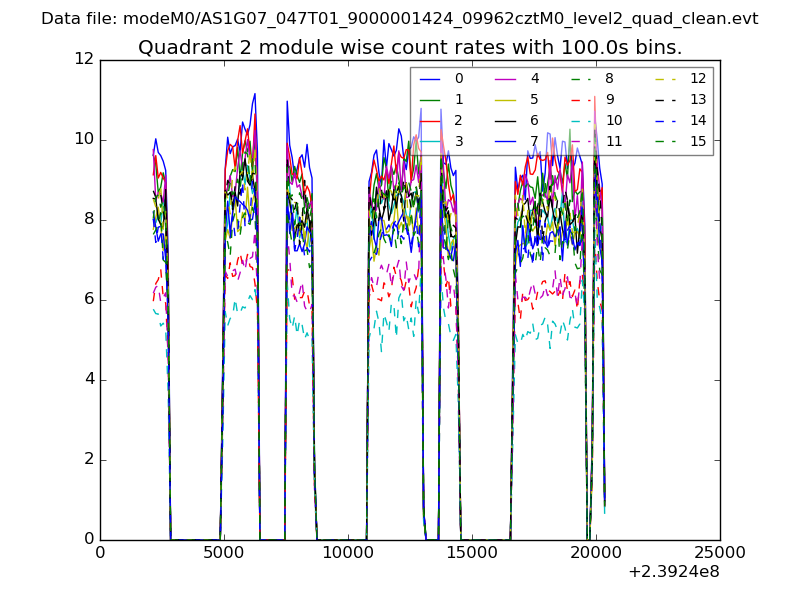 |
 |
| Module-wise count rates for Quadrant D Data is divided into 100 sec bins |
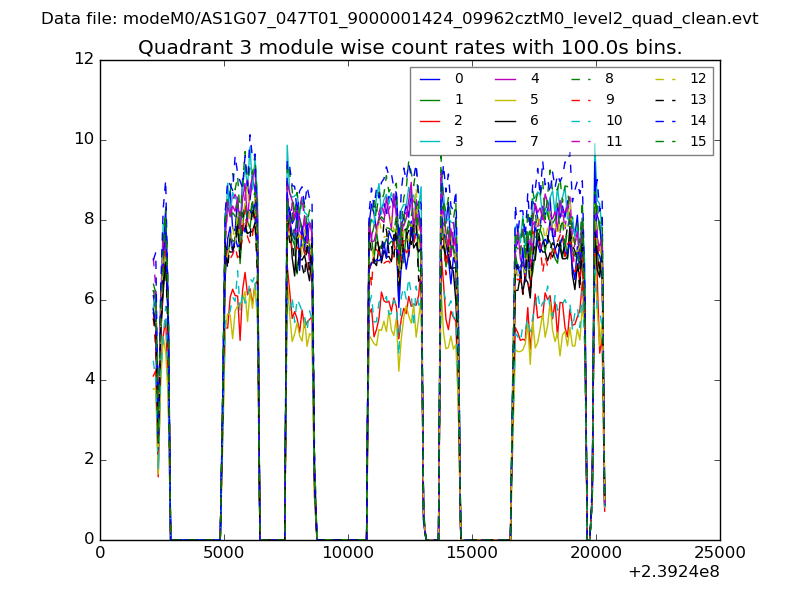 |
 |
| Parameter | Plot |
|---|---|
| CZT HV Monitor | 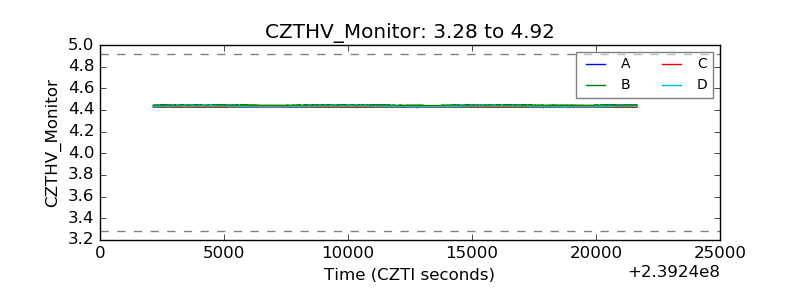 |
| D_VDD | 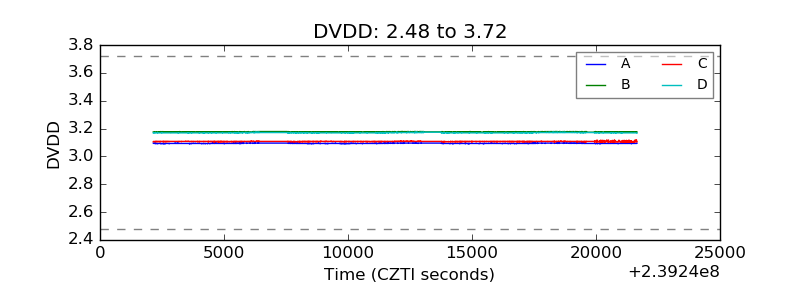 |
| Temperature 1 | 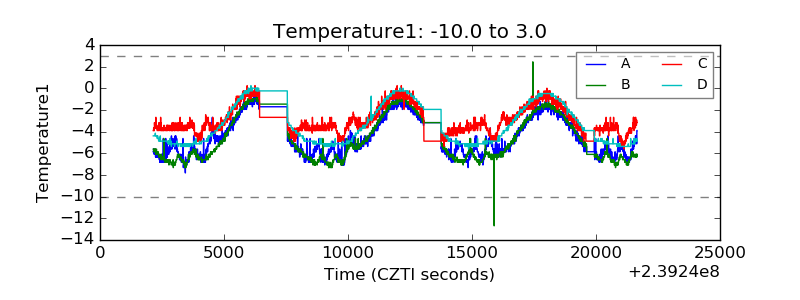 |
| Veto HV Monitor |  |
| Veto LLD | 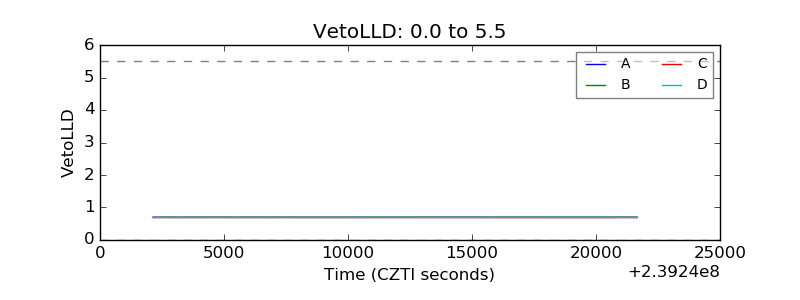 |
| Alpha Counter | 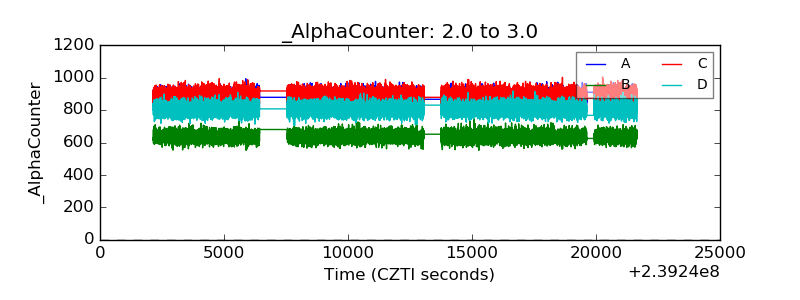 |
| _CPM_Rate | 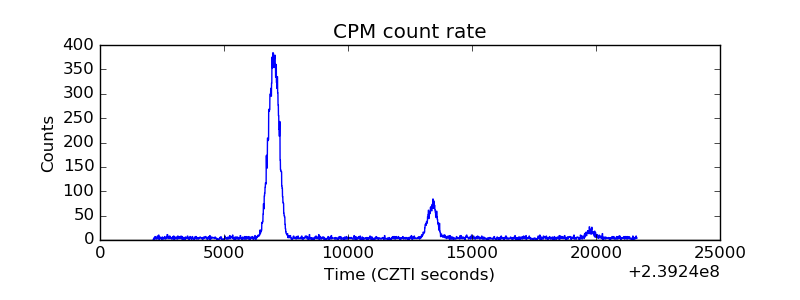 |
| CZT Counter |  |
| +2.5 Volts monitor |  |
| +5 Volts monitor | 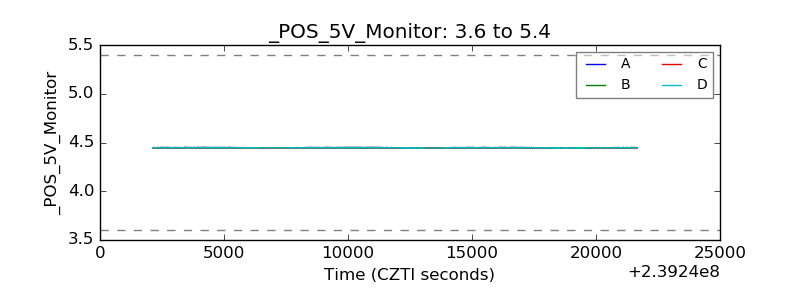 |
| _ROLL_ROT | 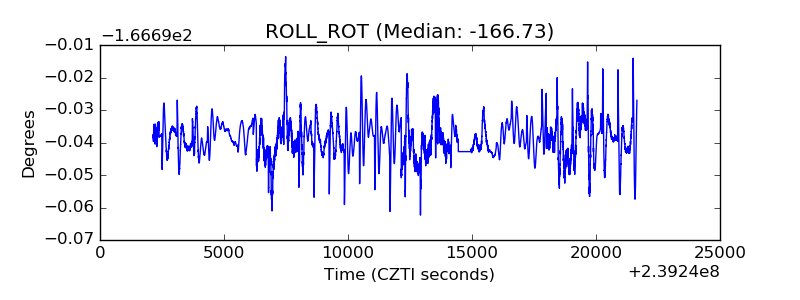 |
| _Roll_DEC | 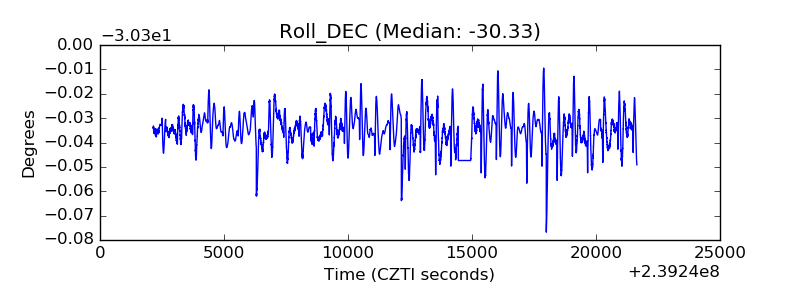 |
| _Roll_RA | 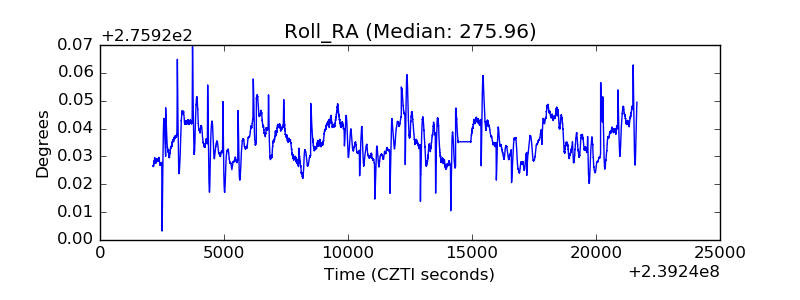 |
| Veto Counter | 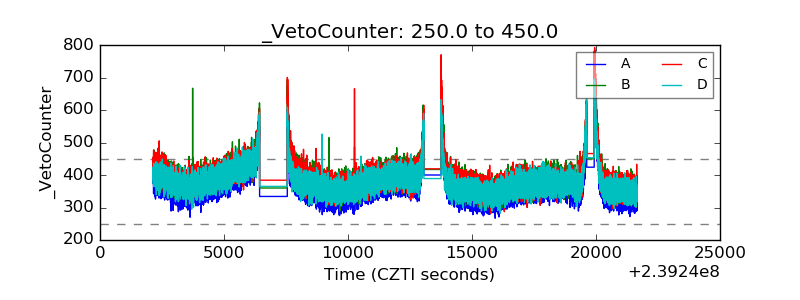 |