| Param | Original file | Final file |
|---|---|---|
| Filename | modeM0/AS1G07_047T01_9000001424_09963cztM0_level2.evt | modeM0/AS1G07_047T01_9000001424_09963cztM0_level2_quad_clean.evt |
| Size (bytes) | 609,655,680 | 88,381,440 |
| Size | 581.4 MB | 84.3 MB |
| Events in quadrant A | 3,766,994 | 536,369 |
| Events in quadrant B | 4,072,304 | 546,320 |
| Events in quadrant C | 3,674,717 | 544,928 |
| Events in quadrant D | 6,405,317 | 491,186 |
| Mode M0 | |||
|---|---|---|---|
| Quadrant | BADHDUFLAG | Total packets | Discarded packets |
| A | 0 | 17147 | 228 |
| B | 0 | 17802 | 270 |
| C | 0 | 17006 | 234 |
| D | 0 | 25096 | 588 |
| Mode SS | |||
|---|---|---|---|
| Quadrant | BADHDUFLAG | Total packets | Discarded packets |
| A | 0 | 170 | 4 |
| B | 0 | 170 | 2 |
| C | 0 | 170 | 2 |
| D | 0 | 170 | 4 |
| Mode M9 | |||
|---|---|---|---|
| Quadrant | BADHDUFLAG | Total packets | Discarded packets |
| A | 0 | 4 | 0 |
| B | 0 | 4 | 0 |
| C | 0 | 4 | 0 |
| D | 0 | 4 | 0 |
| Quadrant | Total seconds | Saturated seconds | Saturation percentage |
|---|---|---|---|
| A | 8025 | 162 | 2.018692% |
| B | 8010 | 235 | 2.933833% |
| C | 8019 | 146 | 1.820676% |
| D | 7968 | 923 | 11.583835% |
Noise dominated data is calculated using 1-second bins in cleaned event files. If a bin has >2000 counts, and if more than 50% of those come from <1% of pixels, then it is considered to be noise-dominated and hence unusable.
| Quadrant | # 1 sec bins | Bins with >0 counts | Bins with >2000 counts | High rate bins dominated by noise | Noise dominated (total time) | Noise dominated (detector-on time) | Marked lightcurve |
|---|---|---|---|---|---|---|---|
| A | 8648 | 8120 | 0 | 0 | 0.00% | 0.00% | 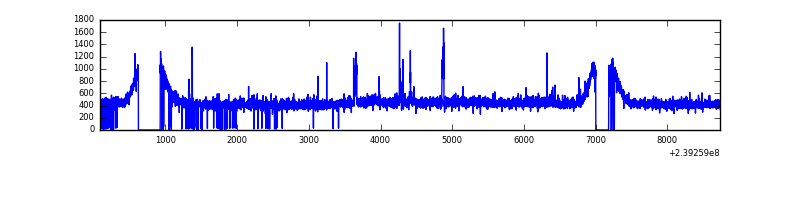 |
| B | 8648 | 8119 | 22 | 22 | 0.25% | 0.27% | 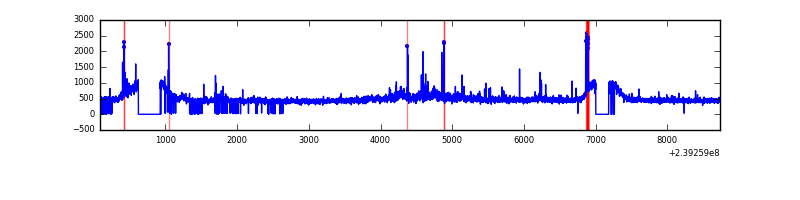 |
| C | 8648 | 8122 | 0 | 0 | 0.00% | 0.00% | 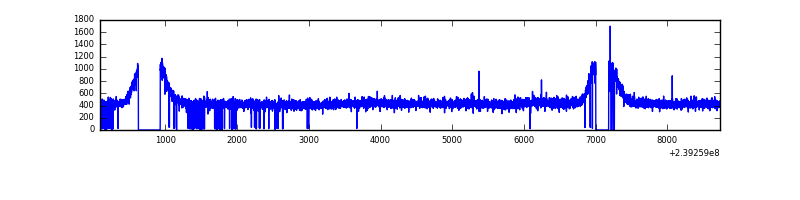 |
| D | 8646 | 8094 | 772 | 772 | 8.93% | 9.54% | 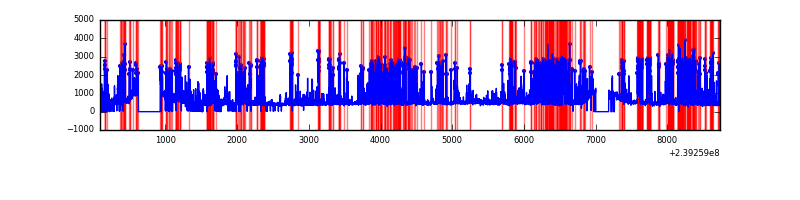 |
Top three noisy pixels from each quadrant. If the there are fewer than three noisy pixels in the level2.evt file, extra rows are filled as -1
| Pixel properties | Quadrant properties | ||||||
|---|---|---|---|---|---|---|---|
| Quadrant | DetID | PixID | Counts | Sigma | Mean | Median | Sigma |
| A | 15 | 174 | 61757 | 309.06 | 956 | 932 | 196.8 |
| A | 8 | 15 | 12695 | 59.77 | 956 | 932 | 196.8 |
| A | 0 | 226 | 8757 | 39.76 | 956 | 932 | 196.8 |
| B | 0 | 214 | 113635 | 600.06 | 964 | 940 | 187.8 |
| B | 0 | 219 | 72901 | 383.16 | 964 | 940 | 187.8 |
| B | 10 | 252 | 52826 | 276.27 | 964 | 940 | 187.8 |
| C | 8 | 128 | 10393 | 42.56 | 936 | 942 | 222.1 |
| C | 13 | 61 | 6944 | 27.03 | 936 | 942 | 222.1 |
| C | 8 | 112 | 5344 | 19.82 | 936 | 942 | 222.1 |
| D | 1 | 52 | 2669627 | 11739.85 | 876 | 852 | 227.3 |
| D | 8 | 195 | 132502 | 579.12 | 876 | 852 | 227.3 |
| D | 2 | 33 | 84754 | 369.08 | 876 | 852 | 227.3 |
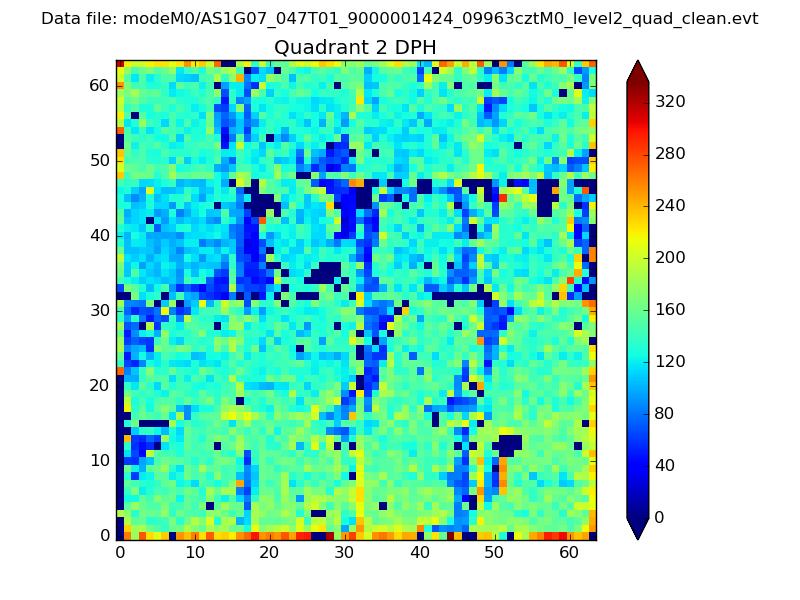
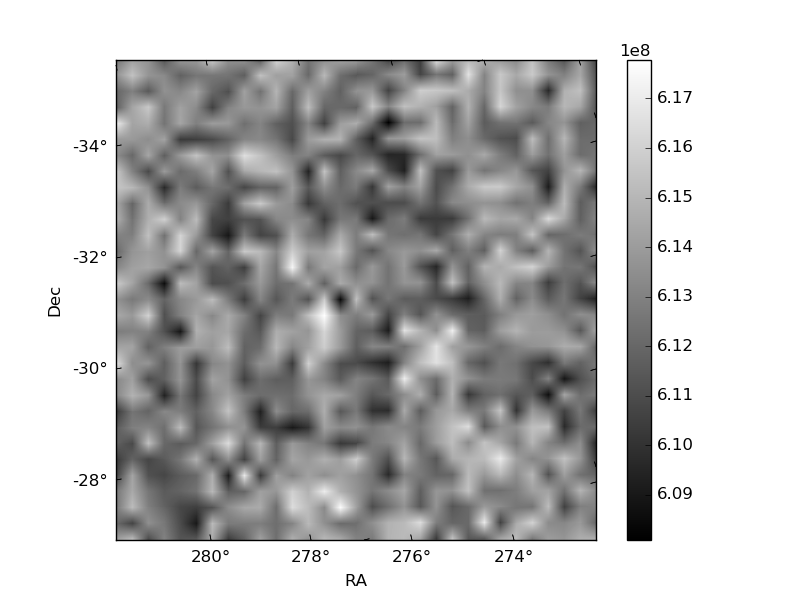
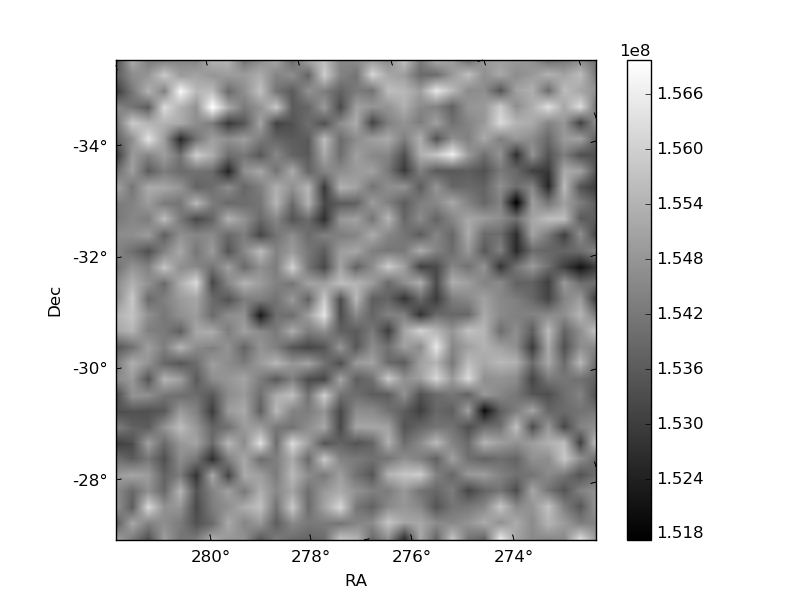
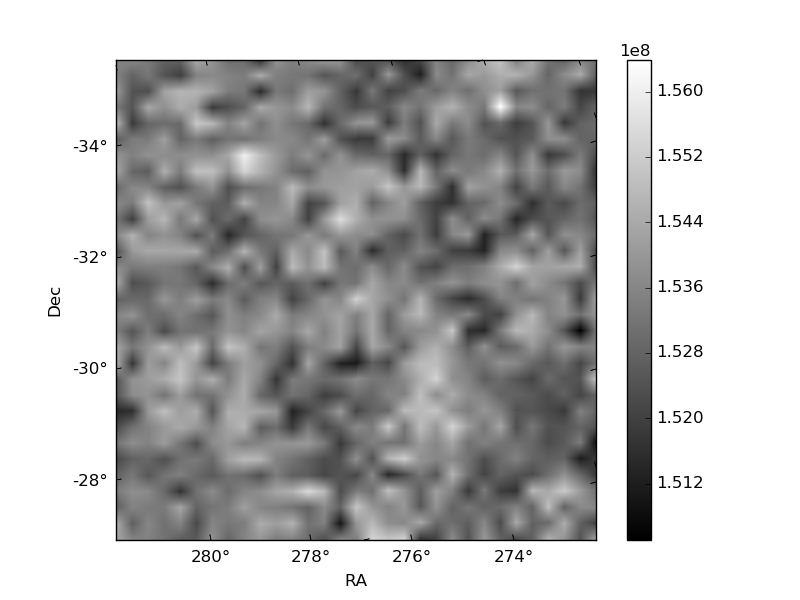
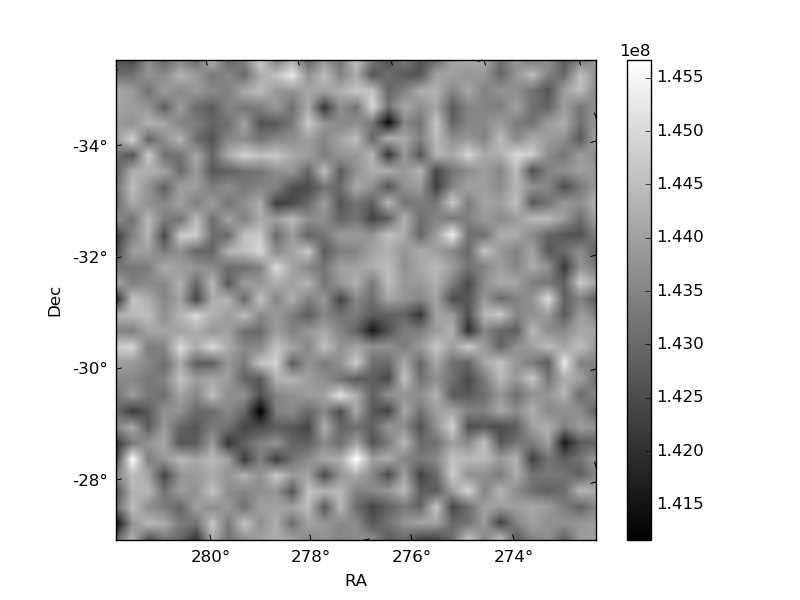
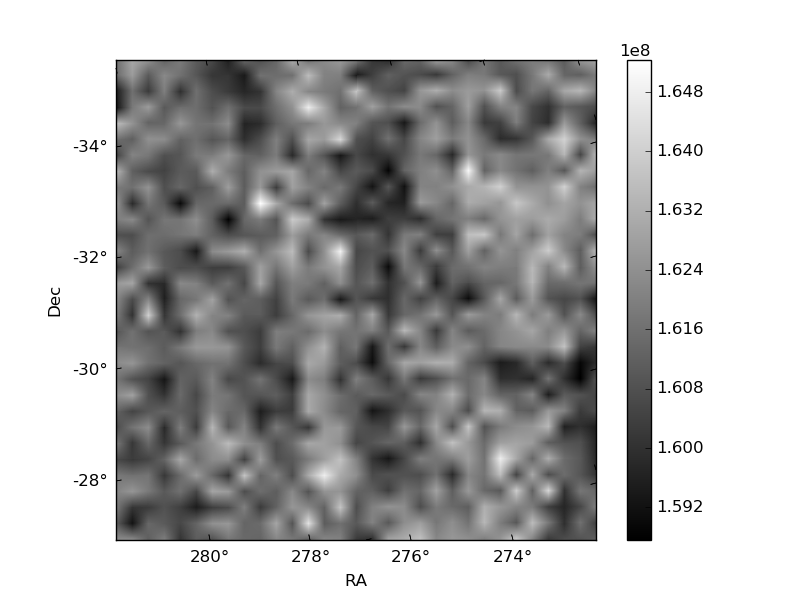
Histogram calculated using DETX and DETY for each event in the final _common_clean file
| Quadrant A | 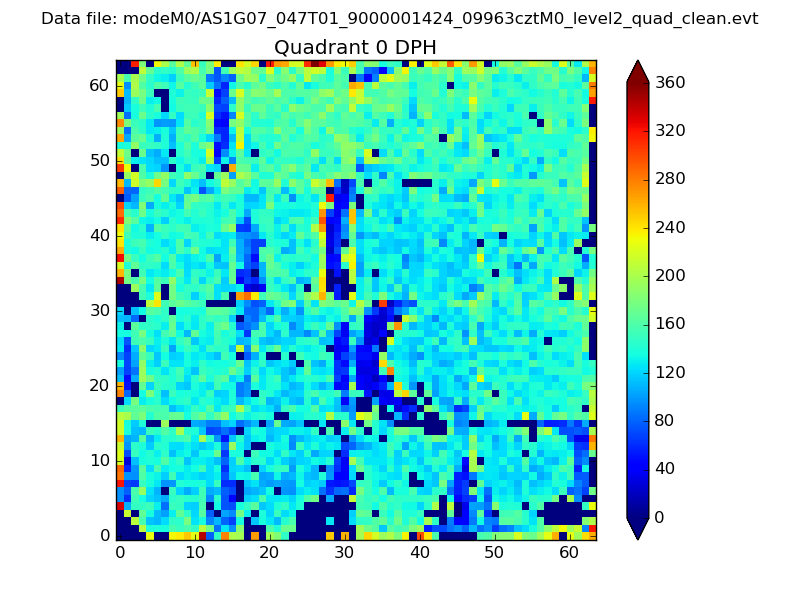 |
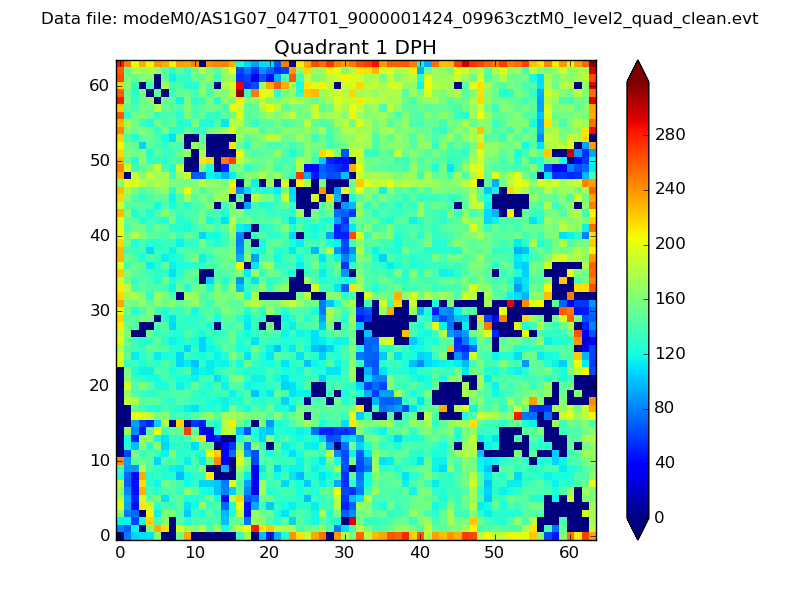 |
Quadrant B |
|---|---|---|---|
| Quadrant D | 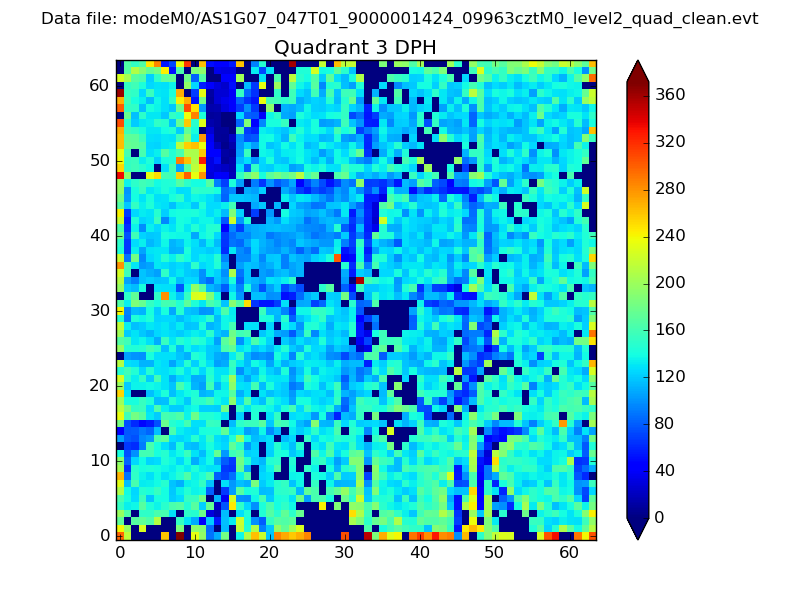 |
 |
Quadrant C |
| Plot type | Count rate plots | Images |
|---|---|---|
| Comparison with Poisson distribution Blue bars denote a histogram of data divided into 1 sec bins. Red curve is a Poisson curve with rate = median count rate of data. |
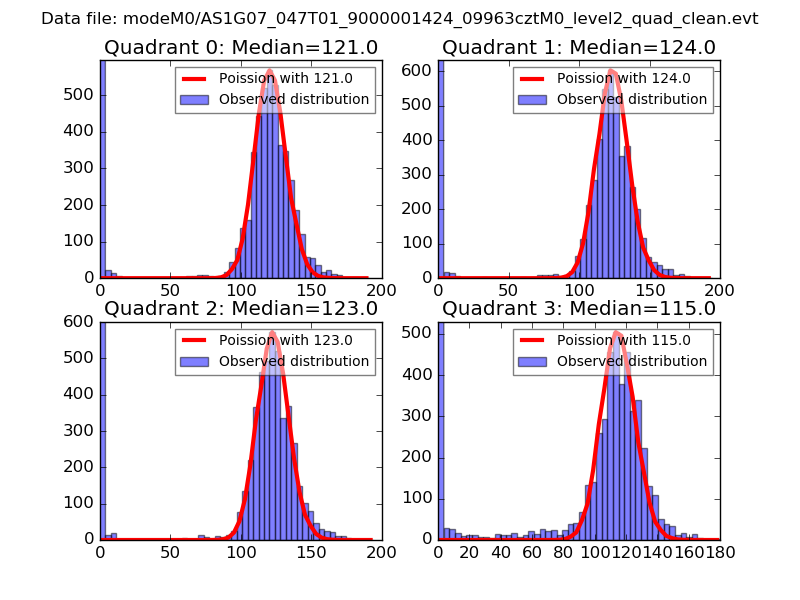 |
 |
| Quadrant-wise count rates Data is divided into 100 sec bins |
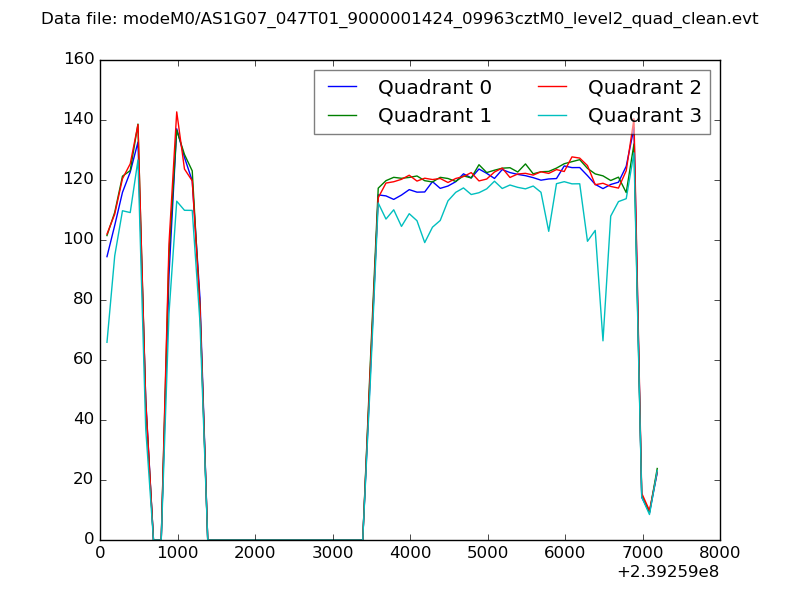 |
|
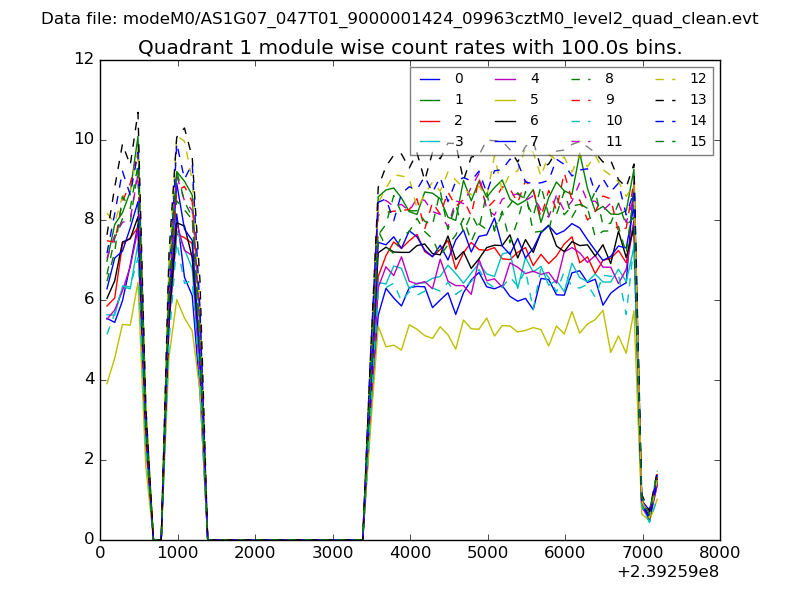
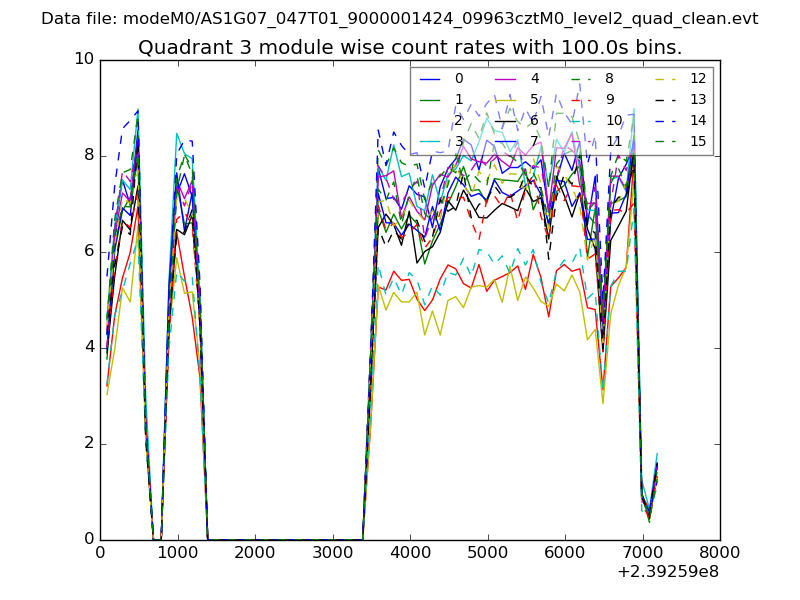
| Module-wise count rates for Quadrant A Data is divided into 100 sec bins |
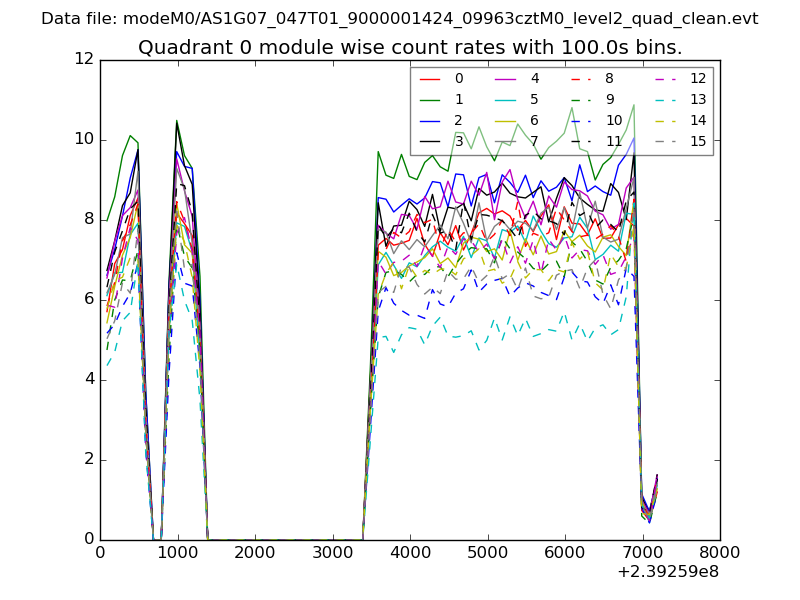 |
 |
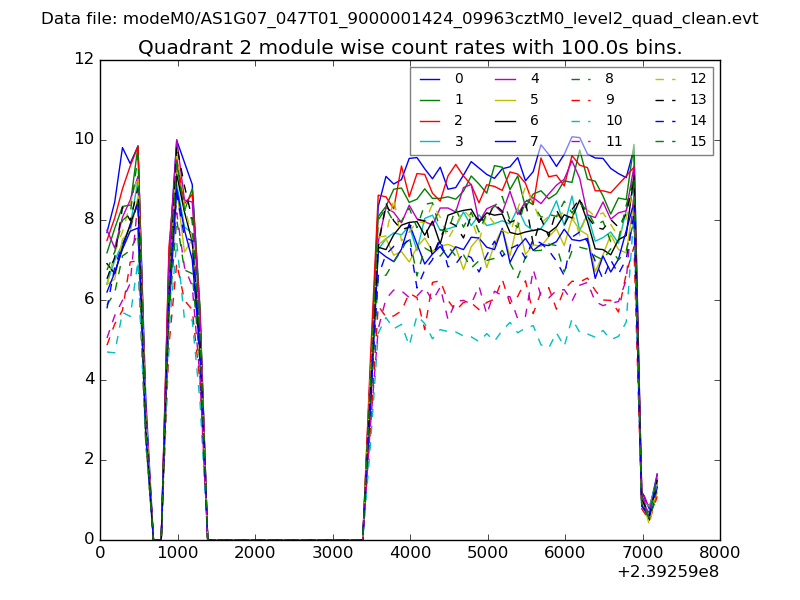
| Module-wise count rates for Quadrant B Data is divided into 100 sec bins |
 |
 |
| Module-wise count rates for Quadrant C Data is divided into 100 sec bins |
 |
 |
| Module-wise count rates for Quadrant D Data is divided into 100 sec bins |
 |
 |
| Parameter | Plot |
|---|---|
| CZT HV Monitor | 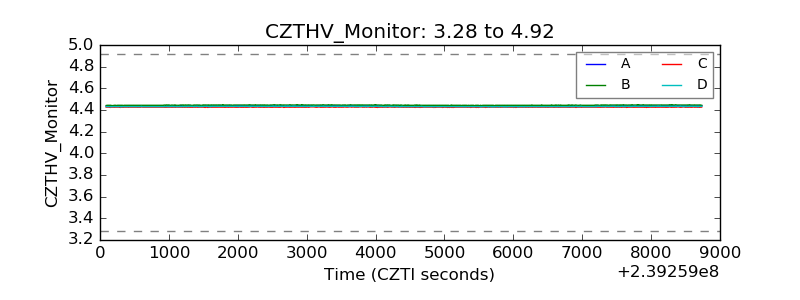 |
| D_VDD | 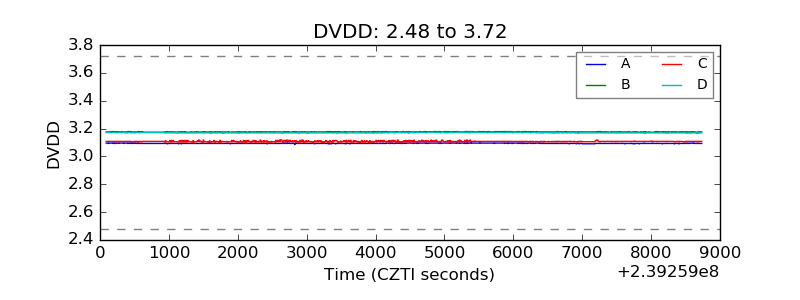 |
| Temperature 1 | 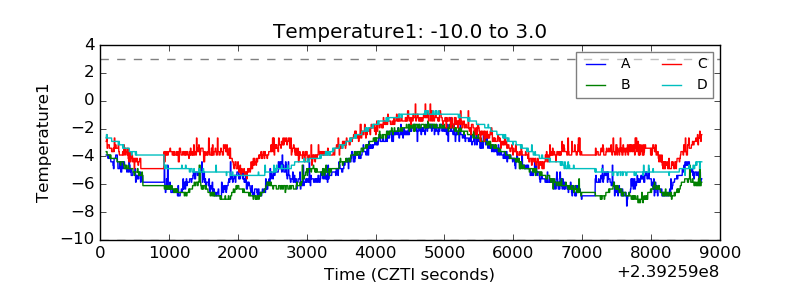 |
| Veto HV Monitor | 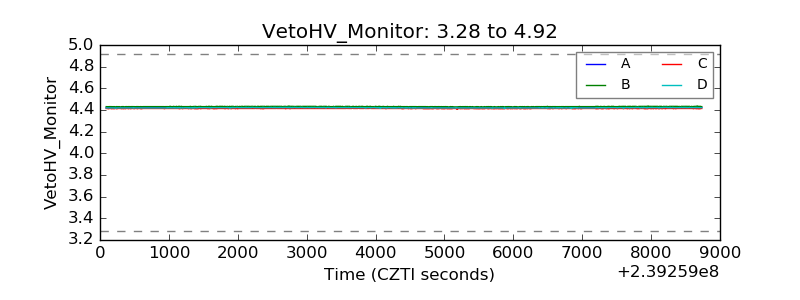 |
| Veto LLD | 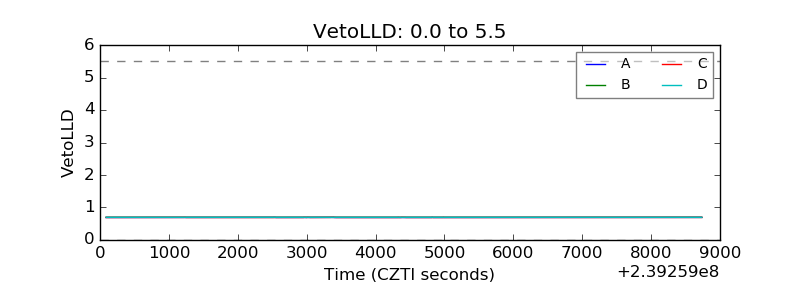 |
| Alpha Counter | 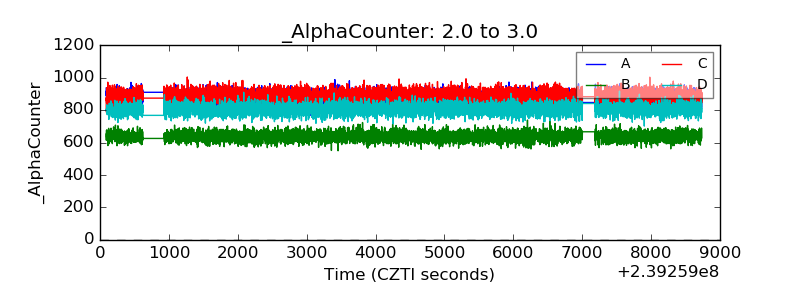 |
| _CPM_Rate |  |
| CZT Counter | 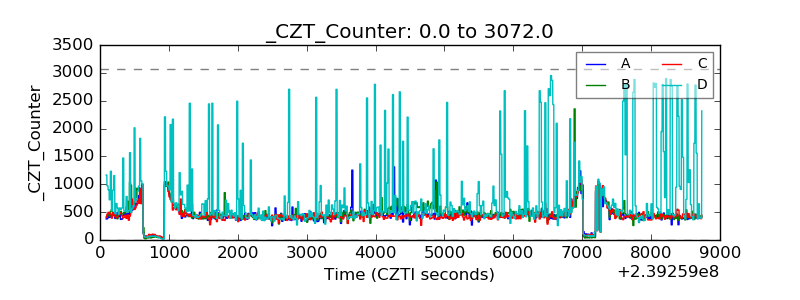 |
| +2.5 Volts monitor |  |
| +5 Volts monitor |  |
| _ROLL_ROT | 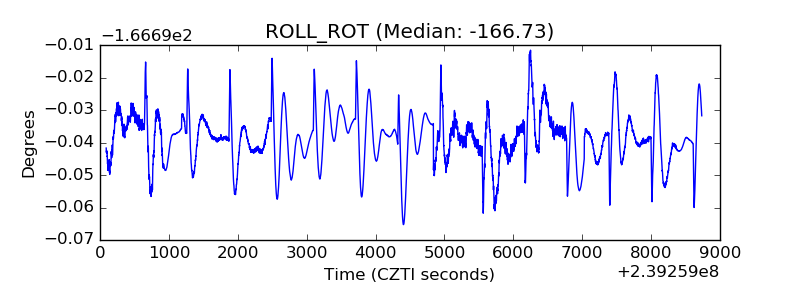 |
| _Roll_DEC | 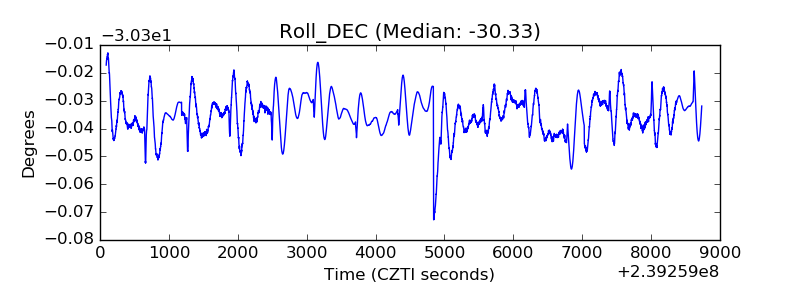 |
| _Roll_RA | 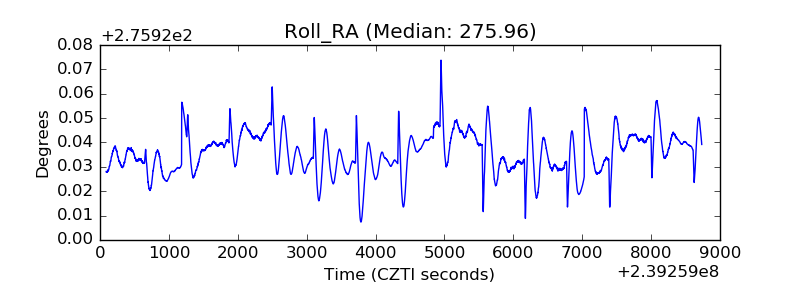 |
| Veto Counter | 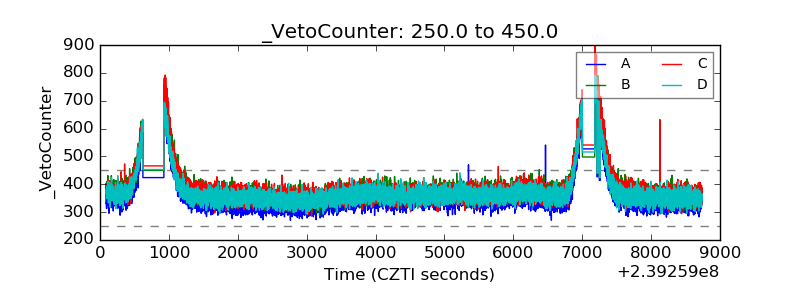 |