| Param | Original file | Final file |
|---|---|---|
| Filename | modeM0/AS1G07_047T01_9000001424_09966cztM0_level2.evt | modeM0/AS1G07_047T01_9000001424_09966cztM0_level2_quad_clean.evt |
| Size (bytes) | 1,459,540,800 | 230,751,360 |
| Size | 1.4 GB | 220.1 MB |
| Events in quadrant A | 8,762,458 | 1,434,083 |
| Events in quadrant B | 9,539,261 | 1,455,345 |
| Events in quadrant C | 8,546,588 | 1,454,200 |
| Events in quadrant D | 16,061,293 | 1,327,243 |
| Mode M0 | |||
|---|---|---|---|
| Quadrant | BADHDUFLAG | Total packets | Discarded packets |
| A | 0 | 40117 | 590 |
| B | 0 | 41327 | 642 |
| C | 0 | 39778 | 526 |
| D | 0 | 62489 | 1749 |
| Mode SS | |||
|---|---|---|---|
| Quadrant | BADHDUFLAG | Total packets | Discarded packets |
| A | 0 | 398 | 4 |
| B | 0 | 398 | 0 |
| C | 0 | 398 | 2 |
| D | 0 | 398 | 8 |
| Mode M9 | |||
|---|---|---|---|
| Quadrant | BADHDUFLAG | Total packets | Discarded packets |
| A | 0 | 18 | 1 |
| B | 0 | 18 | 0 |
| C | 0 | 18 | 0 |
| D | 0 | 18 | 0 |
| Quadrant | Total seconds | Saturated seconds | Saturation percentage |
|---|---|---|---|
| A | 19137 | 372 | 1.943878% |
| B | 19135 | 479 | 2.503266% |
| C | 19151 | 284 | 1.482951% |
| D | 19007 | 2056 | 10.817067% |
Noise dominated data is calculated using 1-second bins in cleaned event files. If a bin has >2000 counts, and if more than 50% of those come from <1% of pixels, then it is considered to be noise-dominated and hence unusable.
| Quadrant | # 1 sec bins | Bins with >0 counts | Bins with >2000 counts | High rate bins dominated by noise | Noise dominated (total time) | Noise dominated (detector-on time) | Marked lightcurve |
|---|---|---|---|---|---|---|---|
| A | 21263 | 19391 | 17 | 17 | 0.08% | 0.09% | 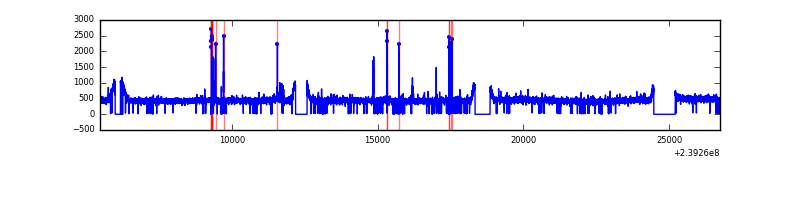 |
| B | 21263 | 19365 | 91 | 91 | 0.43% | 0.47% | 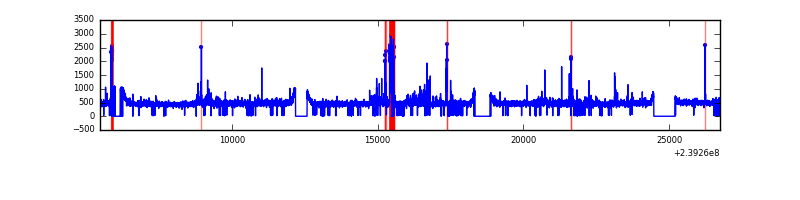 |
| C | 21263 | 19385 | 0 | 0 | 0.00% | 0.00% | 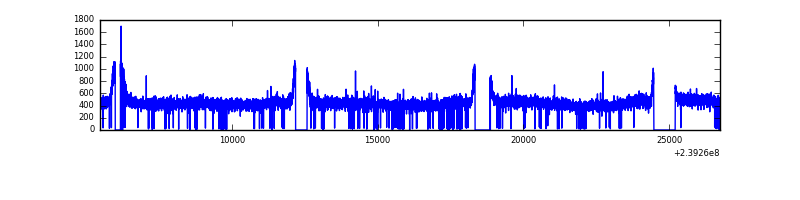 |
| D | 21263 | 19297 | 1646 | 1646 | 7.74% | 8.53% | 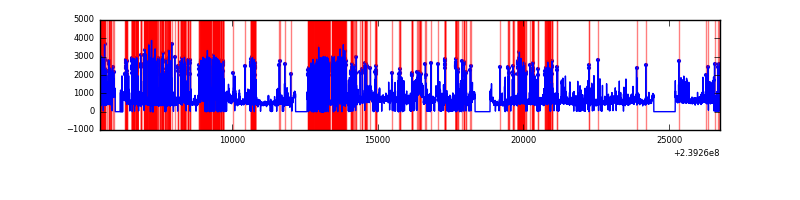 |
Top three noisy pixels from each quadrant. If the there are fewer than three noisy pixels in the level2.evt file, extra rows are filled as -1
| Pixel properties | Quadrant properties | ||||||
|---|---|---|---|---|---|---|---|
| Quadrant | DetID | PixID | Counts | Sigma | Mean | Median | Sigma |
| A | 15 | 174 | 136011 | 294.0 | 2240 | 2193 | 455.2 |
| A | 0 | 226 | 20571 | 40.38 | 2240 | 2193 | 455.2 |
| A | 12 | 194 | 18383 | 35.57 | 2240 | 2193 | 455.2 |
| B | 4 | 81 | 346595 | 795.24 | 2254 | 2197 | 433.1 |
| B | 0 | 214 | 94789 | 213.8 | 2254 | 2197 | 433.1 |
| B | 0 | 219 | 92693 | 208.96 | 2254 | 2197 | 433.1 |
| C | 13 | 61 | 16190 | 27.49 | 2189 | 2199 | 508.9 |
| C | 8 | 222 | 7849 | 11.1 | 2189 | 2199 | 508.9 |
| C | 14 | 67 | 6053 | 7.57 | 2189 | 2199 | 508.9 |
| D | 1 | 52 | 5836355 | 11293.41 | 2051 | 1997 | 516.6 |
| D | 2 | 16 | 951612 | 1838.14 | 2051 | 1997 | 516.6 |
| D | 8 | 195 | 343560 | 661.15 | 2051 | 1997 | 516.6 |
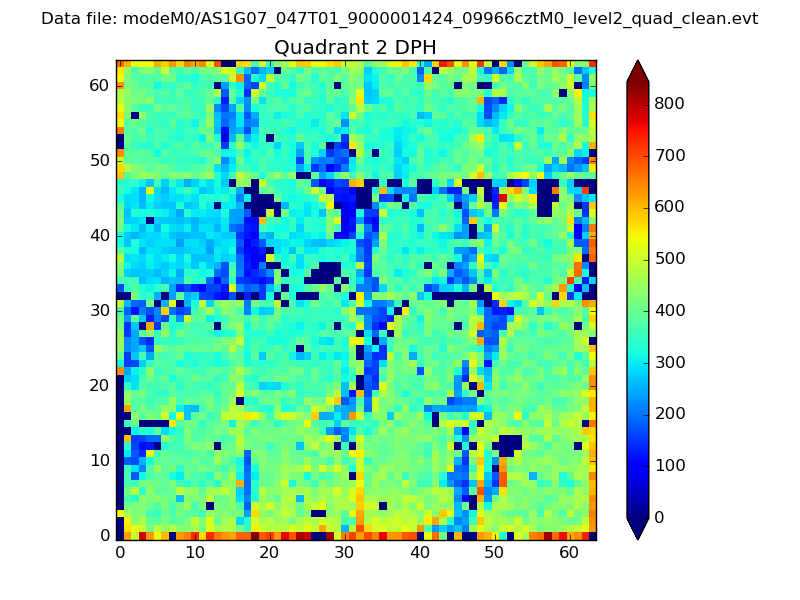
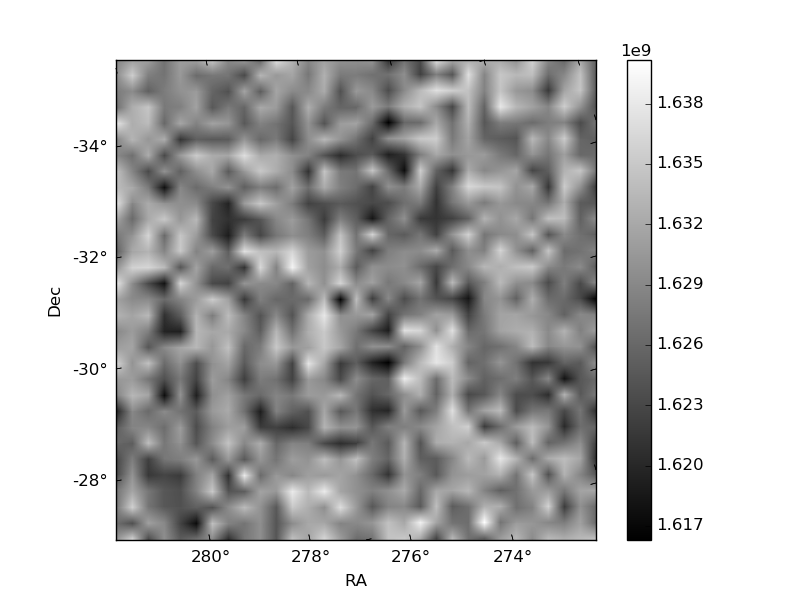
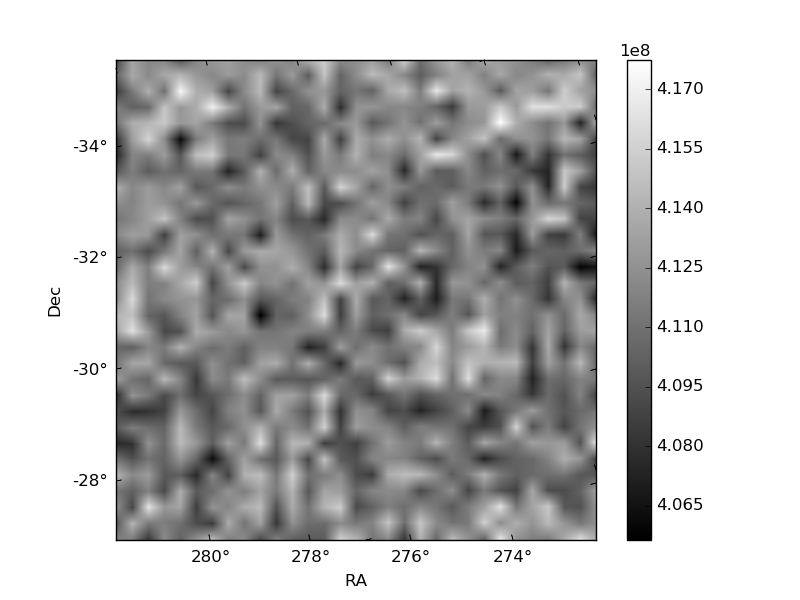
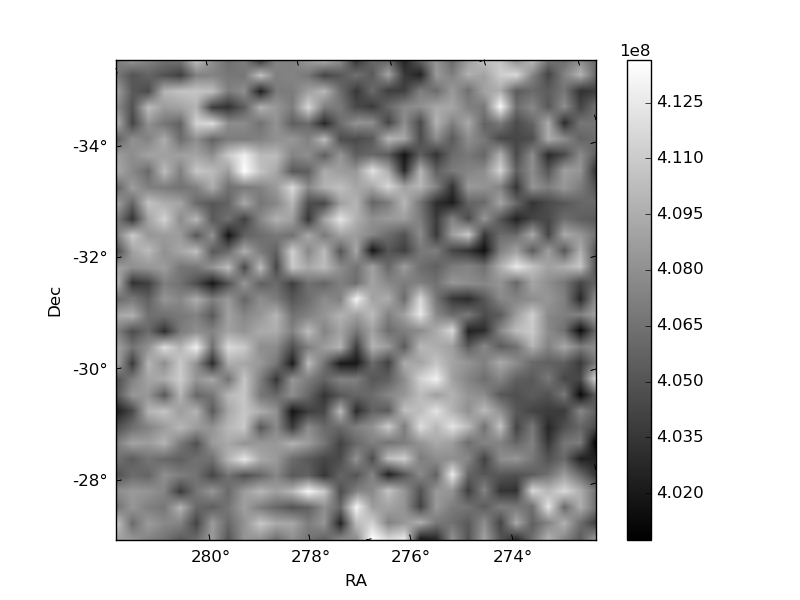
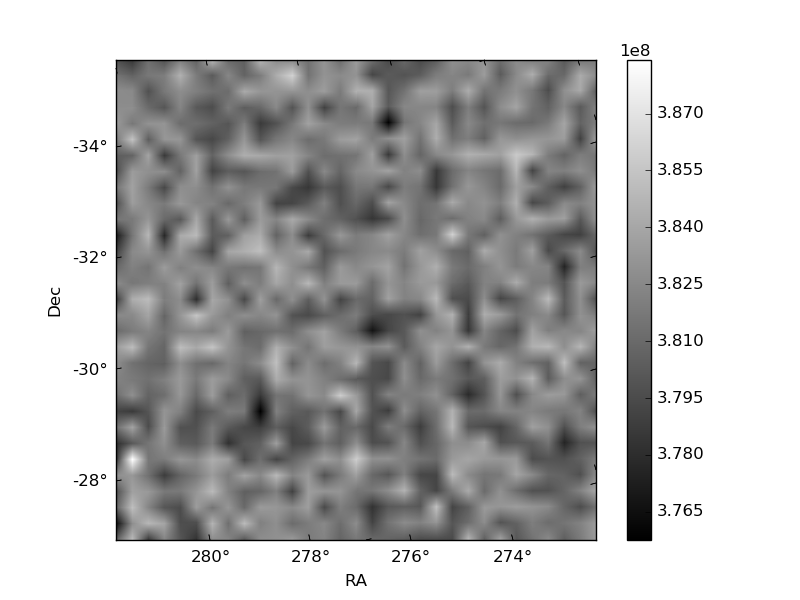
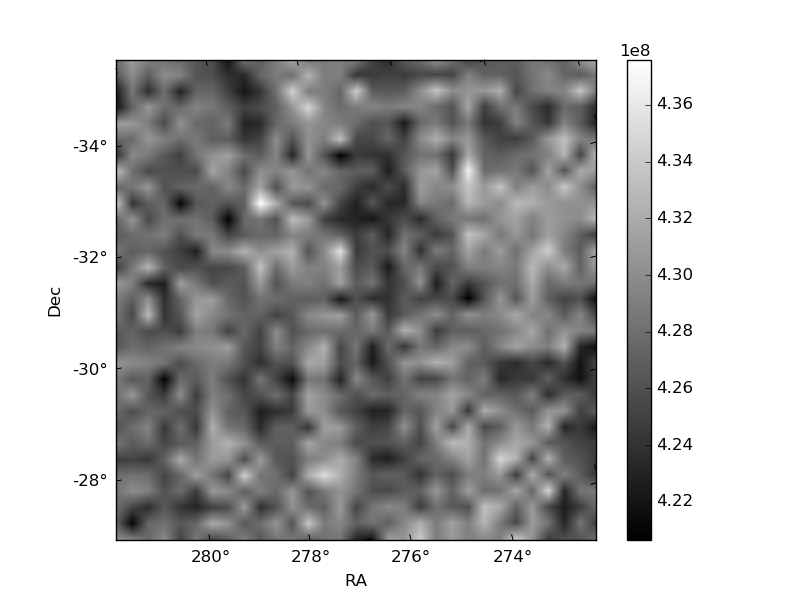
Histogram calculated using DETX and DETY for each event in the final _common_clean file
| Quadrant A | 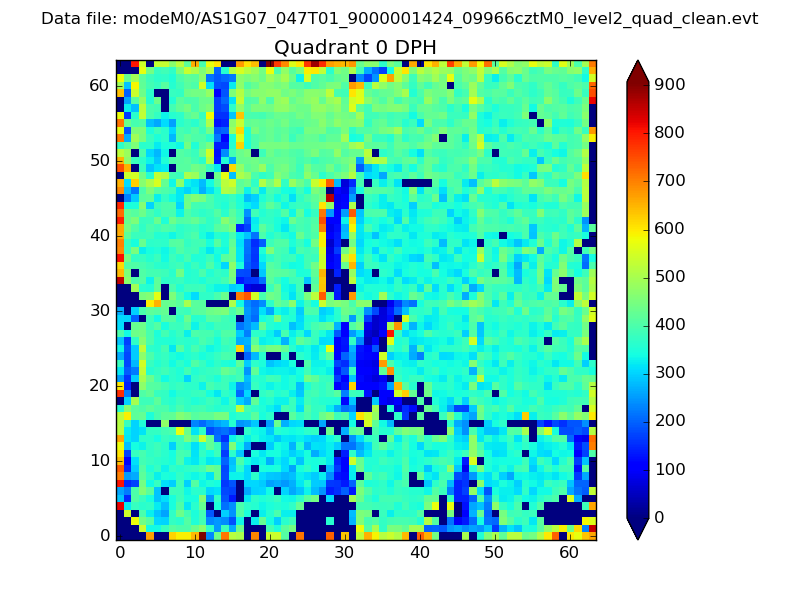 |
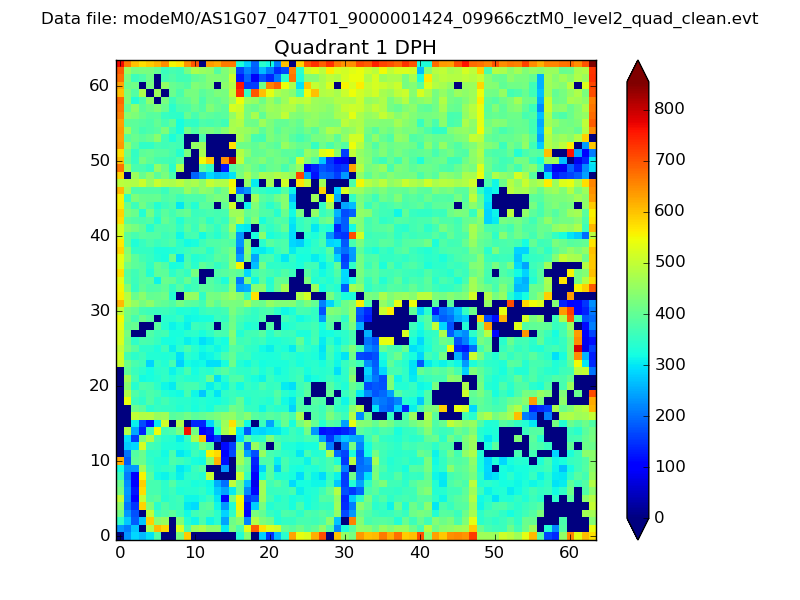 |
Quadrant B |
|---|---|---|---|
| Quadrant D | 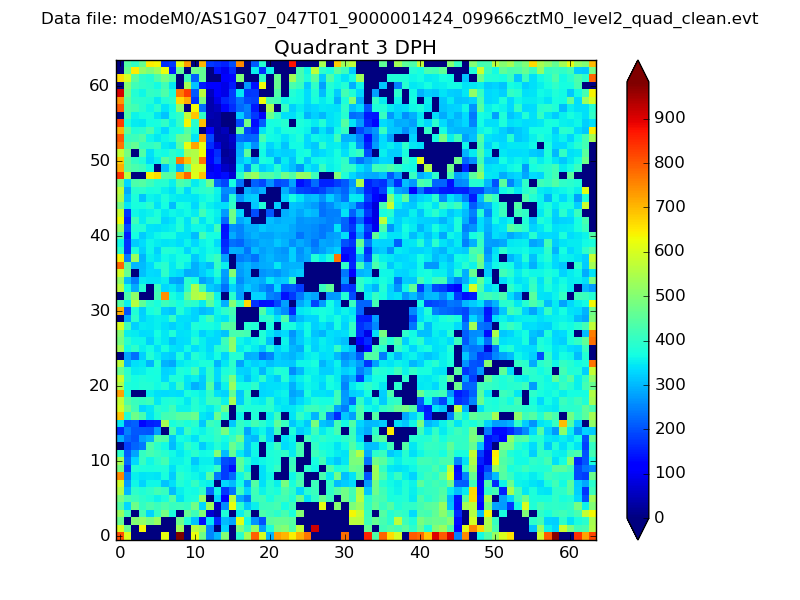 |
 |
Quadrant C |
| Plot type | Count rate plots | Images |
|---|---|---|
| Comparison with Poisson distribution Blue bars denote a histogram of data divided into 1 sec bins. Red curve is a Poisson curve with rate = median count rate of data. |
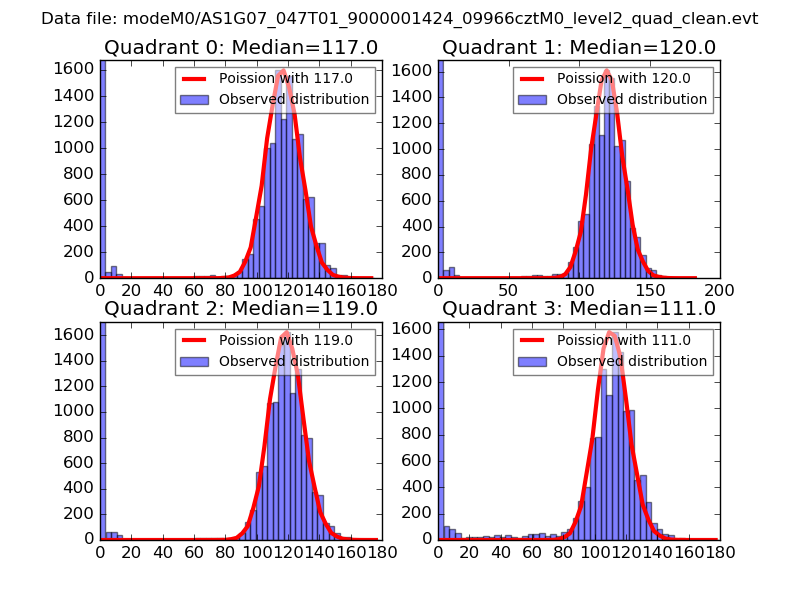 |
 |
| Quadrant-wise count rates Data is divided into 100 sec bins |
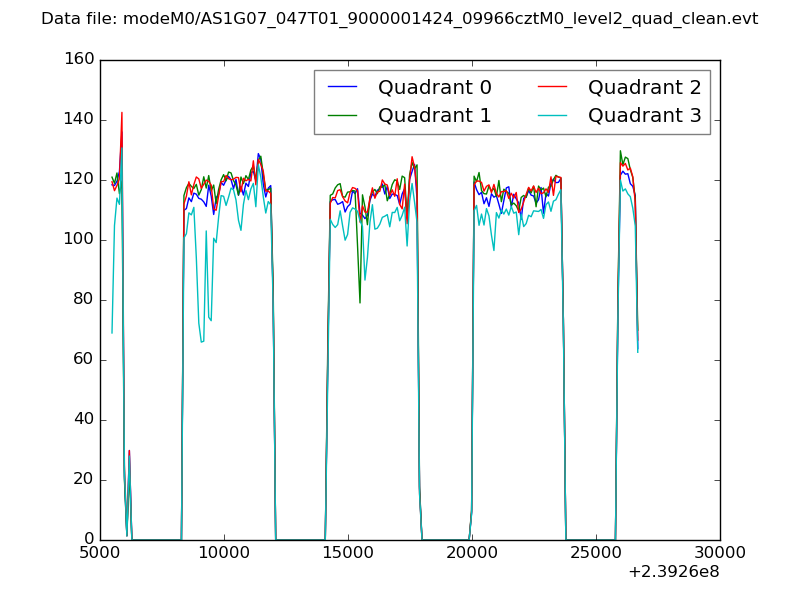 |
|
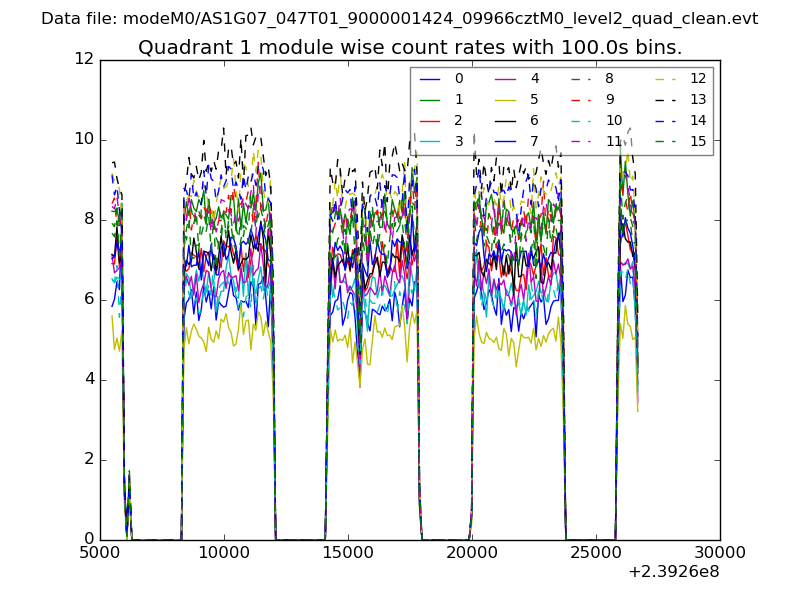
| Module-wise count rates for Quadrant A Data is divided into 100 sec bins |
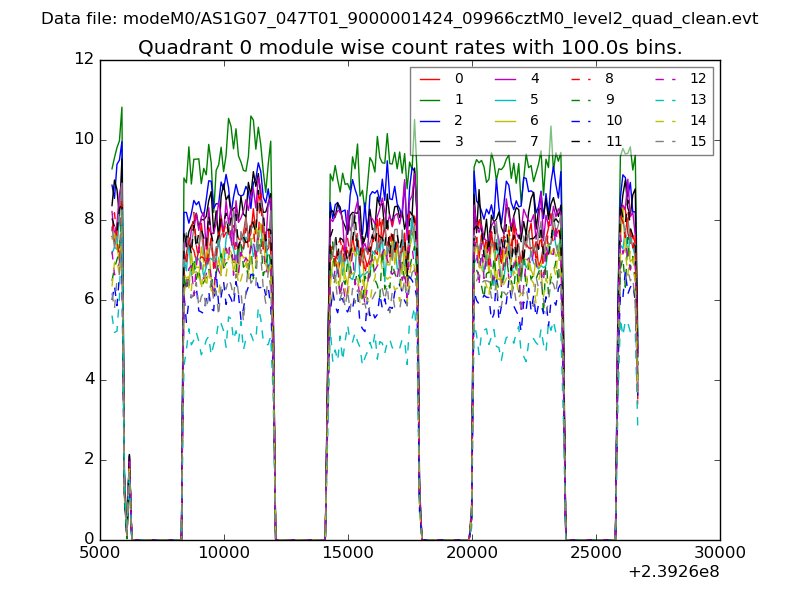 |
 |
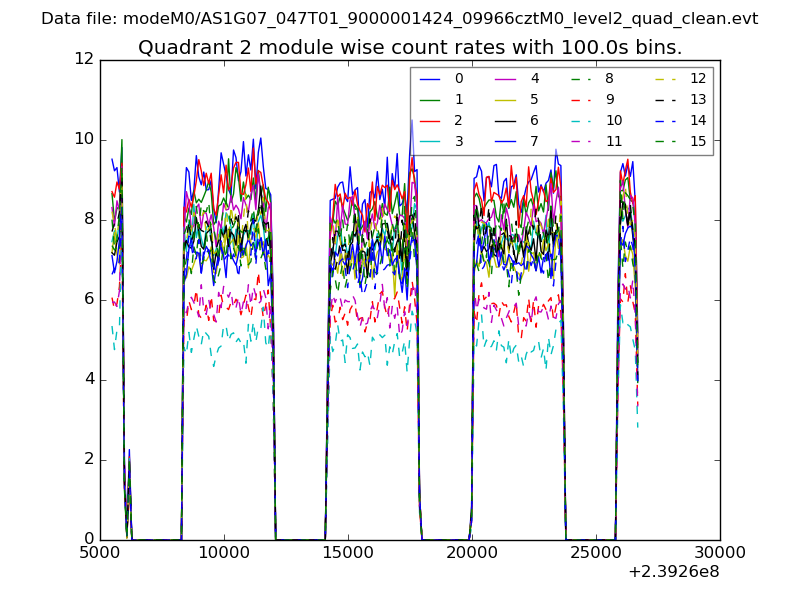
| Module-wise count rates for Quadrant B Data is divided into 100 sec bins |
 |
 |
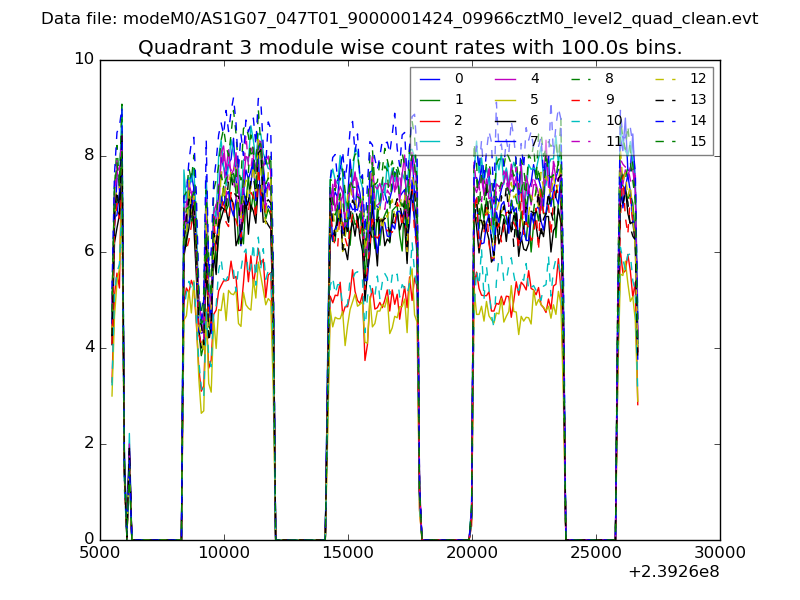
| Module-wise count rates for Quadrant C Data is divided into 100 sec bins |
 |
 |
| Module-wise count rates for Quadrant D Data is divided into 100 sec bins |
 |
 |
| Parameter | Plot |
|---|---|
| CZT HV Monitor | 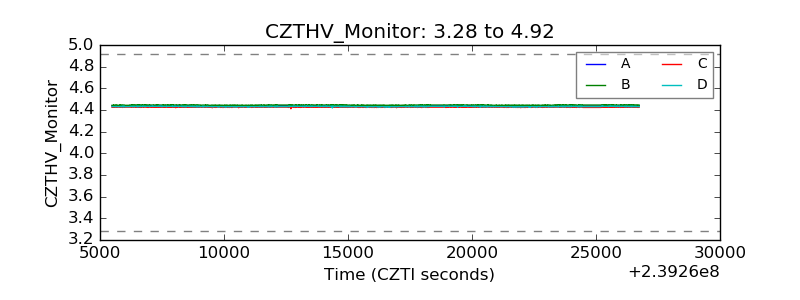 |
| D_VDD | 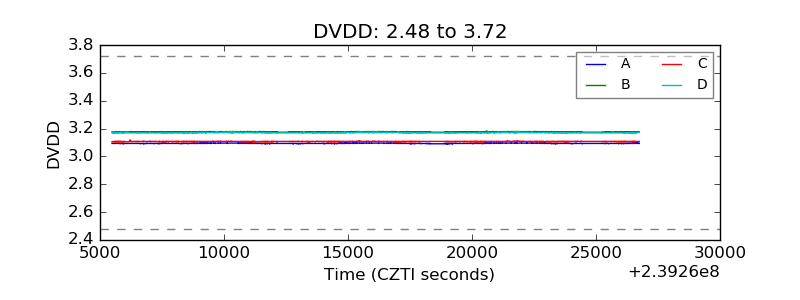 |
| Temperature 1 | 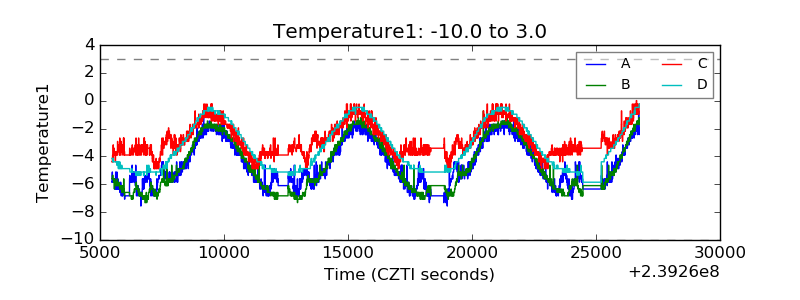 |
| Veto HV Monitor | 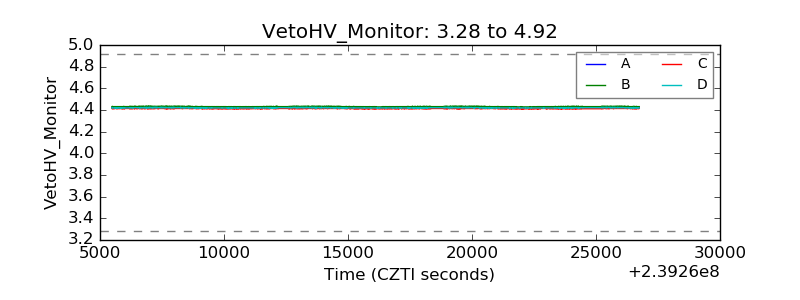 |
| Veto LLD | 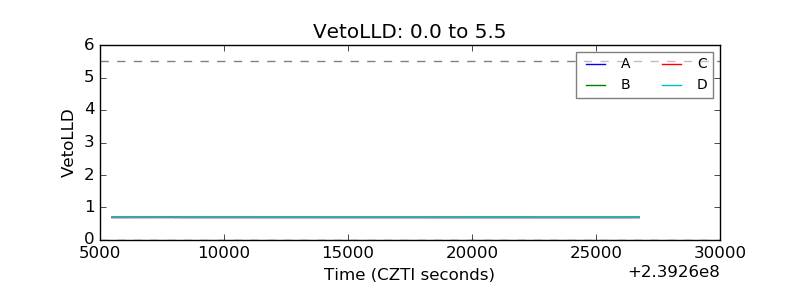 |
| Alpha Counter | 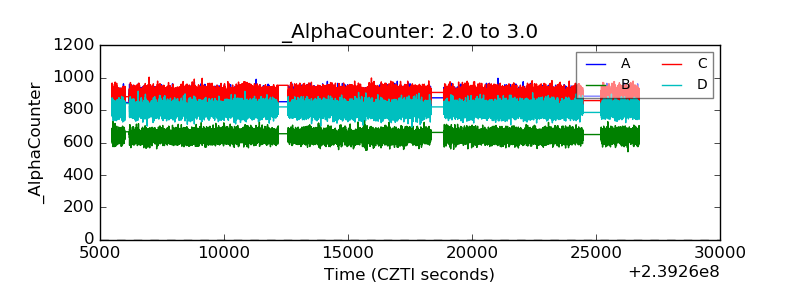 |
| _CPM_Rate | 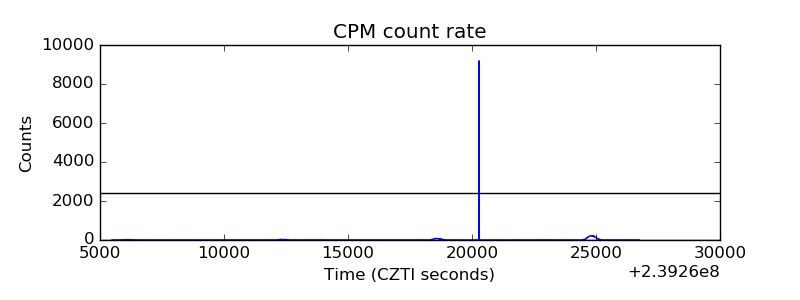 |
| CZT Counter | 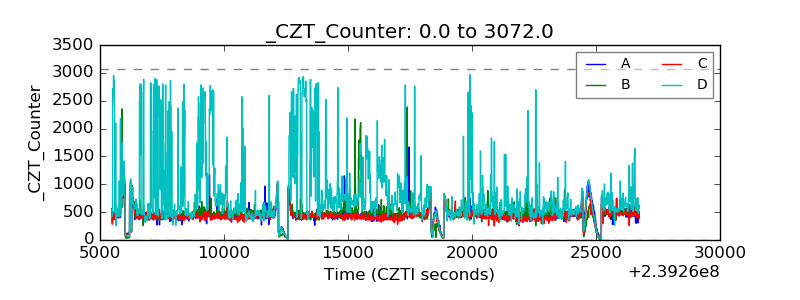 |
| +2.5 Volts monitor | 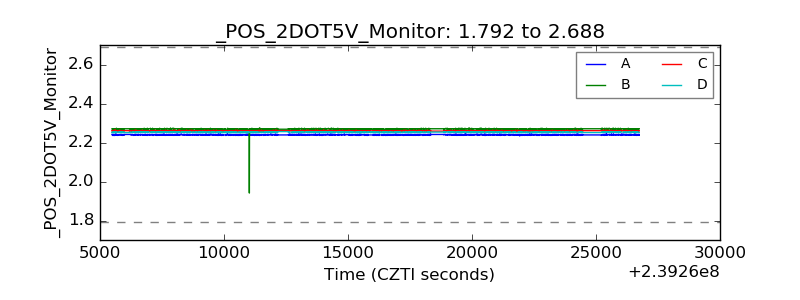 |
| +5 Volts monitor | 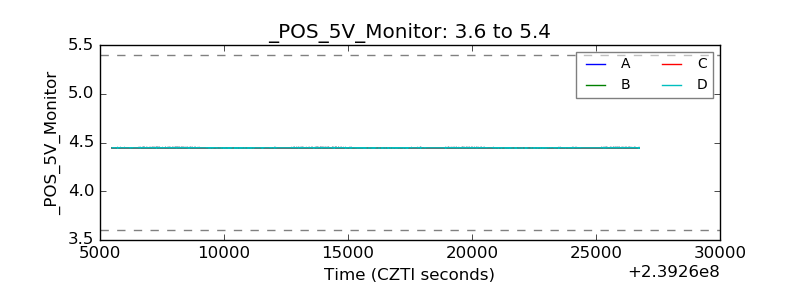 |
| _ROLL_ROT | 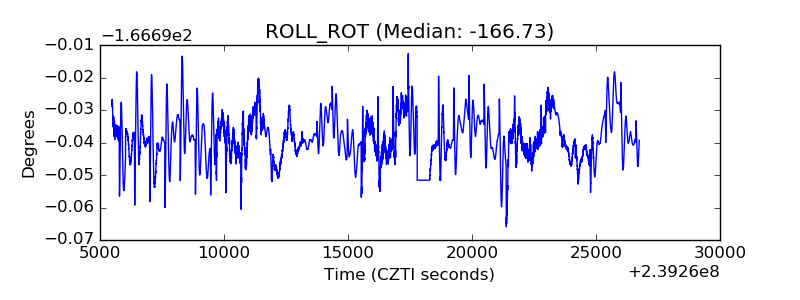 |
| _Roll_DEC | 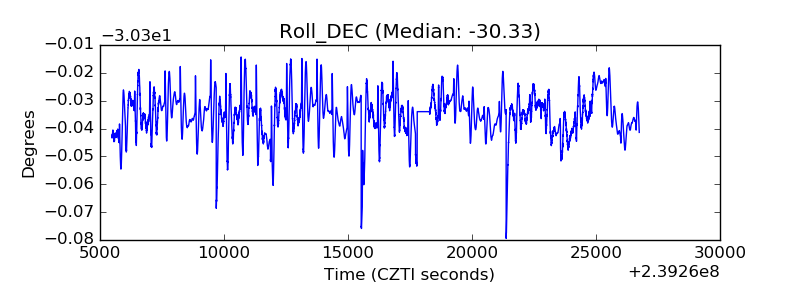 |
| _Roll_RA | 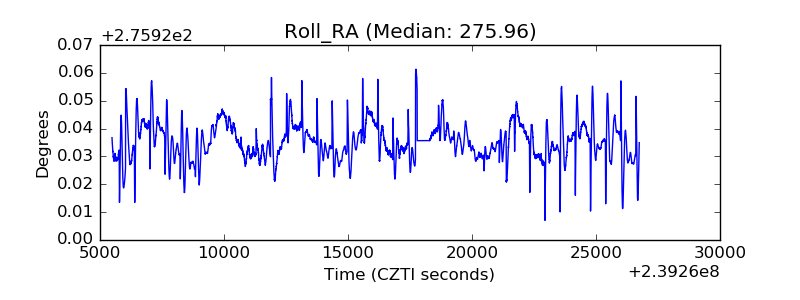 |
| Veto Counter | 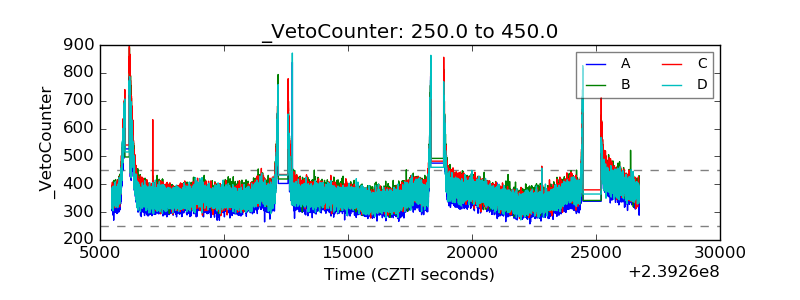 |