| Param | Original file | Final file |
|---|---|---|
| Filename | modeM0/AS1G07_047T01_9000001424_09967cztM0_level2.evt | modeM0/AS1G07_047T01_9000001424_09967cztM0_level2_quad_clean.evt |
| Size (bytes) | 447,120,000 | 89,637,120 |
| Size | 426.4 MB | 85.5 MB |
| Events in quadrant A | 2,949,194 | 573,676 |
| Events in quadrant B | 3,102,274 | 582,207 |
| Events in quadrant C | 2,735,320 | 580,985 |
| Events in quadrant D | 4,336,838 | 548,784 |
| Mode M0 | |||
|---|---|---|---|
| Quadrant | BADHDUFLAG | Total packets | Discarded packets |
| A | 0 | 13046 | 104 |
| B | 0 | 13260 | 123 |
| C | 0 | 12562 | 79 |
| D | 0 | 17196 | 162 |
| Mode SS | |||
|---|---|---|---|
| Quadrant | BADHDUFLAG | Total packets | Discarded packets |
| A | 0 | 126 | 0 |
| B | 0 | 126 | 0 |
| C | 0 | 126 | 2 |
| D | 0 | 126 | 0 |
| Mode M9 | |||
|---|---|---|---|
| Quadrant | BADHDUFLAG | Total packets | Discarded packets |
| A | 0 | 9 | 0 |
| B | 0 | 9 | 0 |
| C | 0 | 9 | 0 |
| D | 0 | 9 | 0 |
| Quadrant | Total seconds | Saturated seconds | Saturation percentage |
|---|---|---|---|
| A | 6145 | 94 | 1.529699% |
| B | 6135 | 103 | 1.678892% |
| C | 6151 | 47 | 0.764103% |
| D | 6133 | 197 | 3.212131% |
Noise dominated data is calculated using 1-second bins in cleaned event files. If a bin has >2000 counts, and if more than 50% of those come from <1% of pixels, then it is considered to be noise-dominated and hence unusable.
| Quadrant | # 1 sec bins | Bins with >0 counts | Bins with >2000 counts | High rate bins dominated by noise | Noise dominated (total time) | Noise dominated (detector-on time) | Marked lightcurve |
|---|---|---|---|---|---|---|---|
| A | 7085 | 6186 | 40 | 40 | 0.56% | 0.65% | 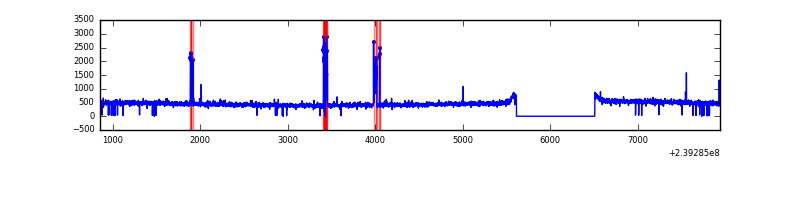 |
| B | 7085 | 6187 | 31 | 31 | 0.44% | 0.50% | 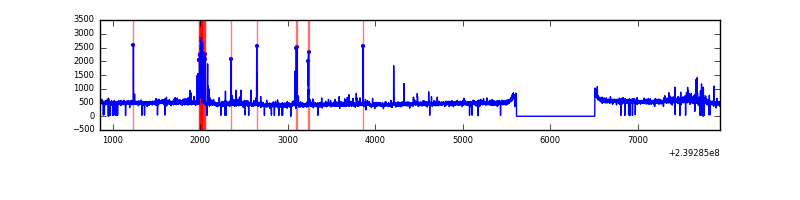 |
| C | 7085 | 6187 | 0 | 0 | 0.00% | 0.00% | 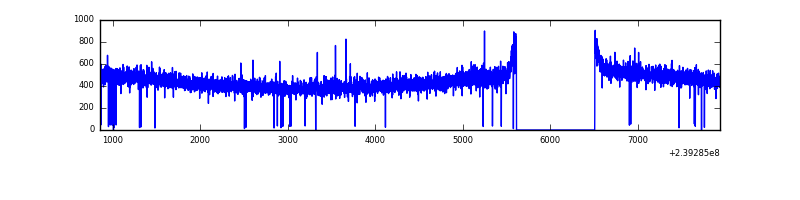 |
| D | 7085 | 6187 | 128 | 128 | 1.81% | 2.07% | 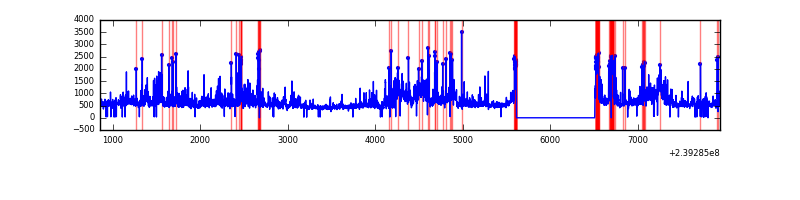 |
Top three noisy pixels from each quadrant. If the there are fewer than three noisy pixels in the level2.evt file, extra rows are filled as -1
| Pixel properties | Quadrant properties | ||||||
|---|---|---|---|---|---|---|---|
| Quadrant | DetID | PixID | Counts | Sigma | Mean | Median | Sigma |
| A | 15 | 174 | 160516 | 1080.24 | 723 | 708 | 147.9 |
| A | 0 | 226 | 6633 | 40.05 | 723 | 708 | 147.9 |
| A | 12 | 194 | 6193 | 37.08 | 723 | 708 | 147.9 |
| B | 4 | 239 | 122149 | 869.55 | 722 | 704 | 139.7 |
| B | 0 | 214 | 63071 | 446.55 | 722 | 704 | 139.7 |
| B | 4 | 81 | 44523 | 313.75 | 722 | 704 | 139.7 |
| C | 13 | 61 | 5221 | 27.71 | 700 | 702 | 163.1 |
| C | 14 | 67 | 4614 | 23.99 | 700 | 702 | 163.1 |
| C | 8 | 222 | 2508 | 11.07 | 700 | 702 | 163.1 |
| D | 1 | 52 | 710495 | 4129.11 | 684 | 666 | 171.9 |
| D | 2 | 16 | 335506 | 1947.78 | 684 | 666 | 171.9 |
| D | 2 | 152 | 218281 | 1265.88 | 684 | 666 | 171.9 |
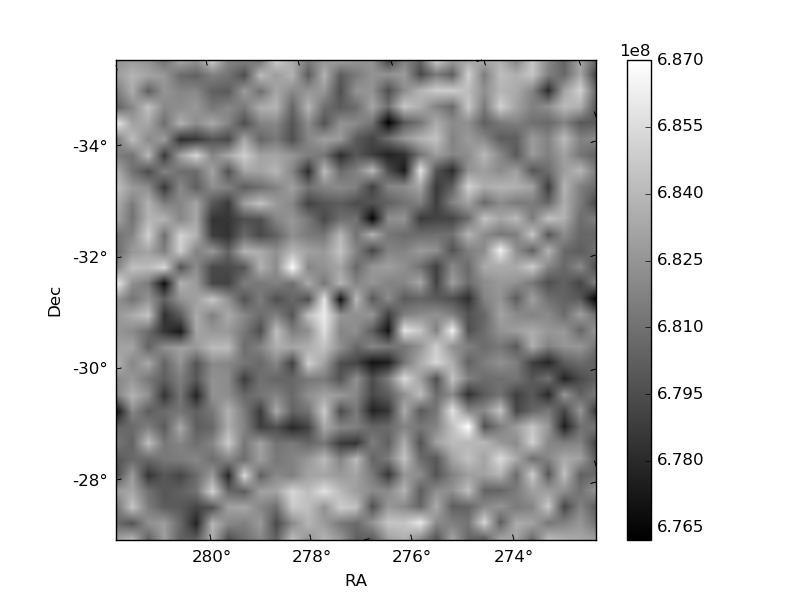
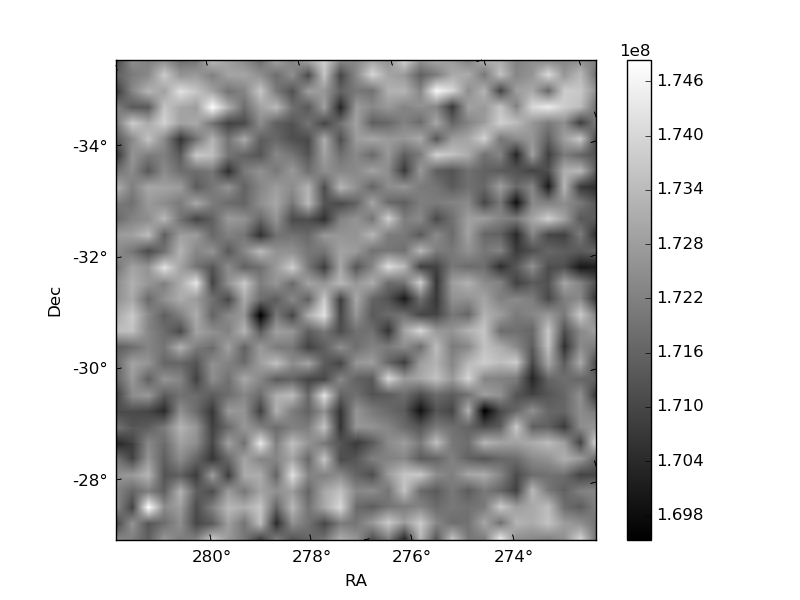
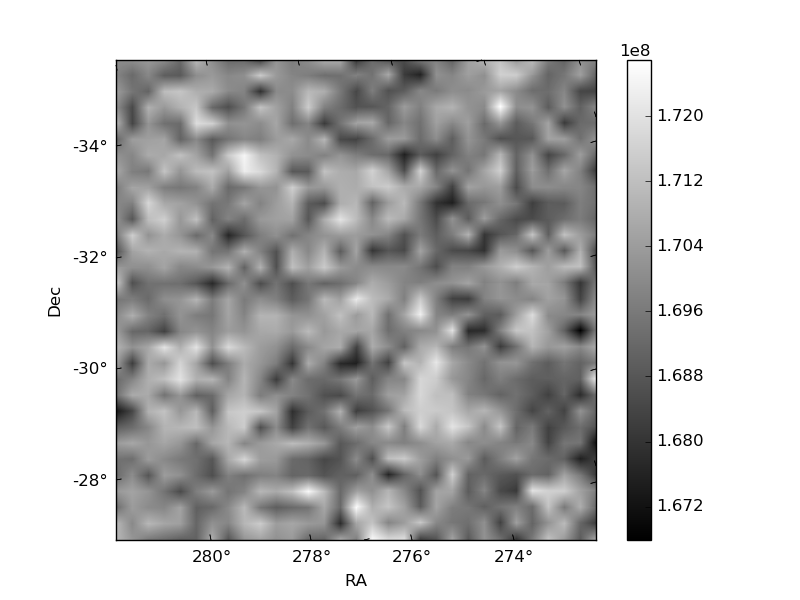
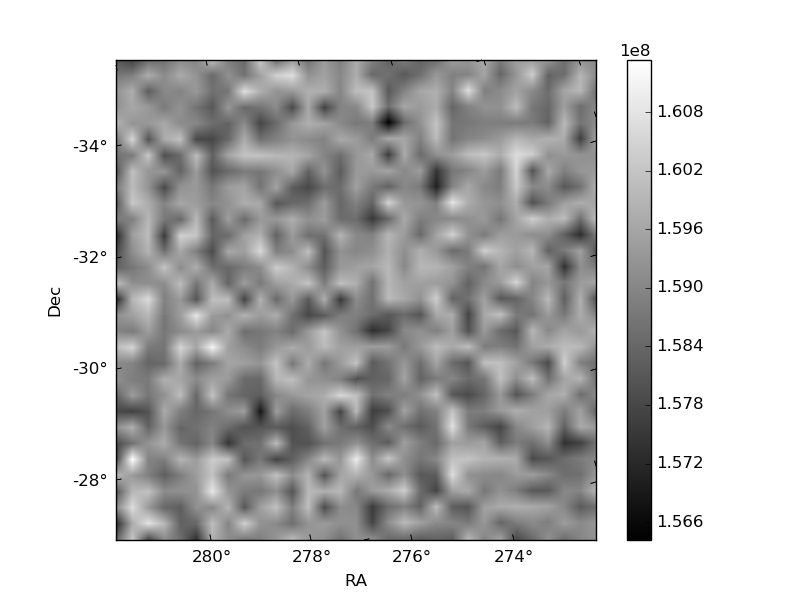
Histogram calculated using DETX and DETY for each event in the final _common_clean file
| Quadrant A | 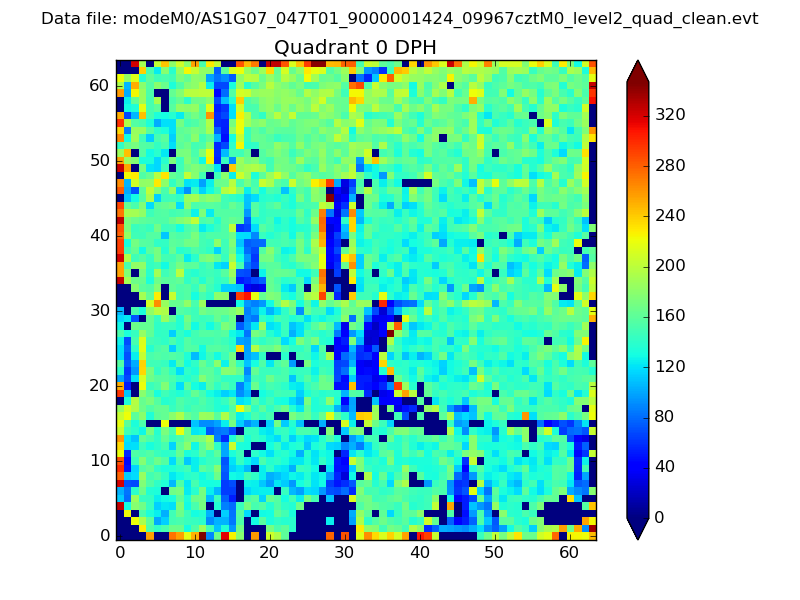 |
 |
Quadrant B |
|---|---|---|---|
| Quadrant D | 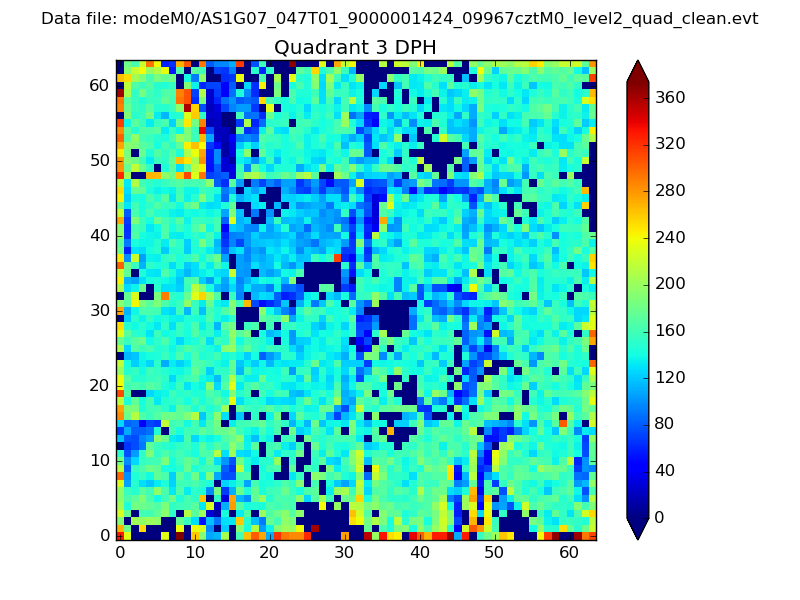 |
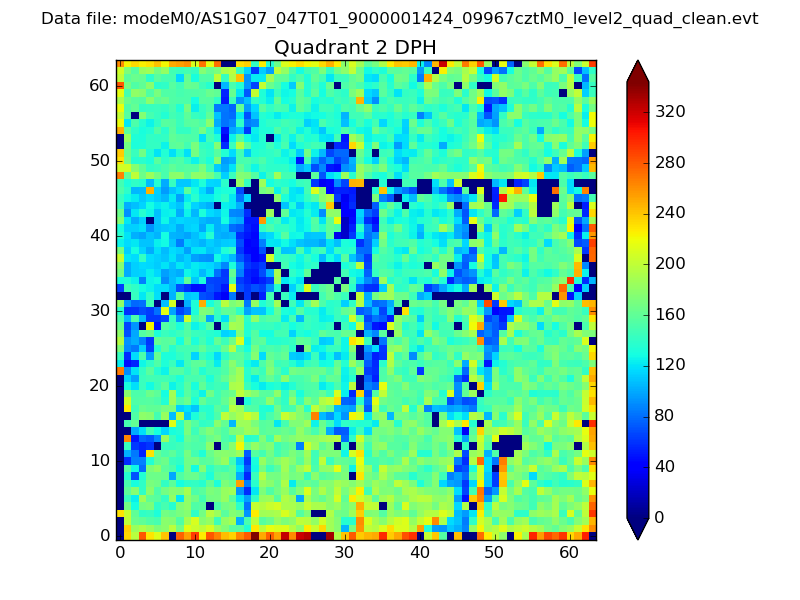 |
Quadrant C |
| Plot type | Count rate plots | Images |
|---|---|---|
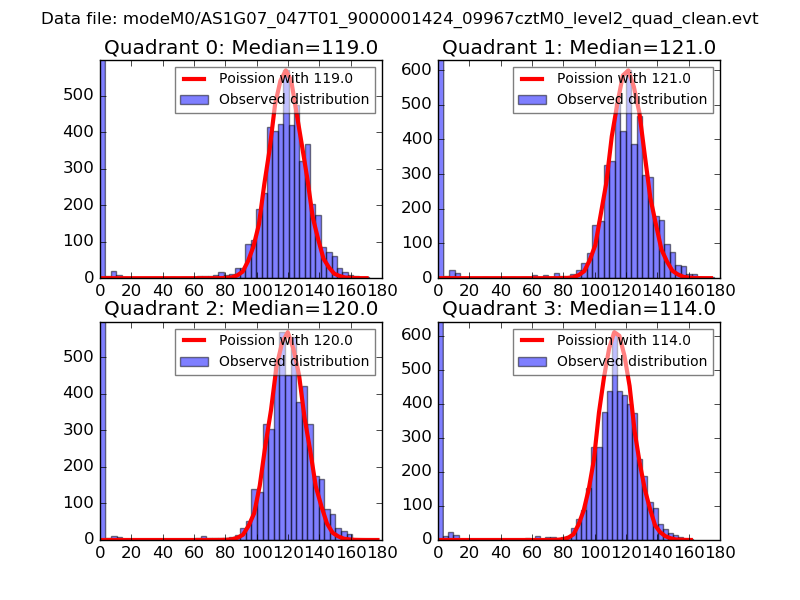
| Comparison with Poisson distribution Blue bars denote a histogram of data divided into 1 sec bins. Red curve is a Poisson curve with rate = median count rate of data. |
 |
 |
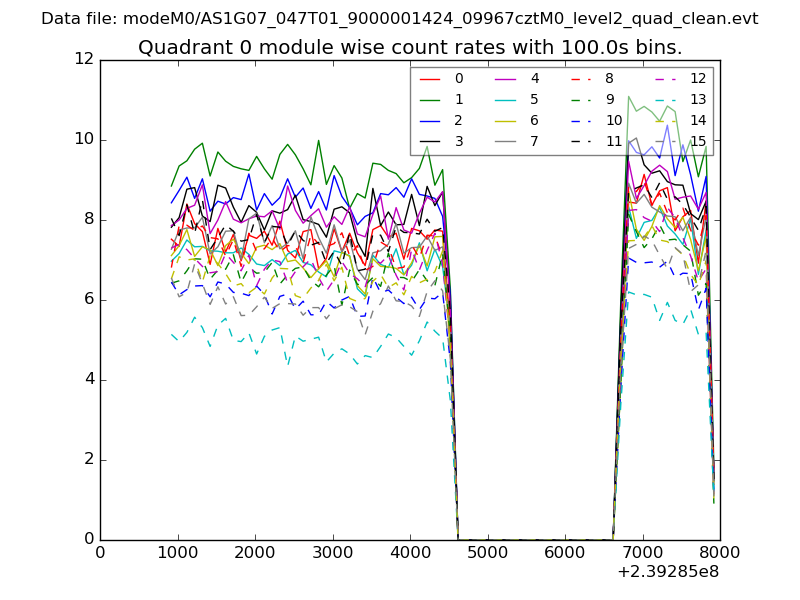
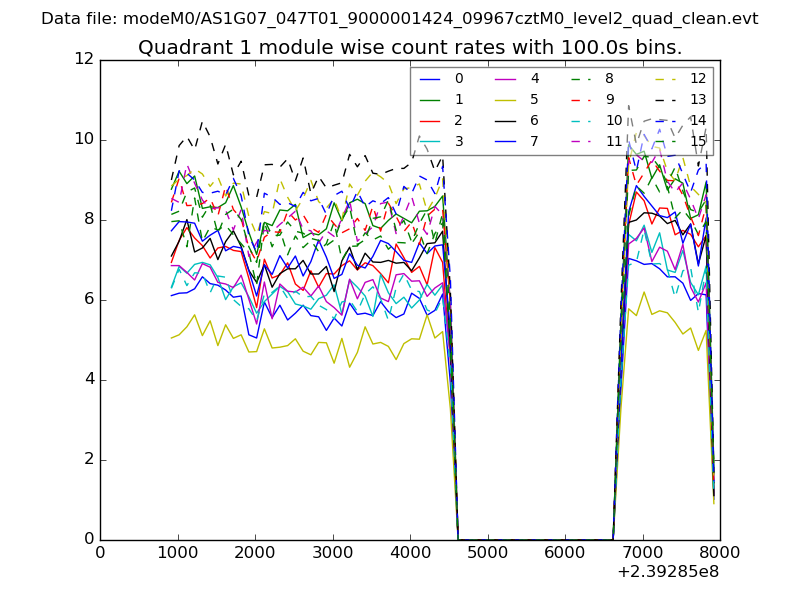
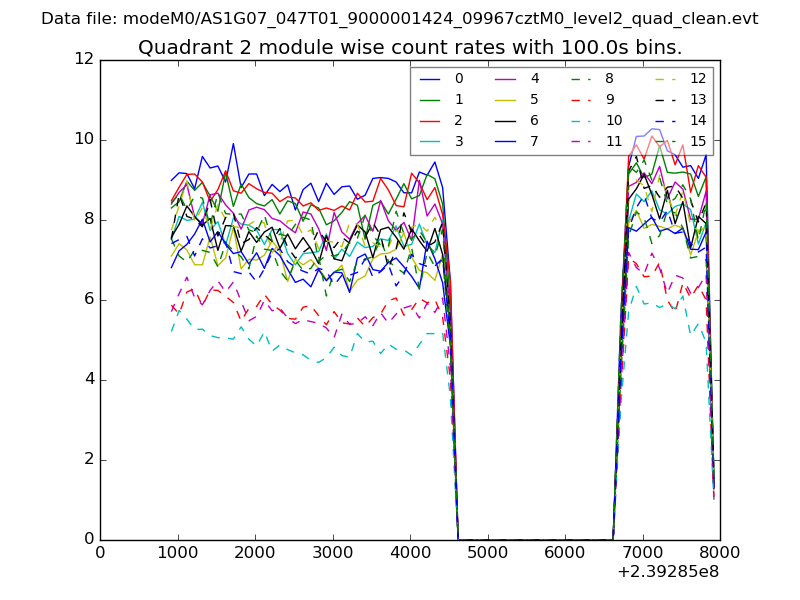
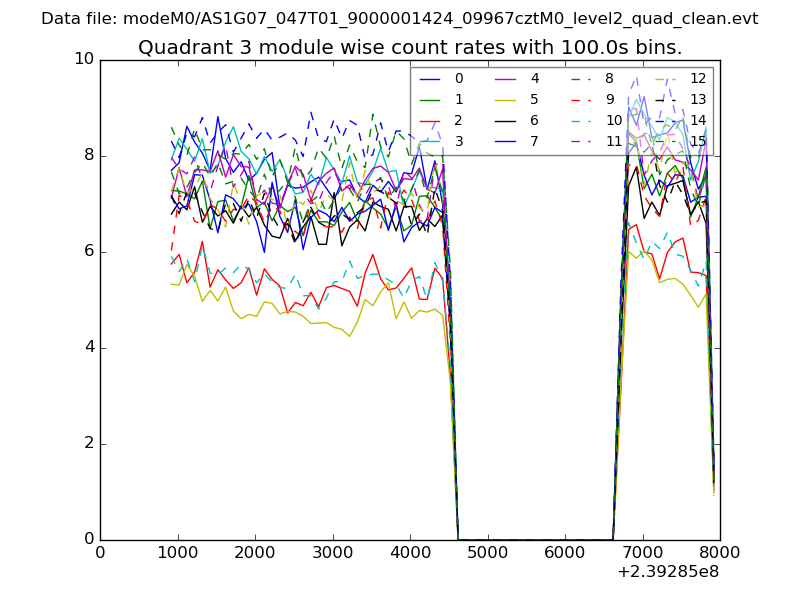
| Quadrant-wise count rates Data is divided into 100 sec bins |
 |
|
| Module-wise count rates for Quadrant A Data is divided into 100 sec bins |
 |
 |
| Module-wise count rates for Quadrant B Data is divided into 100 sec bins |
 |
 |
| Module-wise count rates for Quadrant C Data is divided into 100 sec bins |
 |
 |
| Module-wise count rates for Quadrant D Data is divided into 100 sec bins |
 |
 |
| Parameter | Plot |
|---|---|
| CZT HV Monitor | 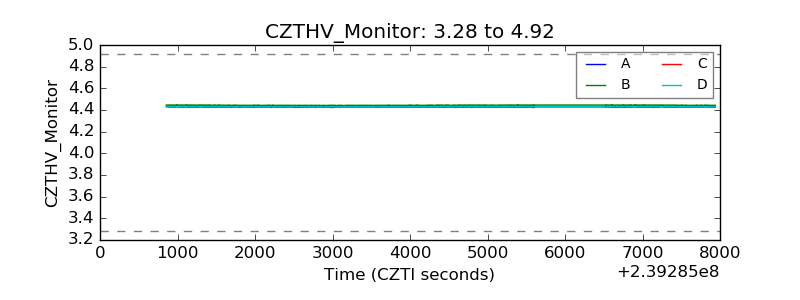 |
| D_VDD | 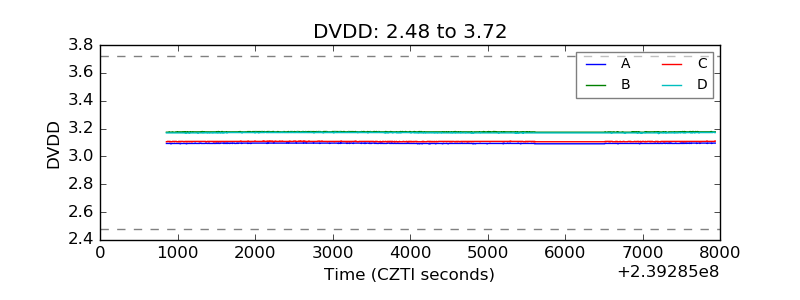 |
| Temperature 1 | 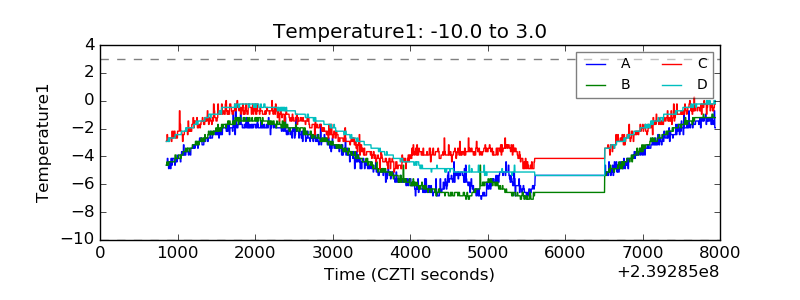 |
| Veto HV Monitor | 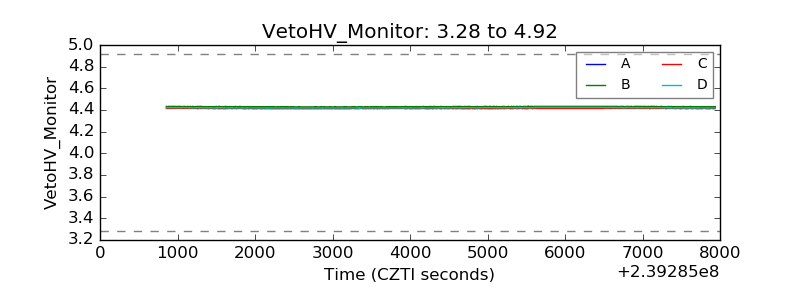 |
| Veto LLD | 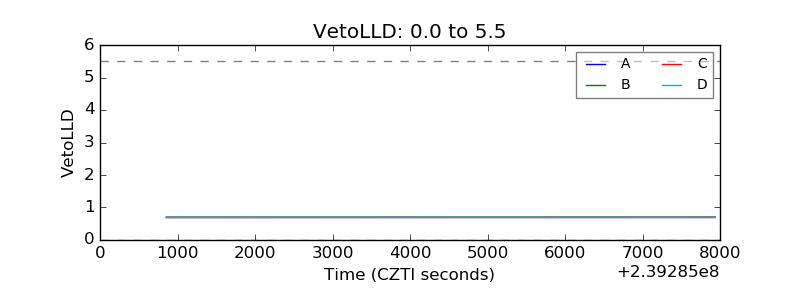 |
| Alpha Counter |  |
| _CPM_Rate |  |
| CZT Counter | 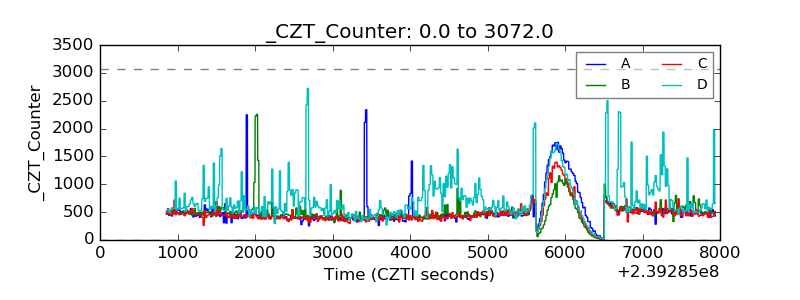 |
| +2.5 Volts monitor |  |
| +5 Volts monitor |  |
| _ROLL_ROT | 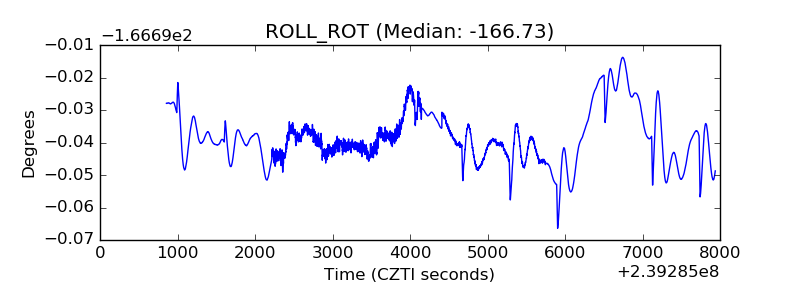 |
| _Roll_DEC | 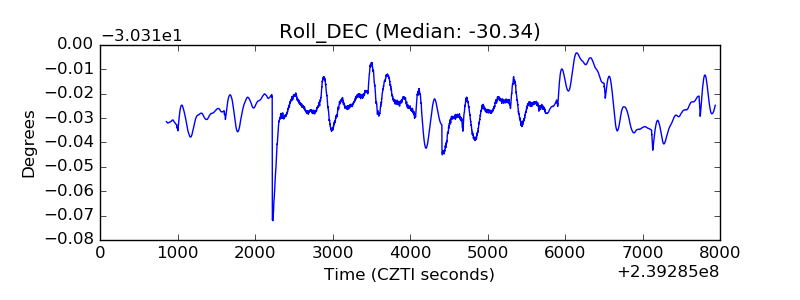 |
| _Roll_RA |  |
| Veto Counter | 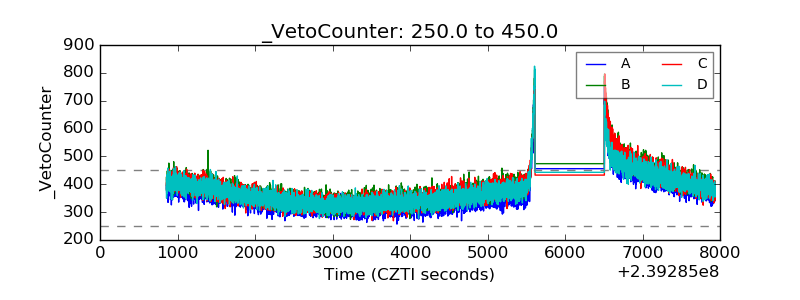 |