| Param | Original file | Final file |
|---|---|---|
| Filename | modeM0/AS1G07_047T01_9000001424_09970cztM0_level2.evt | modeM0/AS1G07_047T01_9000001424_09970cztM0_level2_quad_clean.evt |
| Size (bytes) | 517,550,400 | 101,813,760 |
| Size | 493.6 MB | 97.1 MB |
| Events in quadrant A | 3,251,218 | 671,091 |
| Events in quadrant B | 3,628,834 | 677,071 |
| Events in quadrant C | 3,040,811 | 663,954 |
| Events in quadrant D | 5,305,412 | 610,914 |
| Mode M0 | |||
|---|---|---|---|
| Quadrant | BADHDUFLAG | Total packets | Discarded packets |
| A | 0 | 14187 | 3 |
| B | 0 | 15259 | 2 |
| C | 0 | 13645 | 2 |
| D | 0 | 20355 | 2 |
| Mode SS | |||
|---|---|---|---|
| Quadrant | BADHDUFLAG | Total packets | Discarded packets |
| A | 0 | 134 | 0 |
| B | 0 | 134 | 0 |
| C | 0 | 134 | 0 |
| D | 0 | 134 | 0 |
| Mode M9 | |||
|---|---|---|---|
| Quadrant | BADHDUFLAG | Total packets | Discarded packets |
| A | 0 | 17 | 0 |
| B | 0 | 17 | 0 |
| C | 0 | 17 | 0 |
| D | 0 | 18 | 0 |
| Quadrant | Total seconds | Saturated seconds | Saturation percentage |
|---|---|---|---|
| A | 6600 | 66 | 1.000000% |
| B | 6600 | 96 | 1.454545% |
| C | 6600 | 33 | 0.500000% |
| D | 6600 | 438 | 6.636364% |
Noise dominated data is calculated using 1-second bins in cleaned event files. If a bin has >2000 counts, and if more than 50% of those come from <1% of pixels, then it is considered to be noise-dominated and hence unusable.
| Quadrant | # 1 sec bins | Bins with >0 counts | Bins with >2000 counts | High rate bins dominated by noise | Noise dominated (total time) | Noise dominated (detector-on time) | Marked lightcurve |
|---|---|---|---|---|---|---|---|
| A | 7770 | 6600 | 4 | 4 | 0.05% | 0.06% | 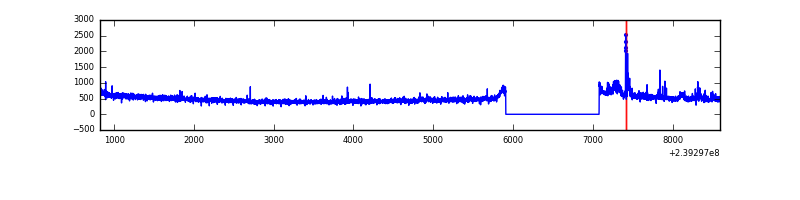 |
| B | 7770 | 6600 | 33 | 33 | 0.42% | 0.50% | 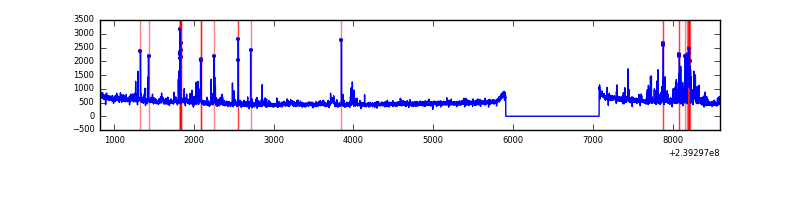 |
| C | 7770 | 6600 | 0 | 0 | 0.00% | 0.00% | 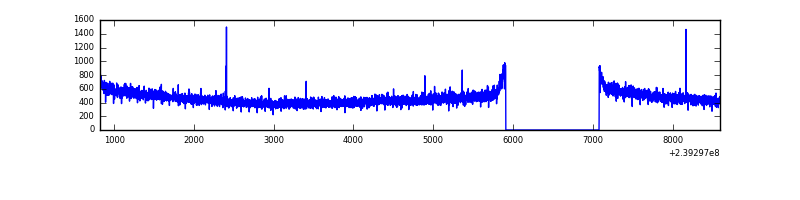 |
| D | 7770 | 6600 | 360 | 360 | 4.63% | 5.45% | 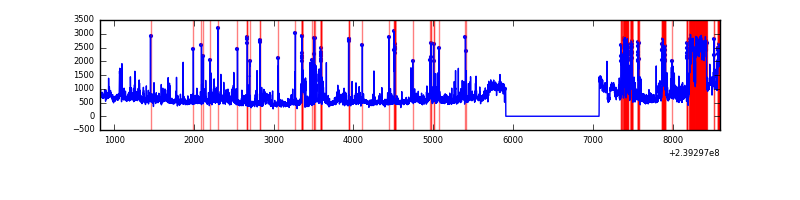 |
Top three noisy pixels from each quadrant. If the there are fewer than three noisy pixels in the level2.evt file, extra rows are filled as -1
| Pixel properties | Quadrant properties | ||||||
|---|---|---|---|---|---|---|---|
| Quadrant | DetID | PixID | Counts | Sigma | Mean | Median | Sigma |
| A | 13 | 251 | 67861 | 402.21 | 814 | 797 | 166.7 |
| A | 8 | 15 | 31884 | 186.44 | 814 | 797 | 166.7 |
| A | 15 | 174 | 17288 | 98.9 | 814 | 797 | 166.7 |
| B | 4 | 81 | 223117 | 1434.95 | 811 | 794 | 154.9 |
| B | 0 | 219 | 50784 | 322.65 | 811 | 794 | 154.9 |
| B | 5 | 32 | 44609 | 282.8 | 811 | 794 | 154.9 |
| C | 13 | 61 | 5775 | 27.97 | 776 | 781 | 178.6 |
| C | 8 | 222 | 4643 | 21.63 | 776 | 781 | 178.6 |
| C | 14 | 67 | 4056 | 18.34 | 776 | 781 | 178.6 |
| D | 1 | 52 | 1136384 | 5585.5 | 759 | 740 | 203.3 |
| D | 2 | 33 | 549797 | 2700.46 | 759 | 740 | 203.3 |
| D | 2 | 16 | 219587 | 1076.37 | 759 | 740 | 203.3 |
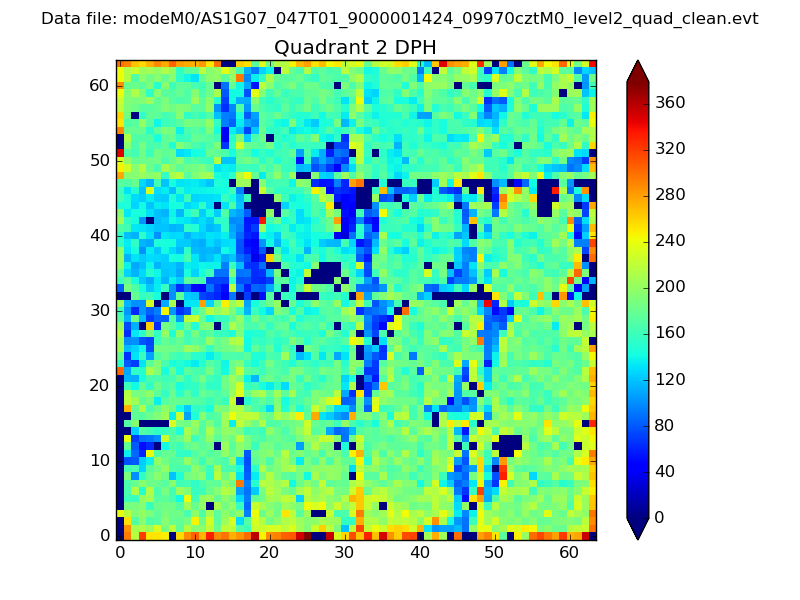
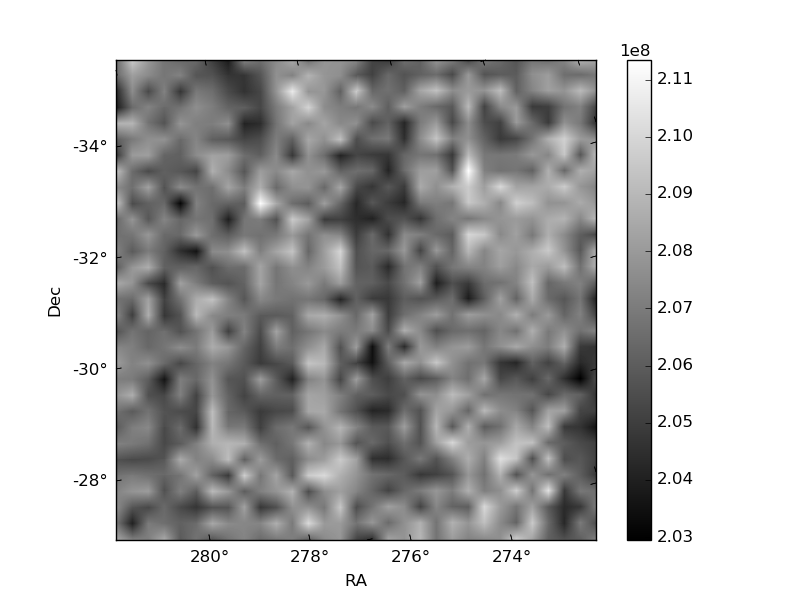
Histogram calculated using DETX and DETY for each event in the final _common_clean file
| Quadrant A | 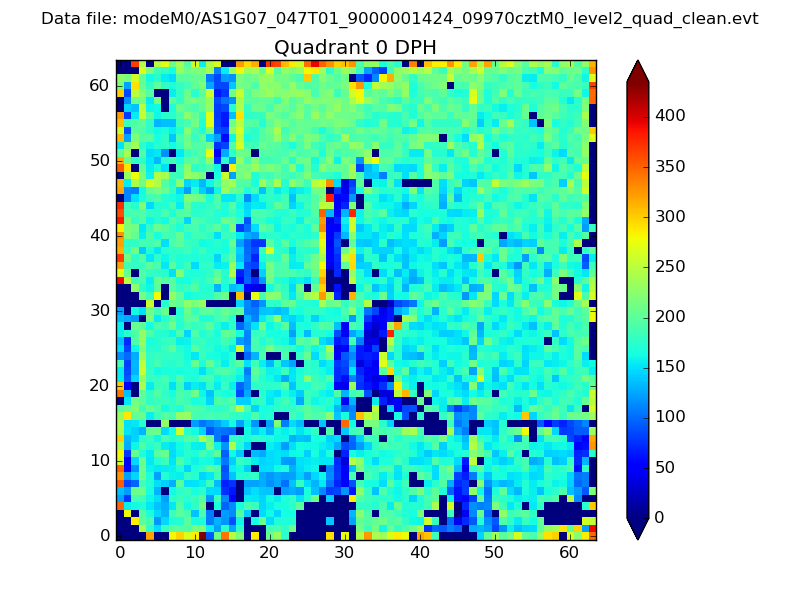 |
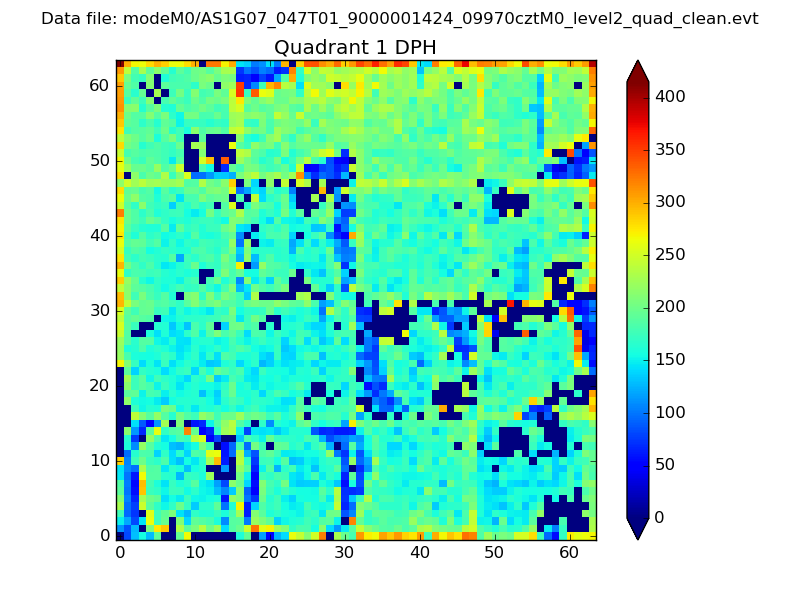 |
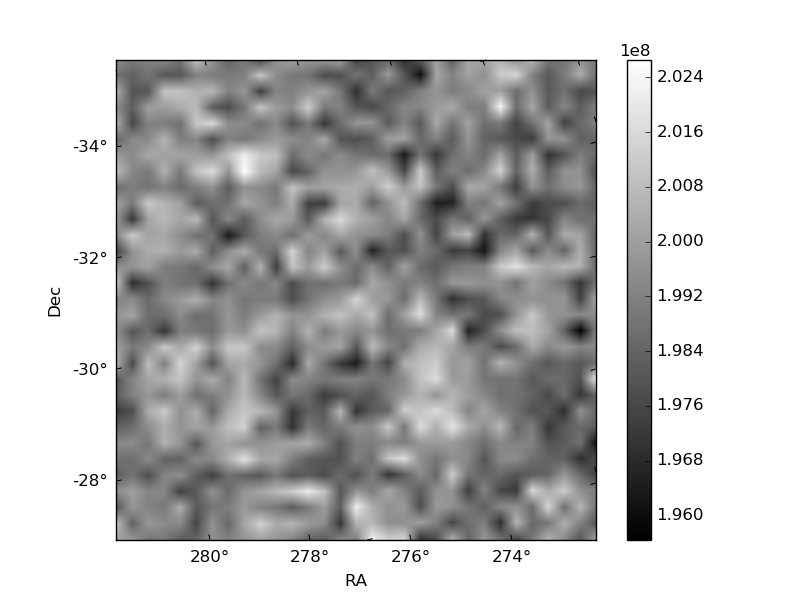
Quadrant B |
|---|---|---|---|
| Quadrant D | 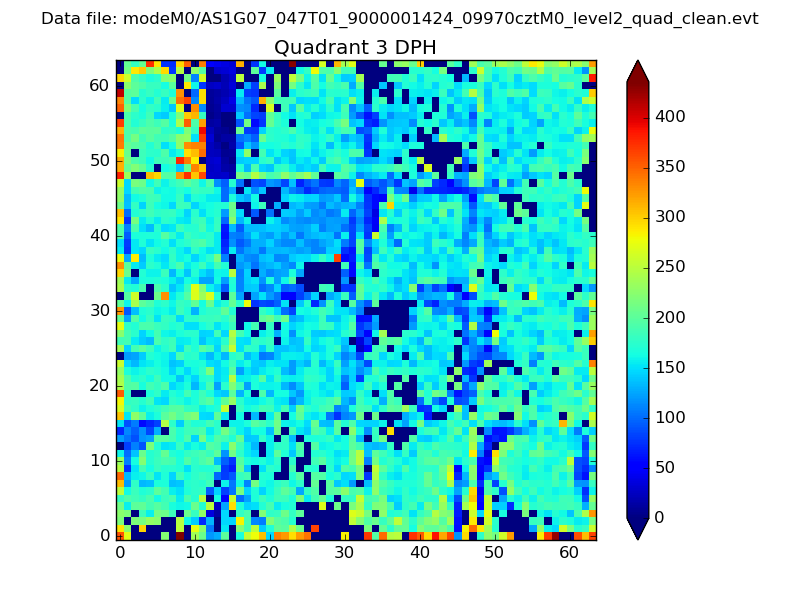 |
 |
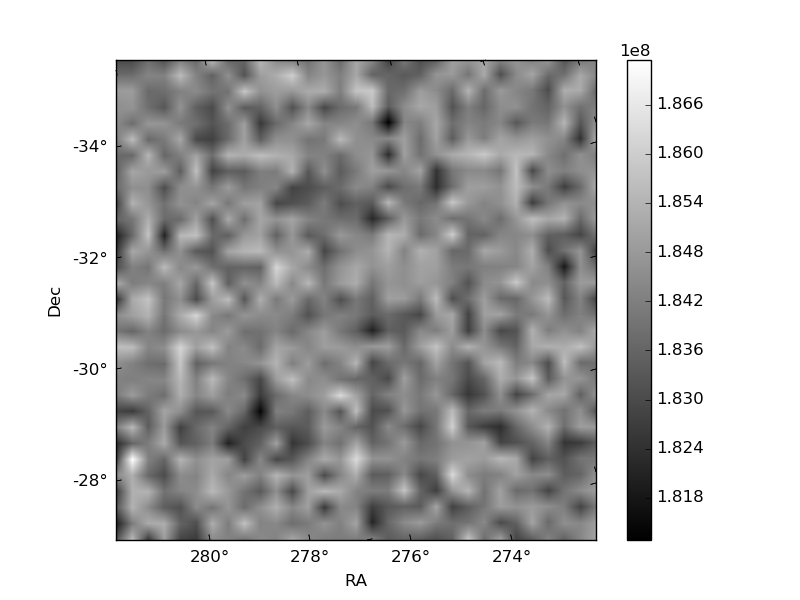
Quadrant C |
| Plot type | Count rate plots | Images |
|---|---|---|
| Comparison with Poisson distribution Blue bars denote a histogram of data divided into 1 sec bins. Red curve is a Poisson curve with rate = median count rate of data. |
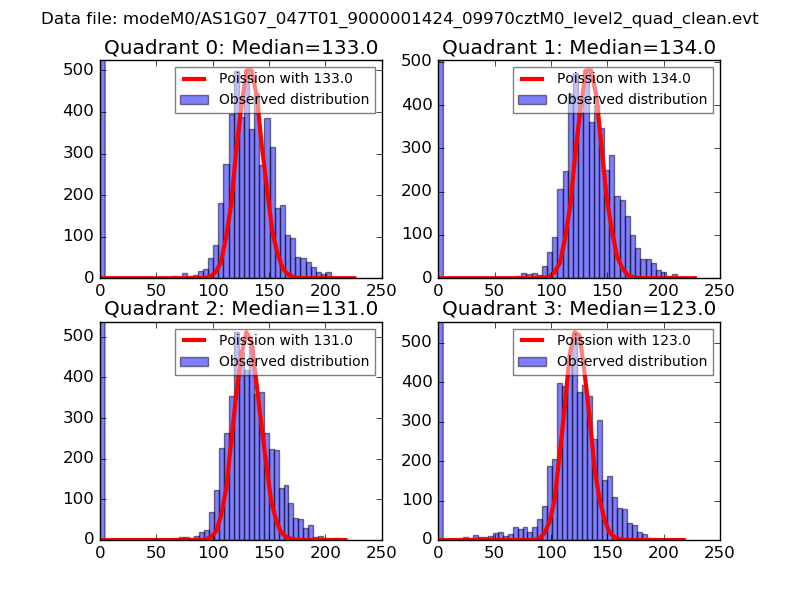 |
 |
| Quadrant-wise count rates Data is divided into 100 sec bins |
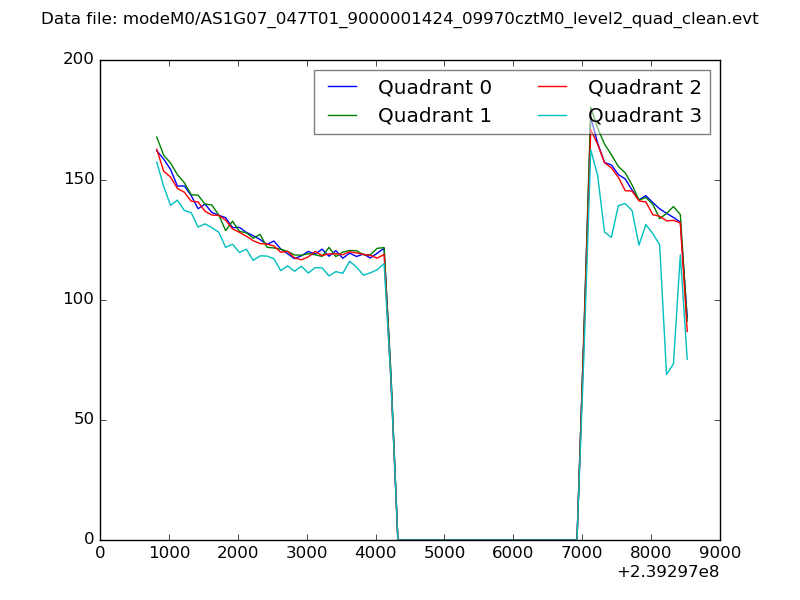 |
|
| Module-wise count rates for Quadrant A Data is divided into 100 sec bins |
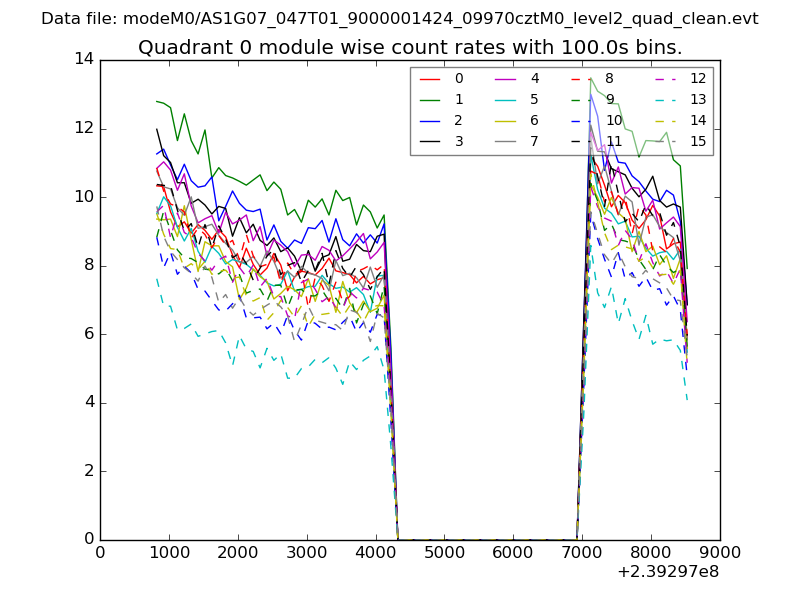 |
 |
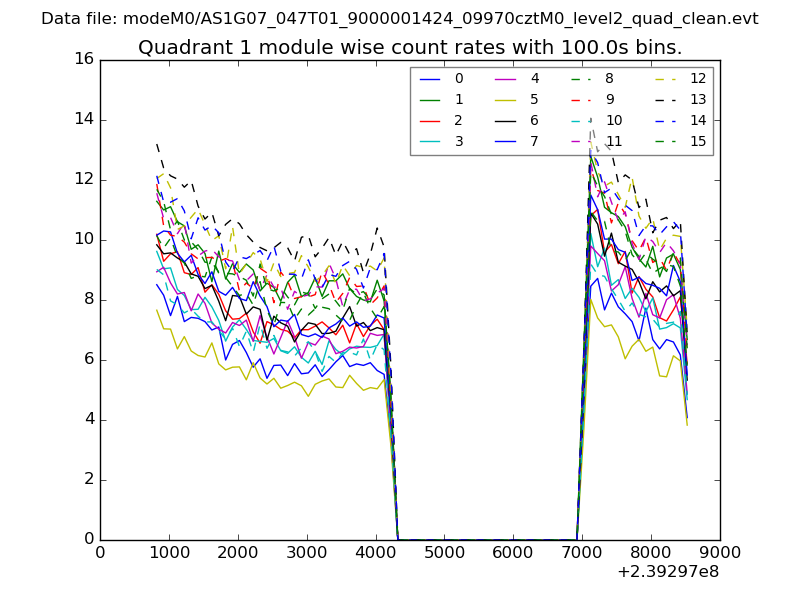
| Module-wise count rates for Quadrant B Data is divided into 100 sec bins |
 |
 |
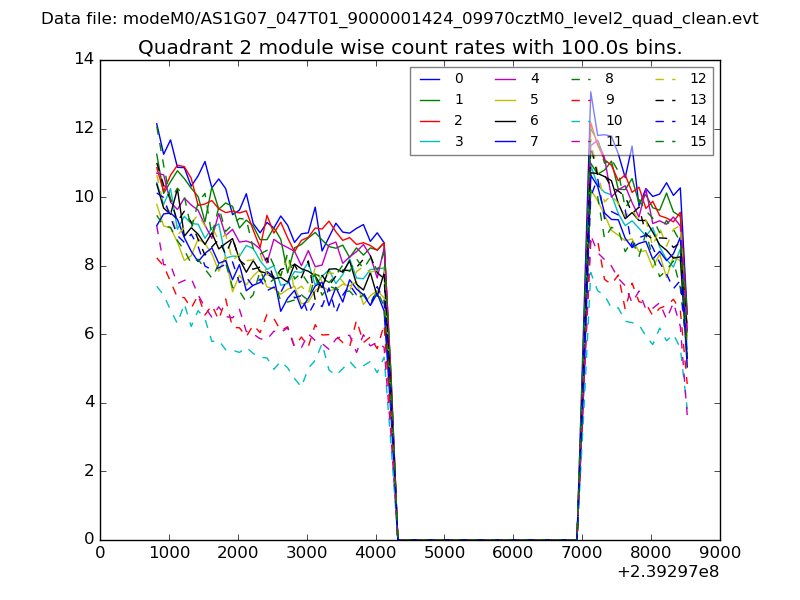
| Module-wise count rates for Quadrant C Data is divided into 100 sec bins |
 |
 |
| Module-wise count rates for Quadrant D Data is divided into 100 sec bins |
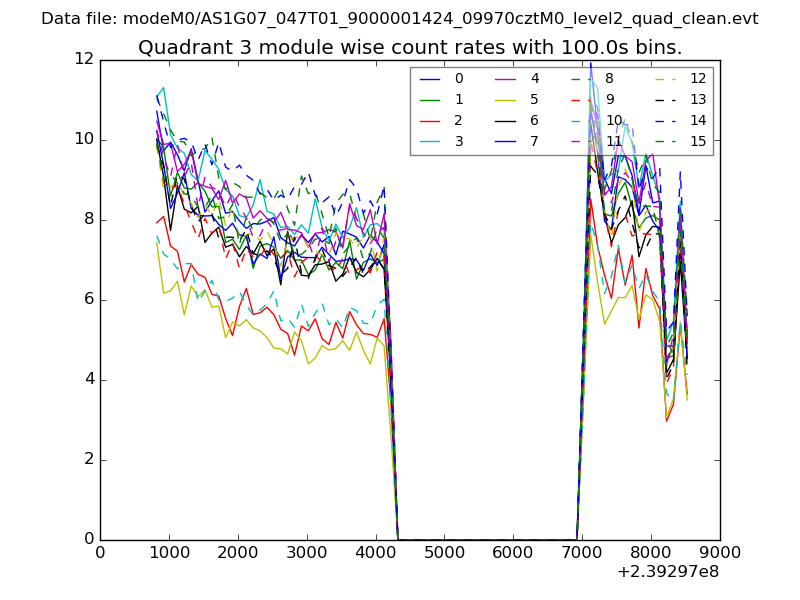 |
 |
| Parameter | Plot |
|---|---|
| CZT HV Monitor | 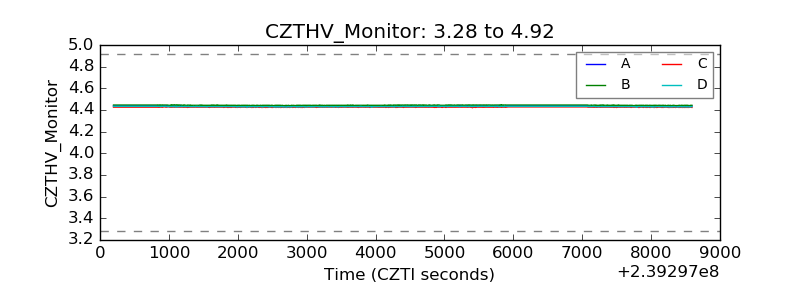 |
| D_VDD |  |
| Temperature 1 | 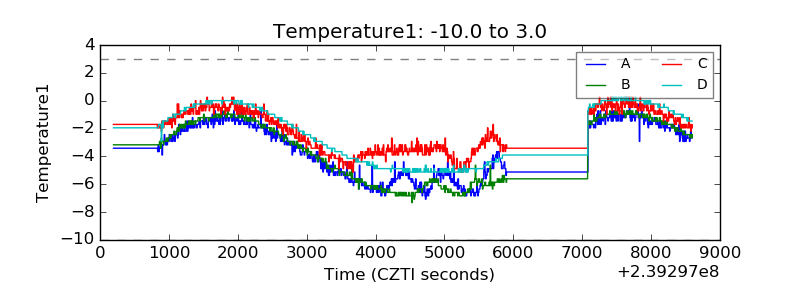 |
| Veto HV Monitor | 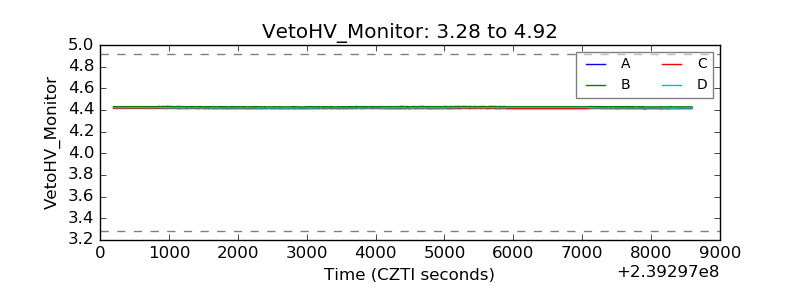 |
| Veto LLD | 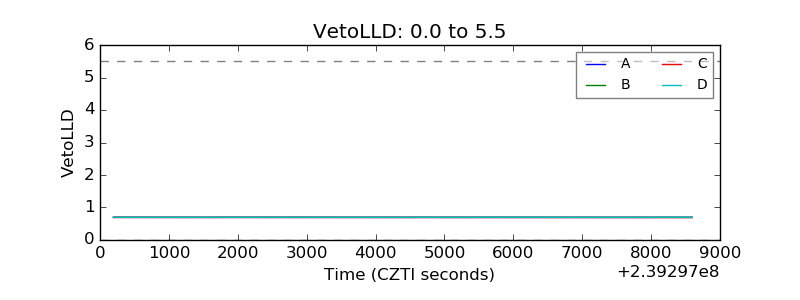 |
| Alpha Counter |  |
| _CPM_Rate |  |
| CZT Counter |  |
| +2.5 Volts monitor |  |
| +5 Volts monitor |  |
| _ROLL_ROT | 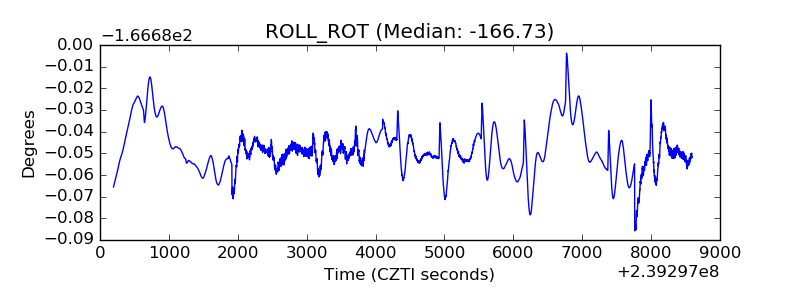 |
| _Roll_DEC | 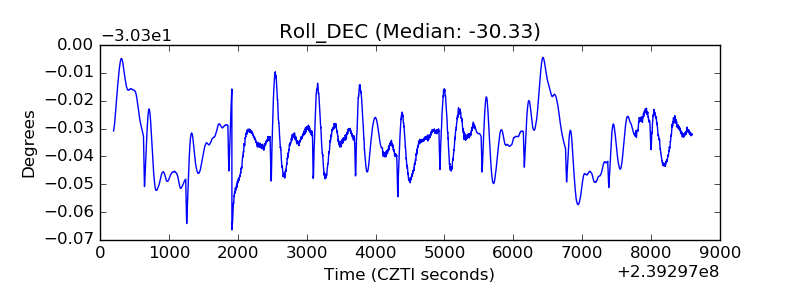 |
| _Roll_RA | 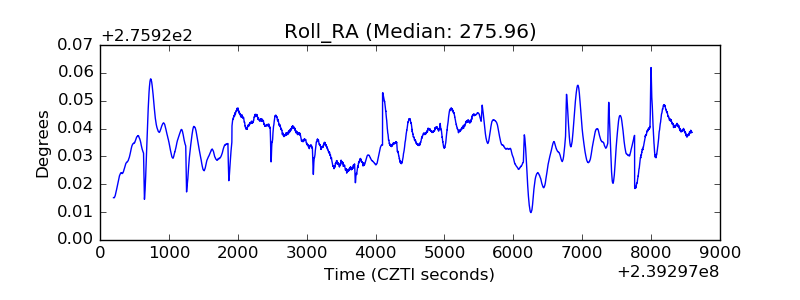 |
| Veto Counter | 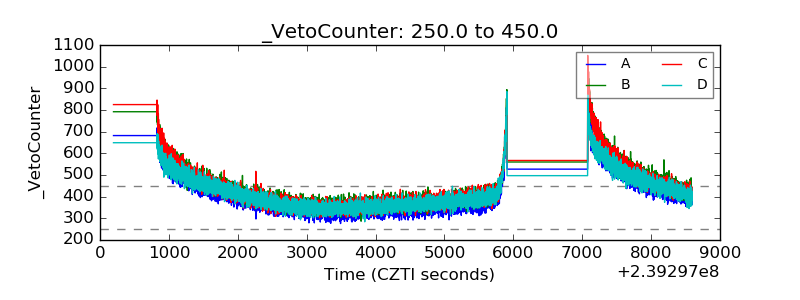 |