| Param | Original file | Final file |
|---|---|---|
| Filename | modeM0/AS1G07_047T01_9000001424_09971cztM0_level2.evt | modeM0/AS1G07_047T01_9000001424_09971cztM0_level2_quad_clean.evt |
| Size (bytes) | 733,576,320 | 92,393,280 |
| Size | 699.6 MB | 88.1 MB |
| Events in quadrant A | 7,614,895 | 542,155 |
| Events in quadrant B | 3,763,977 | 634,471 |
| Events in quadrant C | 2,994,376 | 621,695 |
| Events in quadrant D | 7,409,173 | 550,180 |
| Mode M0 | |||
|---|---|---|---|
| Quadrant | BADHDUFLAG | Total packets | Discarded packets |
| A | 0 | 26875 | 3 |
| B | 0 | 15451 | 2 |
| C | 0 | 13323 | 2 |
| D | 0 | 26548 | 2 |
| Mode SS | |||
|---|---|---|---|
| Quadrant | BADHDUFLAG | Total packets | Discarded packets |
| A | 0 | 132 | 0 |
| B | 0 | 132 | 0 |
| C | 0 | 132 | 0 |
| D | 0 | 132 | 0 |
| Mode M9 | |||
|---|---|---|---|
| Quadrant | BADHDUFLAG | Total packets | Discarded packets |
| A | 0 | 15 | 0 |
| B | 0 | 15 | 0 |
| C | 0 | 15 | 0 |
| D | 0 | 16 | 0 |
| Quadrant | Total seconds | Saturated seconds | Saturation percentage |
|---|---|---|---|
| A | 6429 | 1517 | 23.596205% |
| B | 6429 | 155 | 2.410950% |
| C | 6429 | 45 | 0.699953% |
| D | 6429 | 639 | 9.939337% |
Noise dominated data is calculated using 1-second bins in cleaned event files. If a bin has >2000 counts, and if more than 50% of those come from <1% of pixels, then it is considered to be noise-dominated and hence unusable.
| Quadrant | # 1 sec bins | Bins with >0 counts | Bins with >2000 counts | High rate bins dominated by noise | Noise dominated (total time) | Noise dominated (detector-on time) | Marked lightcurve |
|---|---|---|---|---|---|---|---|
| A | 7719 | 6429 | 1440 | 1440 | 18.66% | 22.40% | 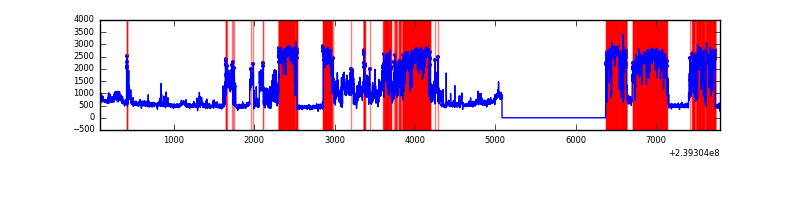 |
| B | 7719 | 6429 | 67 | 67 | 0.87% | 1.04% | 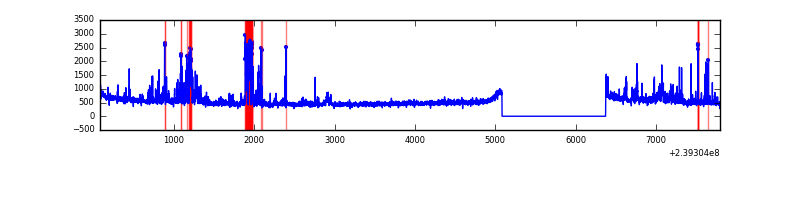 |
| C | 7719 | 6429 | 0 | 0 | 0.00% | 0.00% | 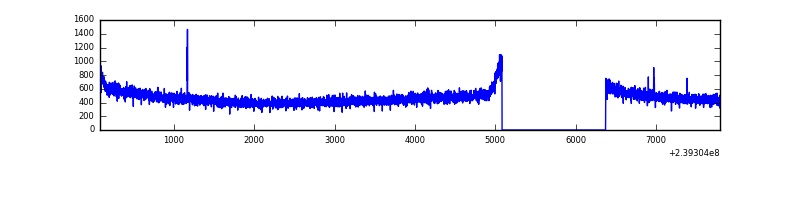 |
| D | 7719 | 6429 | 585 | 585 | 7.58% | 9.10% | 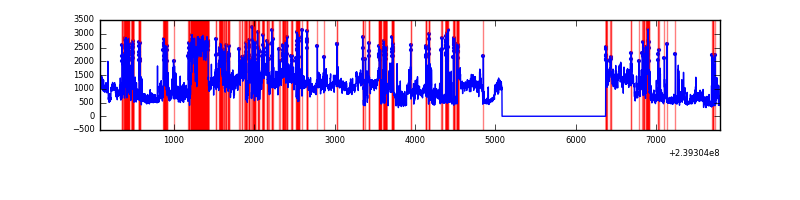 |
Top three noisy pixels from each quadrant. If the there are fewer than three noisy pixels in the level2.evt file, extra rows are filled as -1
| Pixel properties | Quadrant properties | ||||||
|---|---|---|---|---|---|---|---|
| Quadrant | DetID | PixID | Counts | Sigma | Mean | Median | Sigma |
| A | 13 | 251 | 4729288 | 32129.36 | 726 | 711 | 147.2 |
| A | 8 | 15 | 50882 | 340.89 | 726 | 711 | 147.2 |
| A | 15 | 174 | 34505 | 229.62 | 726 | 711 | 147.2 |
| B | 4 | 81 | 309588 | 2033.25 | 803 | 785 | 151.9 |
| B | 15 | 32 | 120999 | 791.53 | 803 | 785 | 151.9 |
| B | 10 | 245 | 57299 | 372.11 | 803 | 785 | 151.9 |
| C | 13 | 61 | 5863 | 28.85 | 765 | 771 | 176.5 |
| C | 8 | 222 | 4086 | 18.78 | 765 | 771 | 176.5 |
| C | 8 | 208 | 3765 | 16.96 | 765 | 771 | 176.5 |
| D | 1 | 52 | 2811930 | 14264.23 | 734 | 719 | 197.1 |
| D | 2 | 16 | 591850 | 2999.43 | 734 | 719 | 197.1 |
| D | 2 | 33 | 489915 | 2482.21 | 734 | 719 | 197.1 |
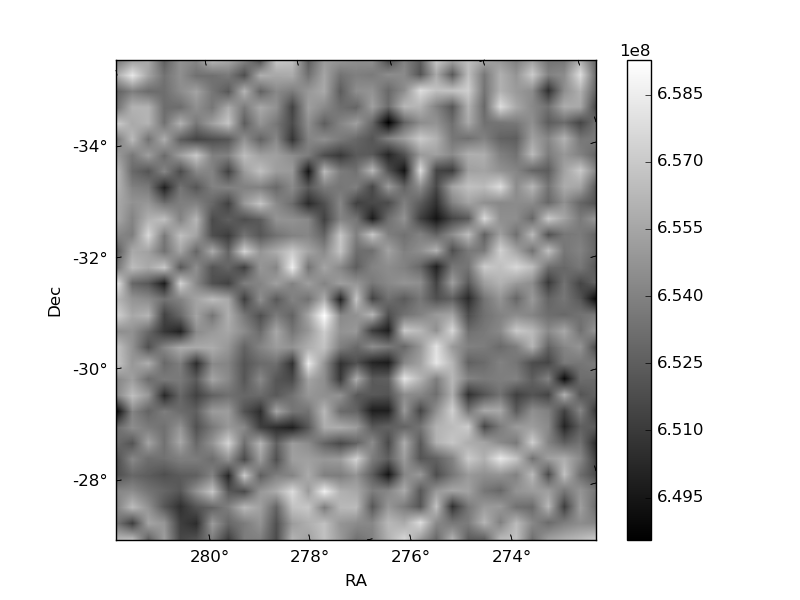
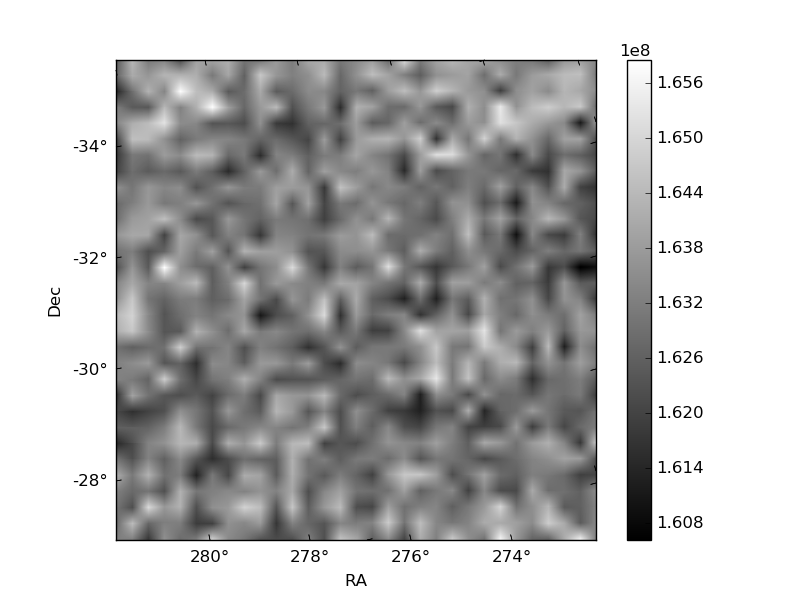
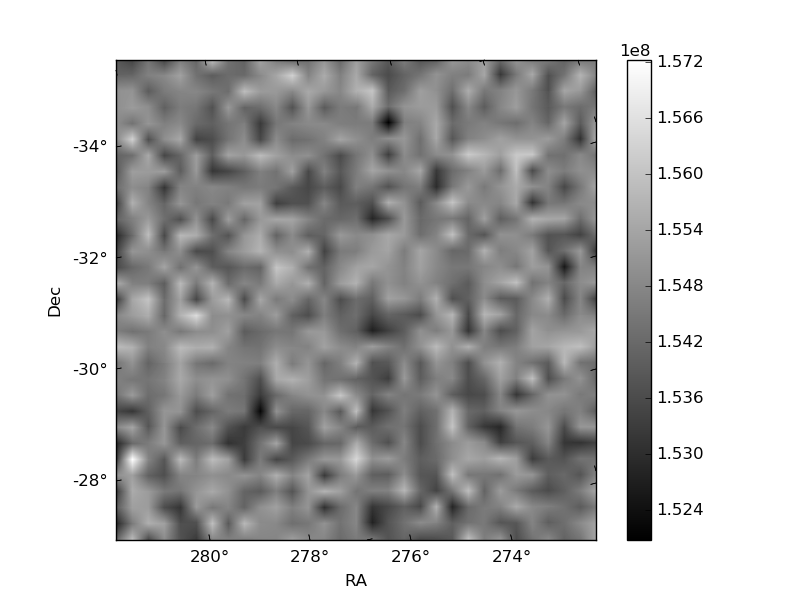
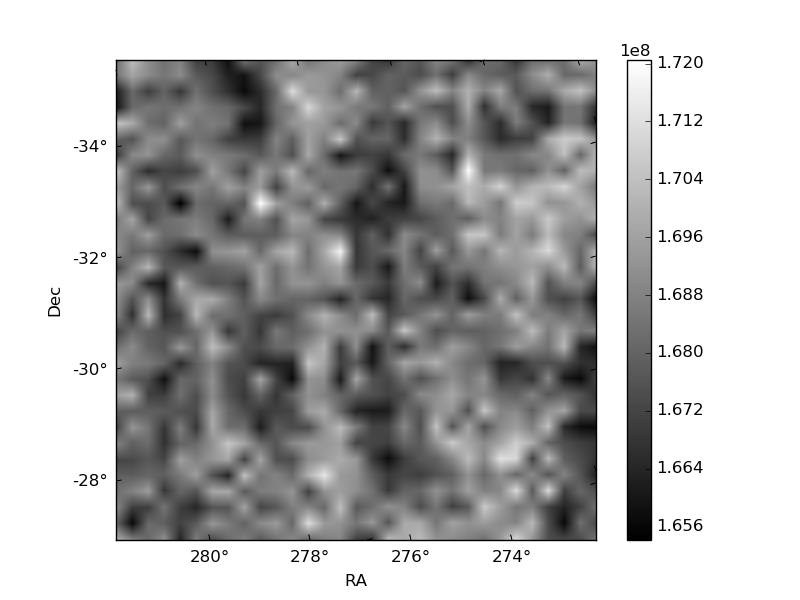
Histogram calculated using DETX and DETY for each event in the final _common_clean file
| Quadrant A | 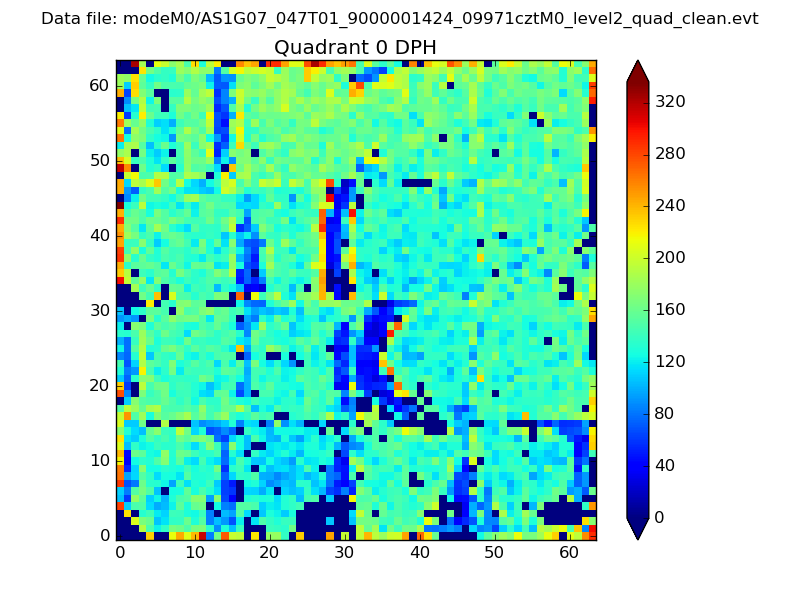 |
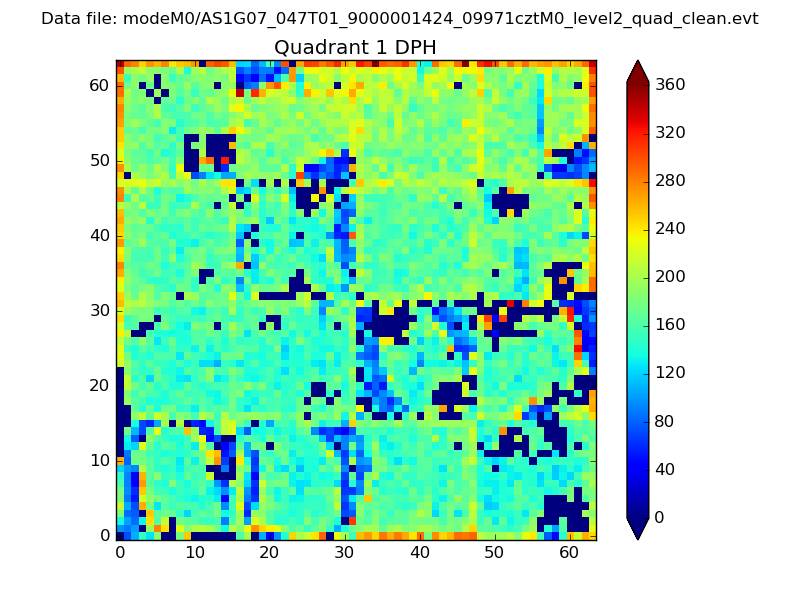 |
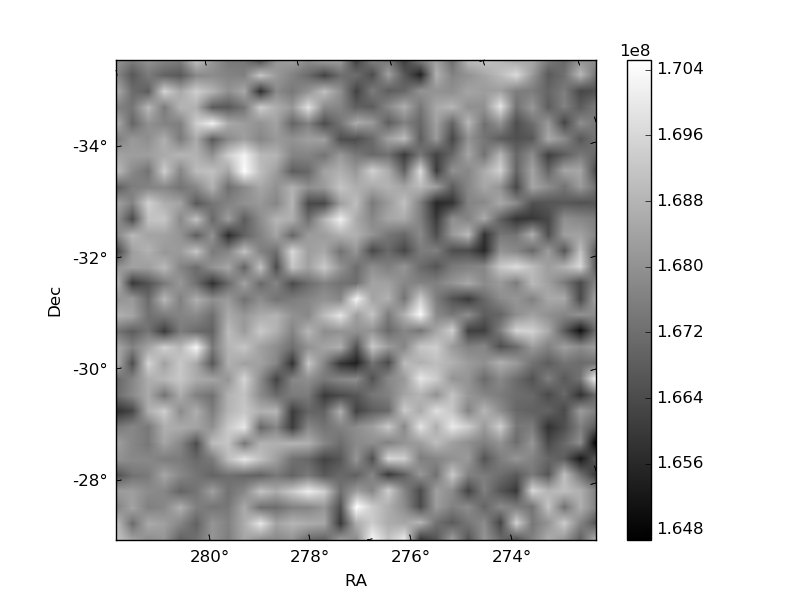
Quadrant B |
|---|---|---|---|
| Quadrant D | 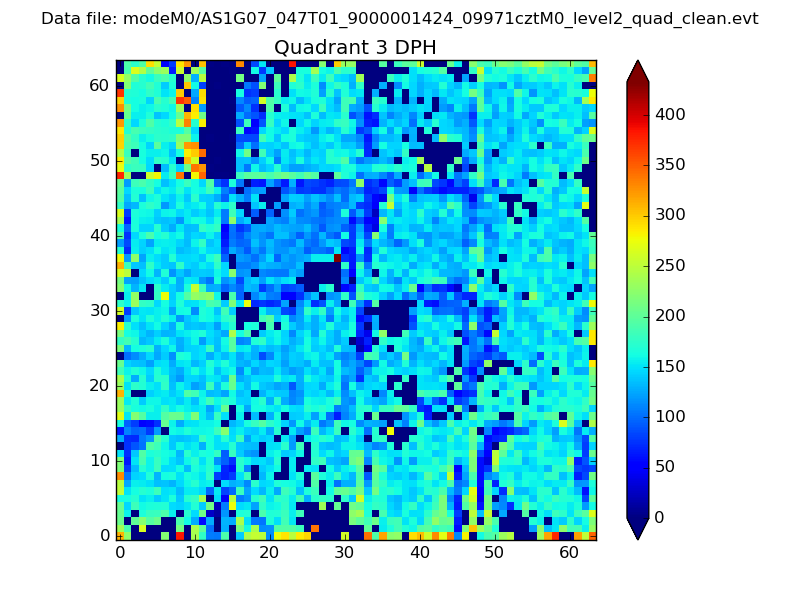 |
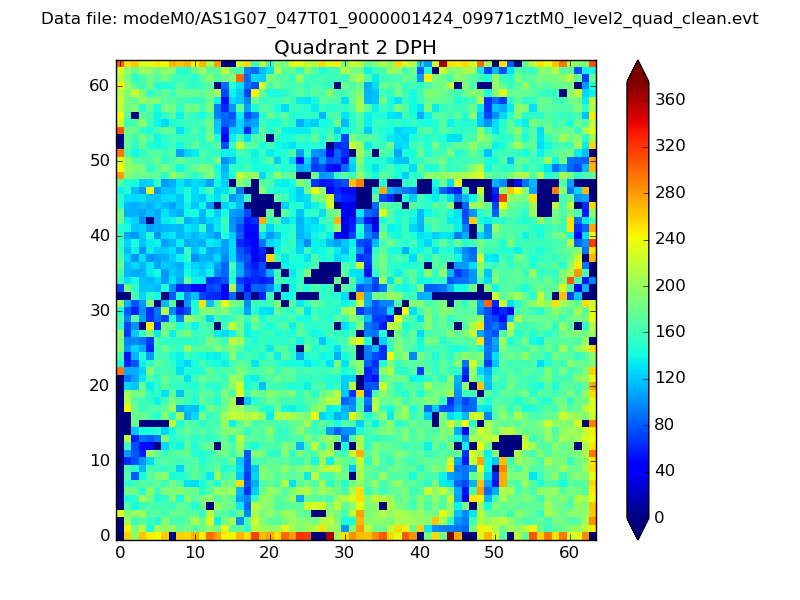 |
Quadrant C |
| Plot type | Count rate plots | Images |
|---|---|---|
| Comparison with Poisson distribution Blue bars denote a histogram of data divided into 1 sec bins. Red curve is a Poisson curve with rate = median count rate of data. |
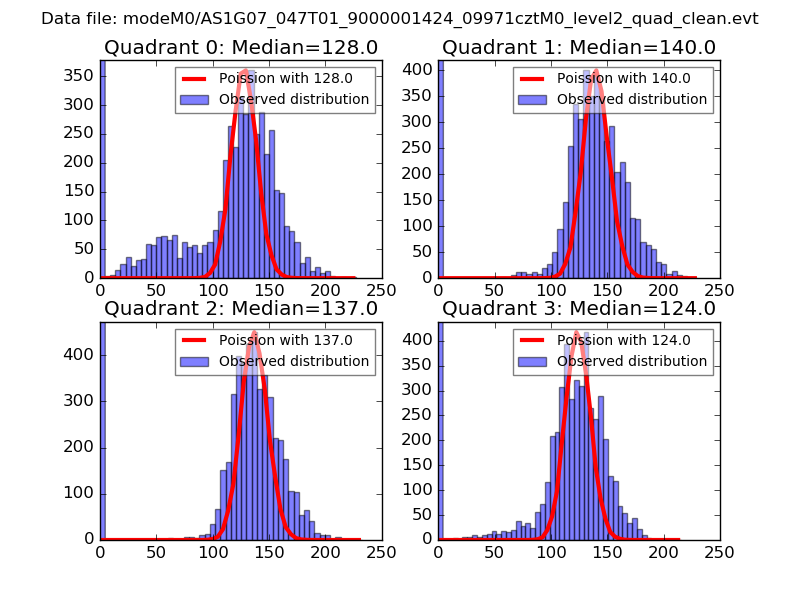 |
 |
| Quadrant-wise count rates Data is divided into 100 sec bins |
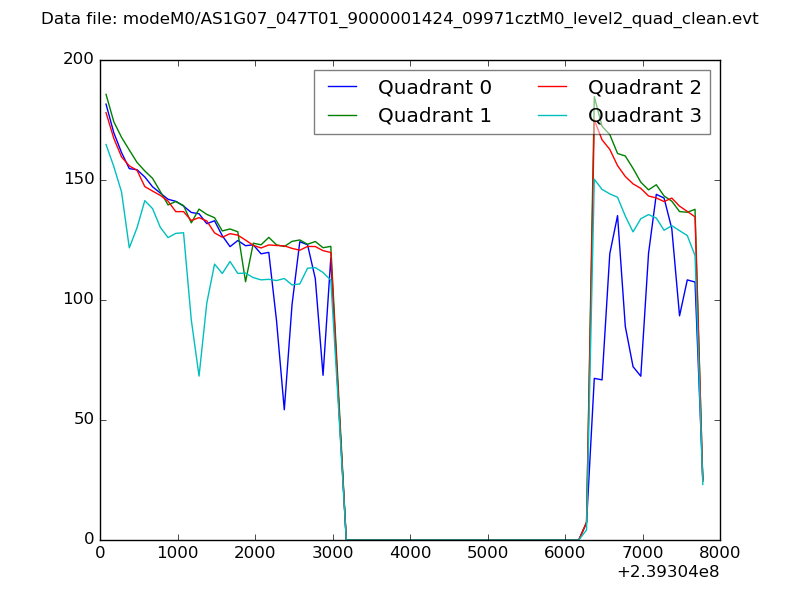 |
|
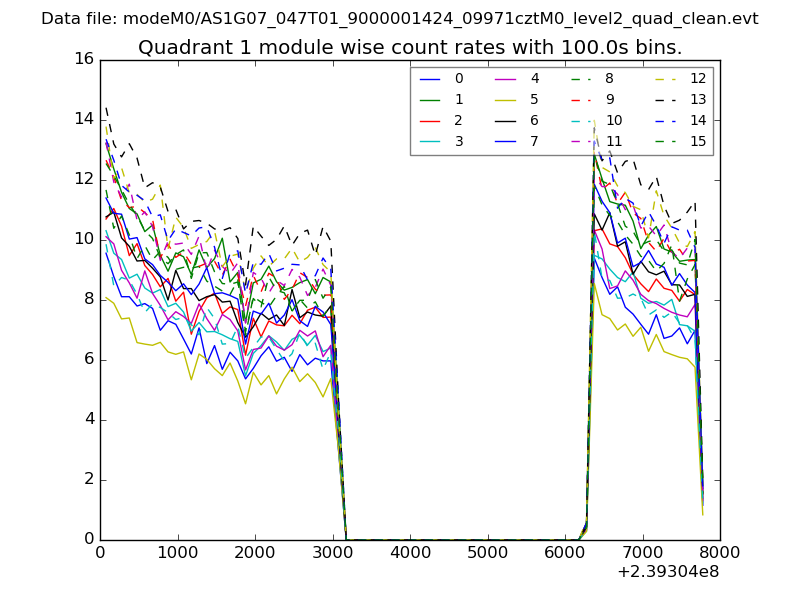
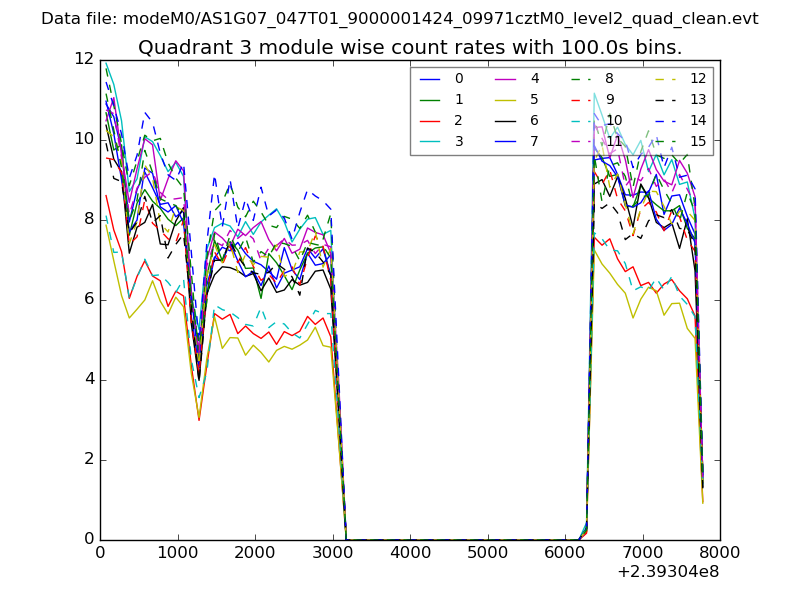
| Module-wise count rates for Quadrant A Data is divided into 100 sec bins |
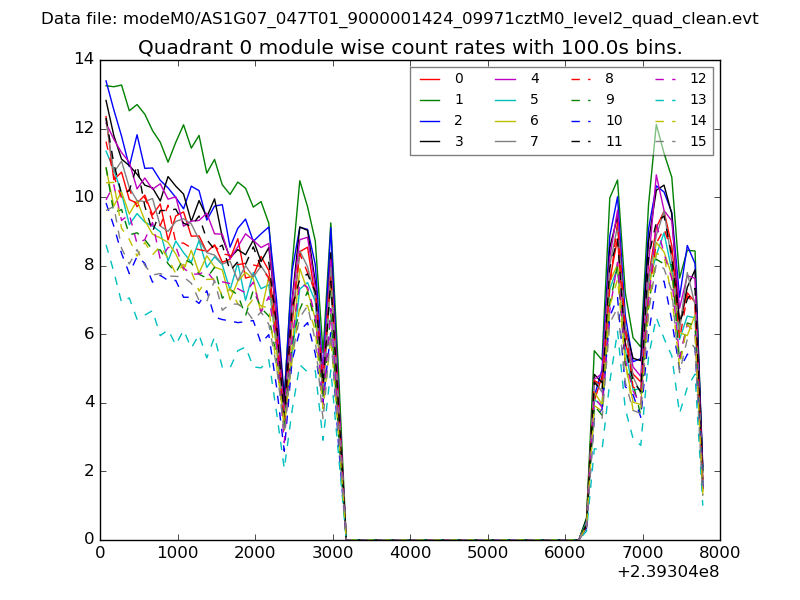 |
 |
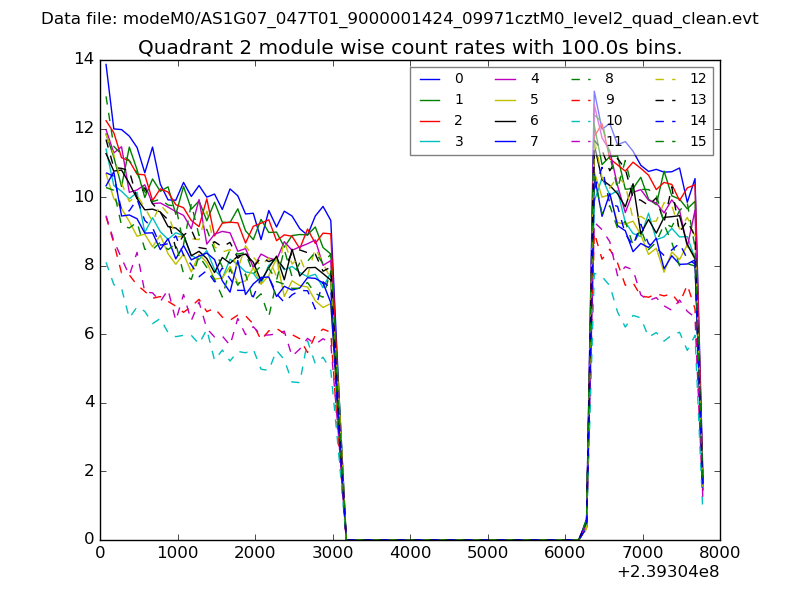
| Module-wise count rates for Quadrant B Data is divided into 100 sec bins |
 |
 |
| Module-wise count rates for Quadrant C Data is divided into 100 sec bins |
 |
 |
| Module-wise count rates for Quadrant D Data is divided into 100 sec bins |
 |
 |
| Parameter | Plot |
|---|---|
| CZT HV Monitor | 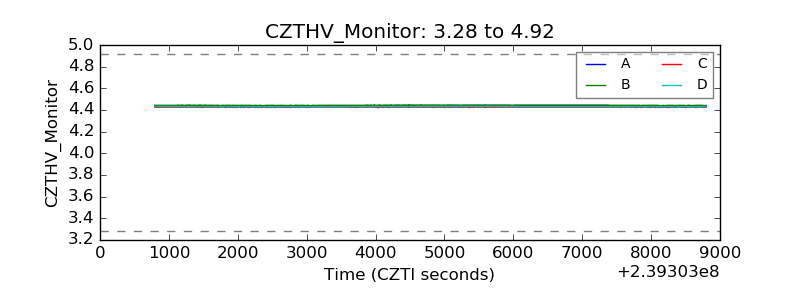 |
| D_VDD | 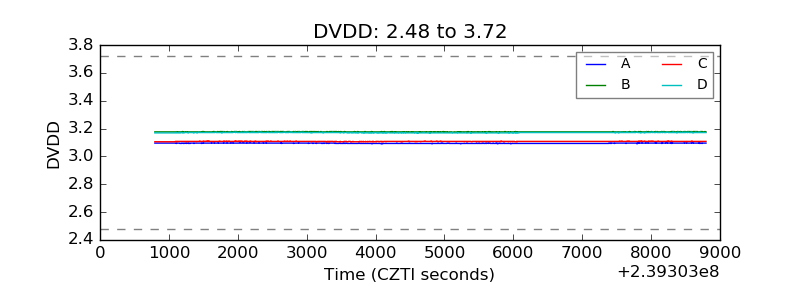 |
| Temperature 1 | 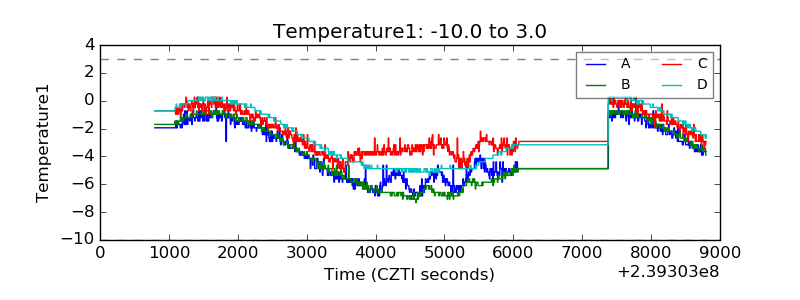 |
| Veto HV Monitor | 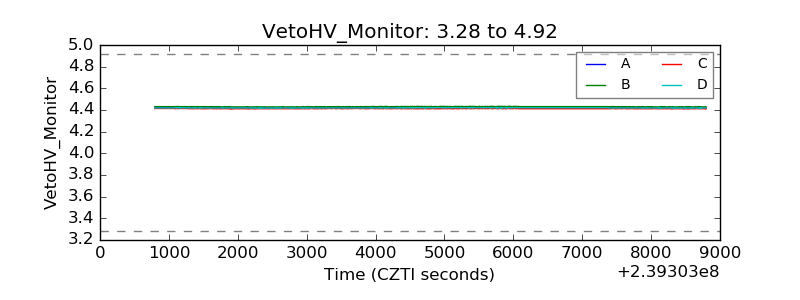 |
| Veto LLD | 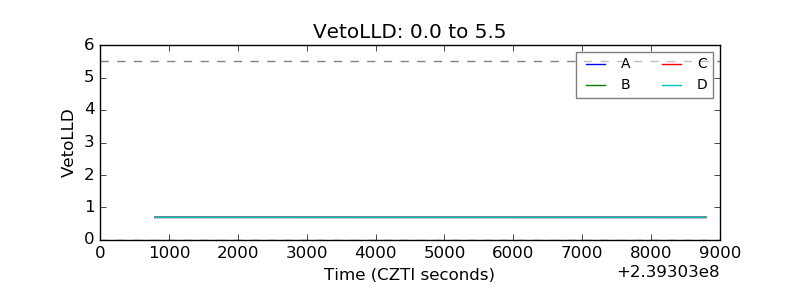 |
| Alpha Counter | 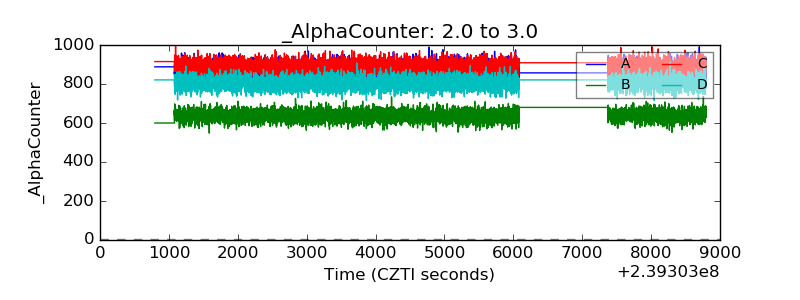 |
| _CPM_Rate | 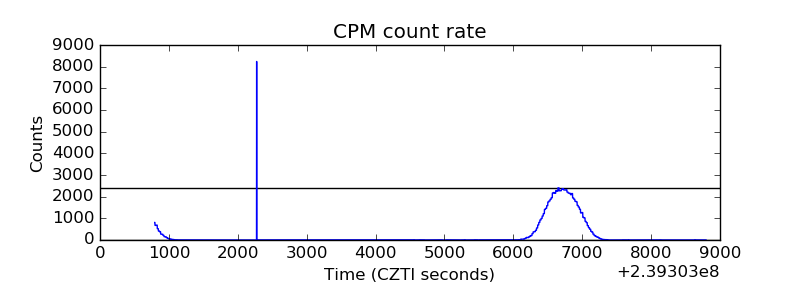 |
| CZT Counter | 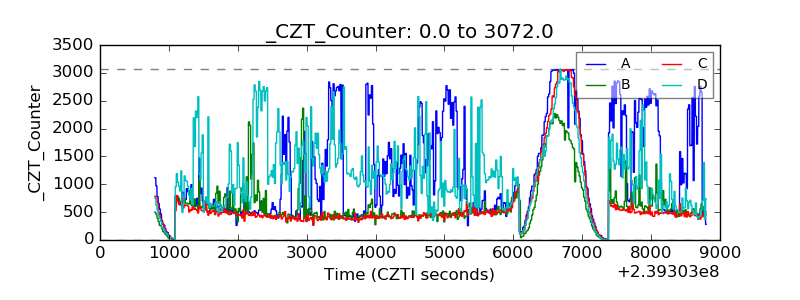 |
| +2.5 Volts monitor | 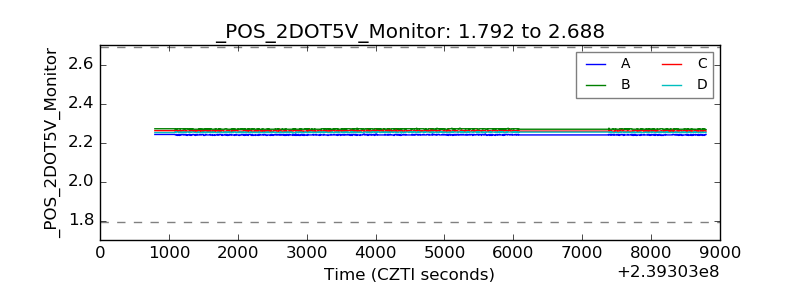 |
| +5 Volts monitor | 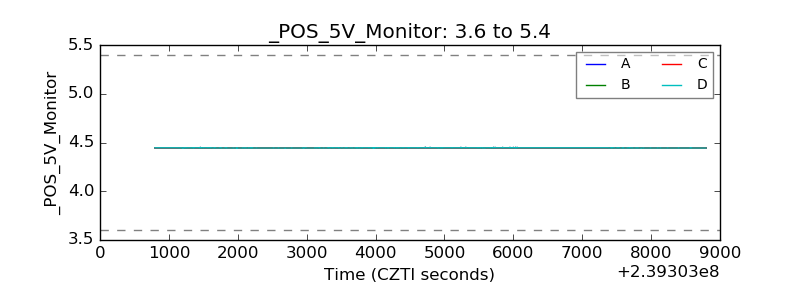 |
| _ROLL_ROT | 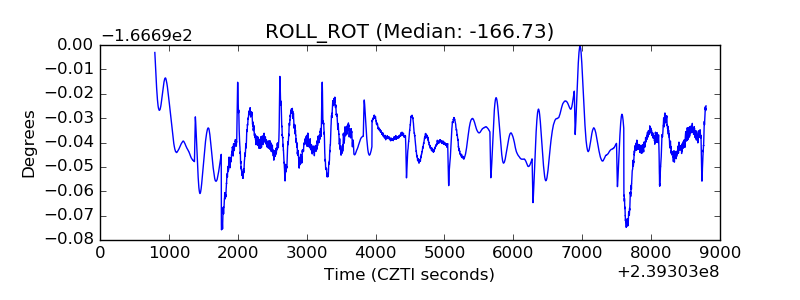 |
| _Roll_DEC | 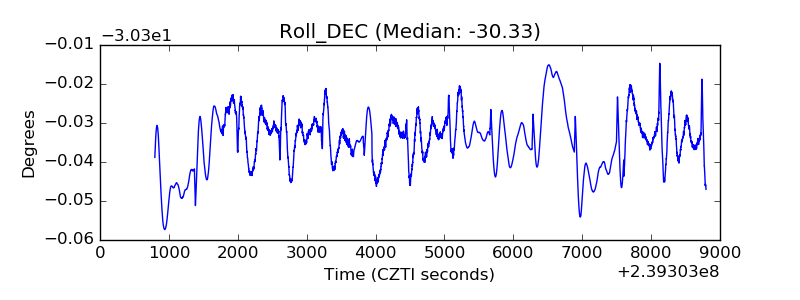 |
| _Roll_RA | 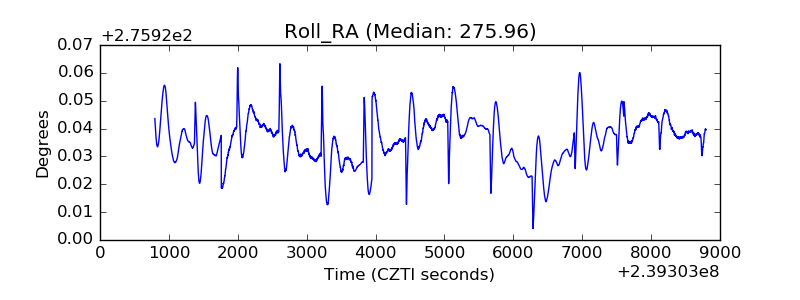 |
| Veto Counter | 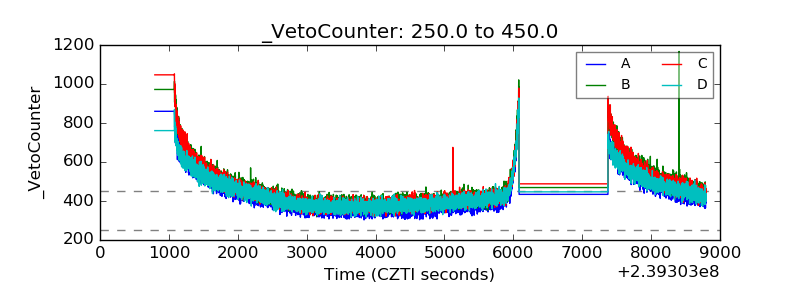 |