| Param | Original file | Final file |
|---|---|---|
| Filename | modeM0/AS1G07_047T01_9000001424_09973cztM0_level2.evt | modeM0/AS1G07_047T01_9000001424_09973cztM0_level2_quad_clean.evt |
| Size (bytes) | 557,861,760 | 86,506,560 |
| Size | 532.0 MB | 82.5 MB |
| Events in quadrant A | 5,228,998 | 536,400 |
| Events in quadrant B | 3,111,736 | 572,836 |
| Events in quadrant C | 2,887,388 | 562,434 |
| Events in quadrant D | 5,246,926 | 515,158 |
| Mode M0 | |||
|---|---|---|---|
| Quadrant | BADHDUFLAG | Total packets | Discarded packets |
| A | 0 | 19728 | 41 |
| B | 0 | 13287 | 19 |
| C | 0 | 12804 | 4 |
| D | 0 | 19706 | 20 |
| Mode SS | |||
|---|---|---|---|
| Quadrant | BADHDUFLAG | Total packets | Discarded packets |
| A | 0 | 128 | 0 |
| B | 0 | 128 | 0 |
| C | 0 | 128 | 0 |
| D | 0 | 128 | 0 |
| Mode M9 | |||
|---|---|---|---|
| Quadrant | BADHDUFLAG | Total packets | Discarded packets |
| A | 0 | 21 | 0 |
| B | 0 | 21 | 0 |
| C | 0 | 21 | 0 |
| D | 0 | 22 | 0 |
| Quadrant | Total seconds | Saturated seconds | Saturation percentage |
|---|---|---|---|
| A | 6186 | 733 | 11.849337% |
| B | 6188 | 71 | 1.147382% |
| C | 6194 | 20 | 0.322893% |
| D | 6191 | 205 | 3.311258% |
Noise dominated data is calculated using 1-second bins in cleaned event files. If a bin has >2000 counts, and if more than 50% of those come from <1% of pixels, then it is considered to be noise-dominated and hence unusable.
| Quadrant | # 1 sec bins | Bins with >0 counts | Bins with >2000 counts | High rate bins dominated by noise | Noise dominated (total time) | Noise dominated (detector-on time) | Marked lightcurve |
|---|---|---|---|---|---|---|---|
| A | 7550 | 6193 | 605 | 605 | 8.01% | 9.77% | 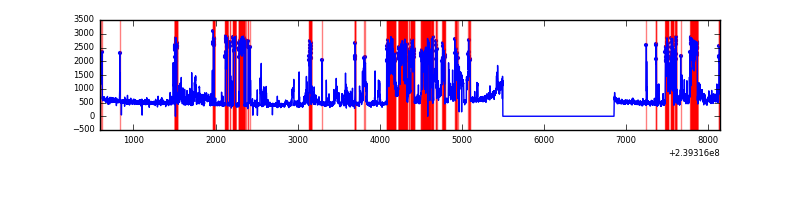 |
| B | 7550 | 6195 | 9 | 9 | 0.12% | 0.15% | 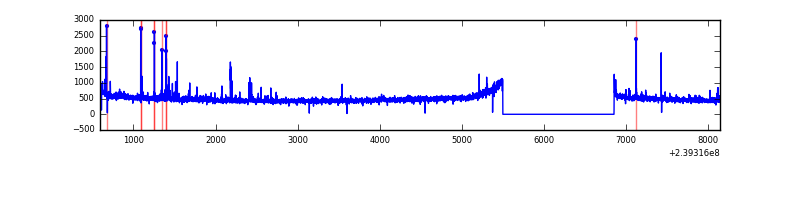 |
| C | 7550 | 6196 | 0 | 0 | 0.00% | 0.00% | 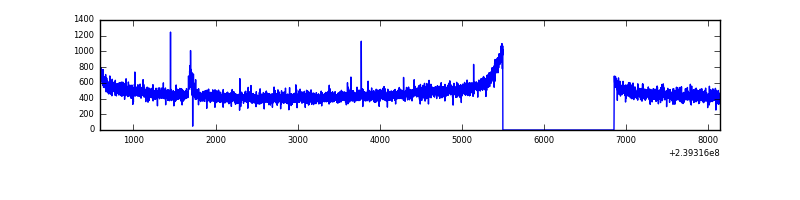 |
| D | 7550 | 6195 | 215 | 215 | 2.85% | 3.47% | 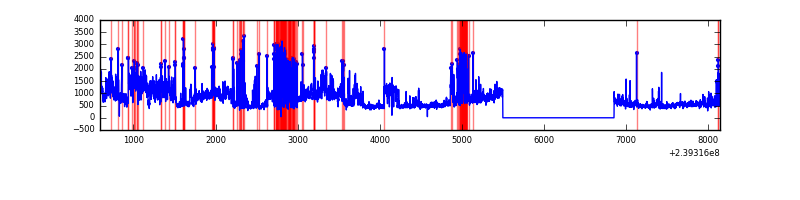 |
Top three noisy pixels from each quadrant. If the there are fewer than three noisy pixels in the level2.evt file, extra rows are filled as -1
| Pixel properties | Quadrant properties | ||||||
|---|---|---|---|---|---|---|---|
| Quadrant | DetID | PixID | Counts | Sigma | Mean | Median | Sigma |
| A | 13 | 251 | 2397948 | 16026.85 | 730 | 716 | 149.6 |
| A | 15 | 174 | 23815 | 154.43 | 730 | 716 | 149.6 |
| A | 0 | 226 | 6978 | 41.87 | 730 | 716 | 149.6 |
| B | 4 | 239 | 62605 | 427.36 | 766 | 751 | 144.7 |
| B | 0 | 187 | 17530 | 115.93 | 766 | 751 | 144.7 |
| B | 0 | 214 | 14442 | 94.59 | 766 | 751 | 144.7 |
| C | 8 | 208 | 14288 | 79.69 | 734 | 739 | 170.0 |
| C | 14 | 67 | 8198 | 43.87 | 734 | 739 | 170.0 |
| C | 13 | 61 | 5539 | 28.23 | 734 | 739 | 170.0 |
| D | 1 | 52 | 1384483 | 7392.52 | 711 | 694 | 187.2 |
| D | 2 | 16 | 566876 | 3024.68 | 711 | 694 | 187.2 |
| D | 8 | 195 | 289228 | 1541.42 | 711 | 694 | 187.2 |
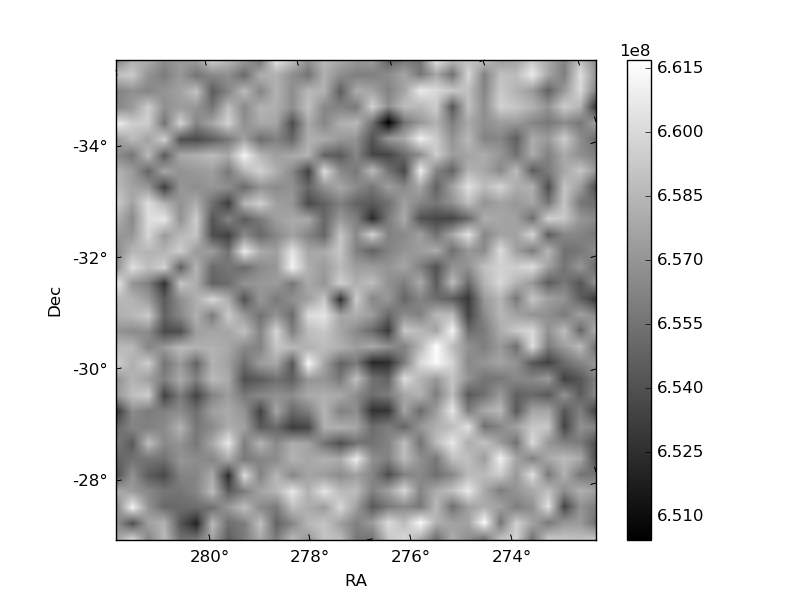
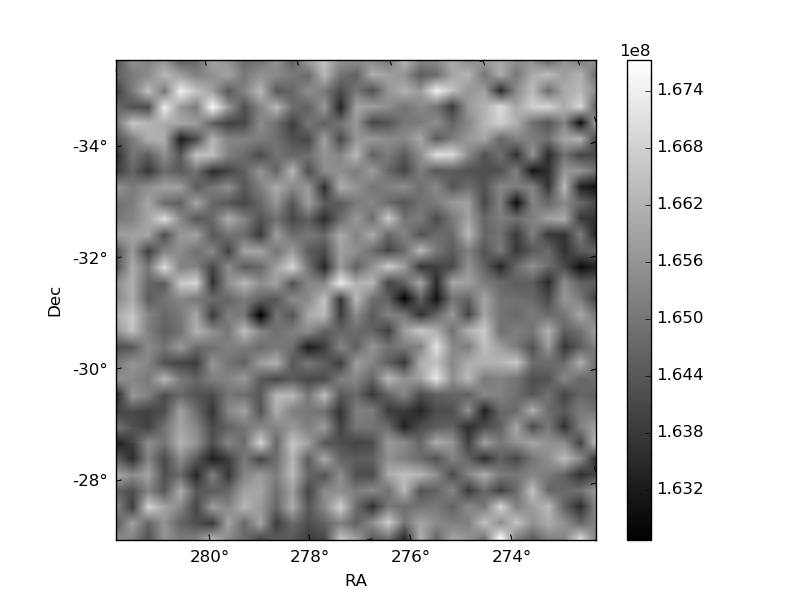
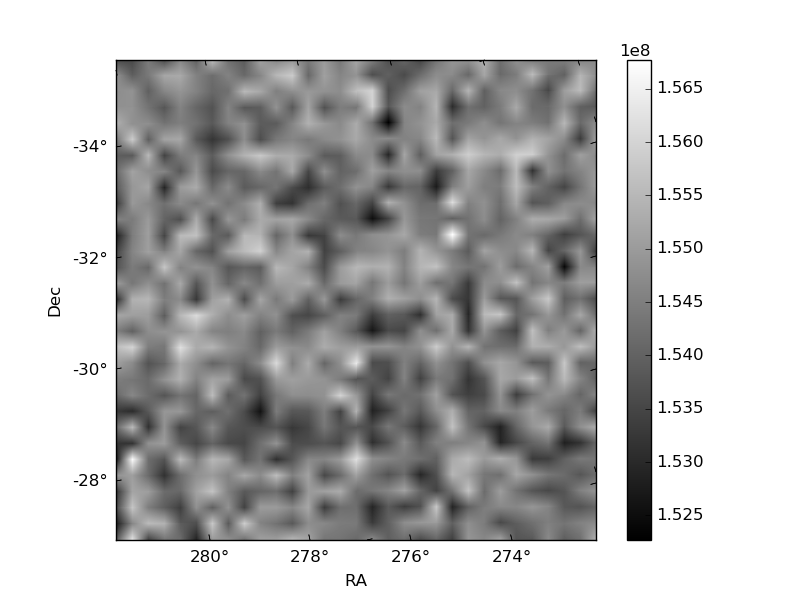
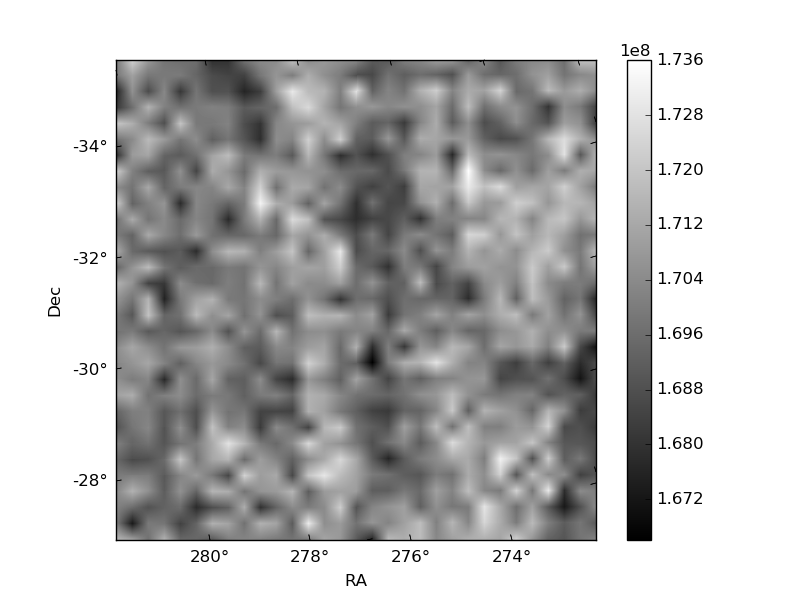
Histogram calculated using DETX and DETY for each event in the final _common_clean file
| Quadrant A | 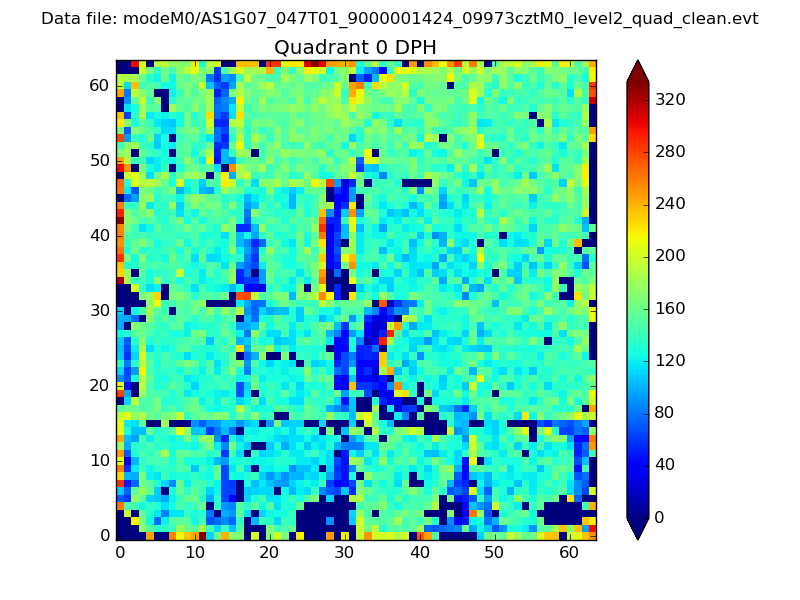 |
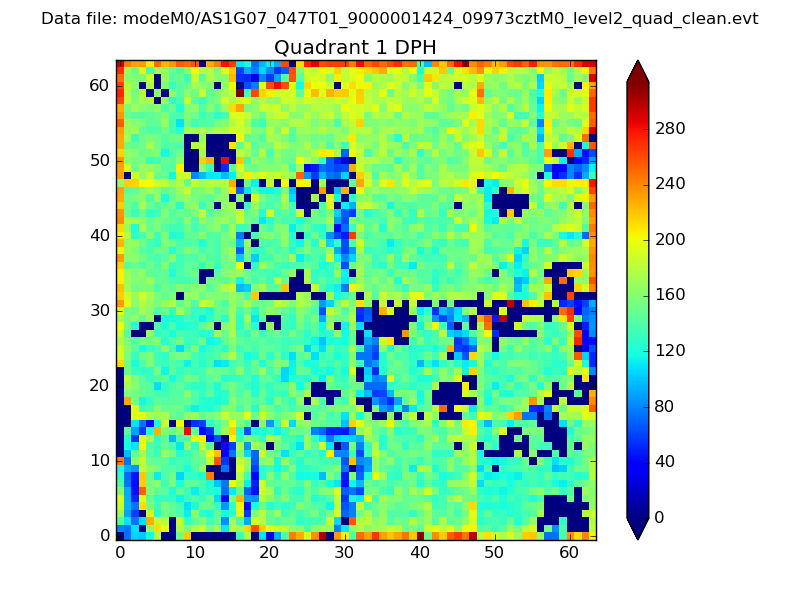 |
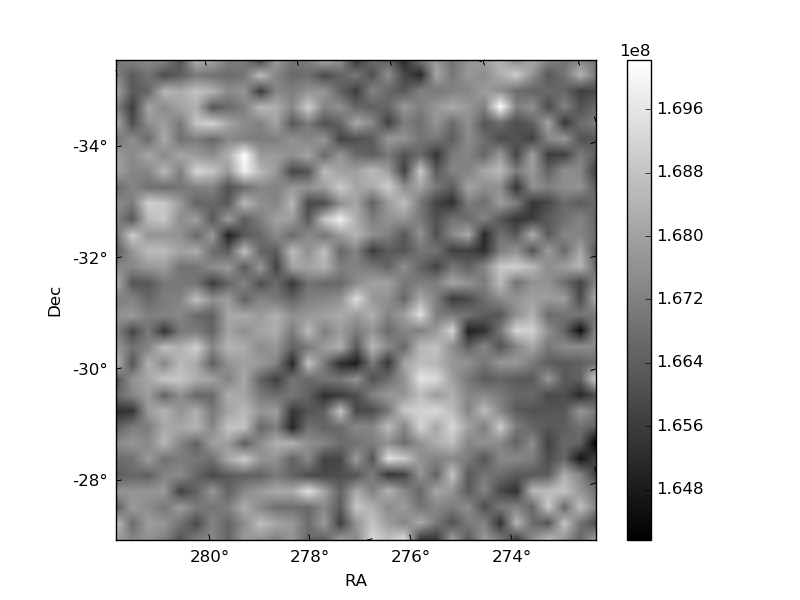
Quadrant B |
|---|---|---|---|
| Quadrant D | 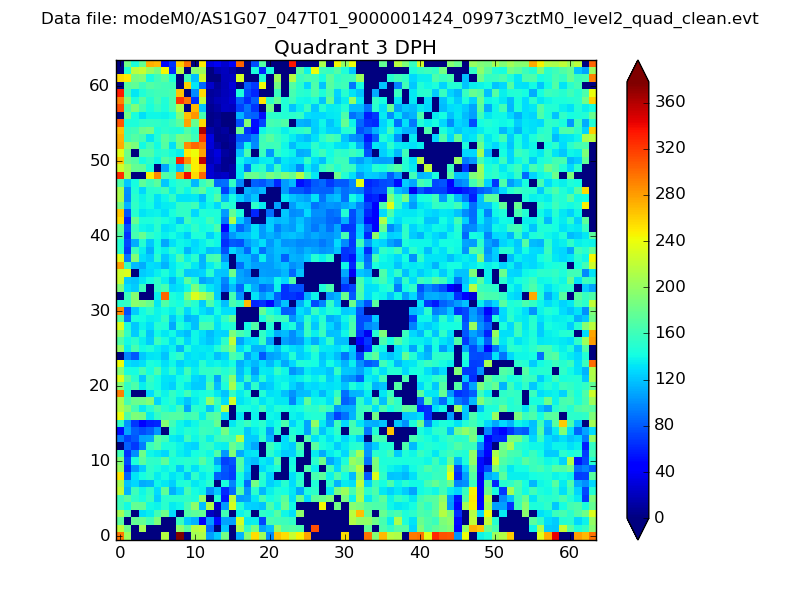 |
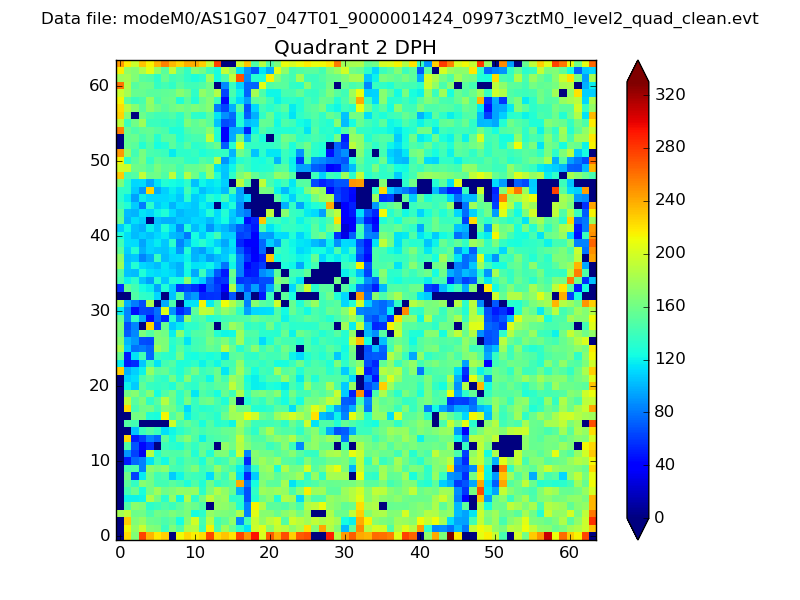 |
Quadrant C |
| Plot type | Count rate plots | Images |
|---|---|---|
| Comparison with Poisson distribution Blue bars denote a histogram of data divided into 1 sec bins. Red curve is a Poisson curve with rate = median count rate of data. |
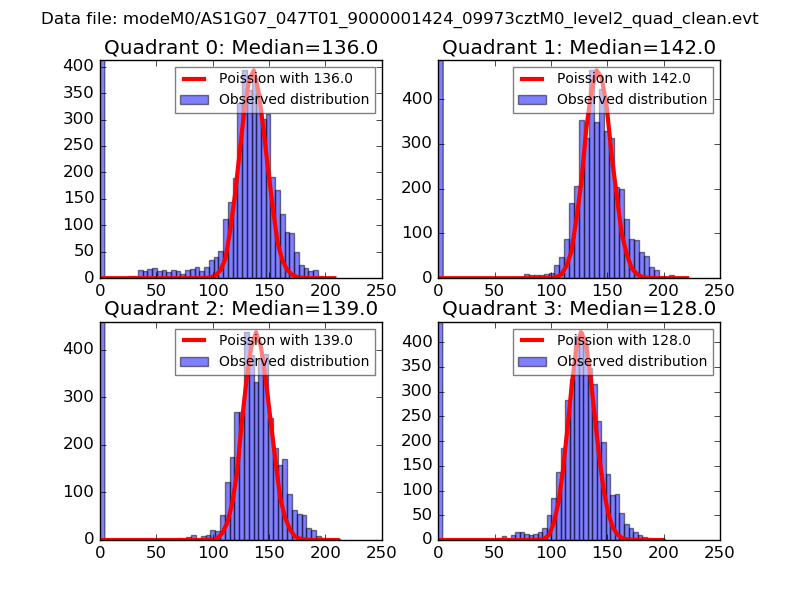 |
 |
| Quadrant-wise count rates Data is divided into 100 sec bins |
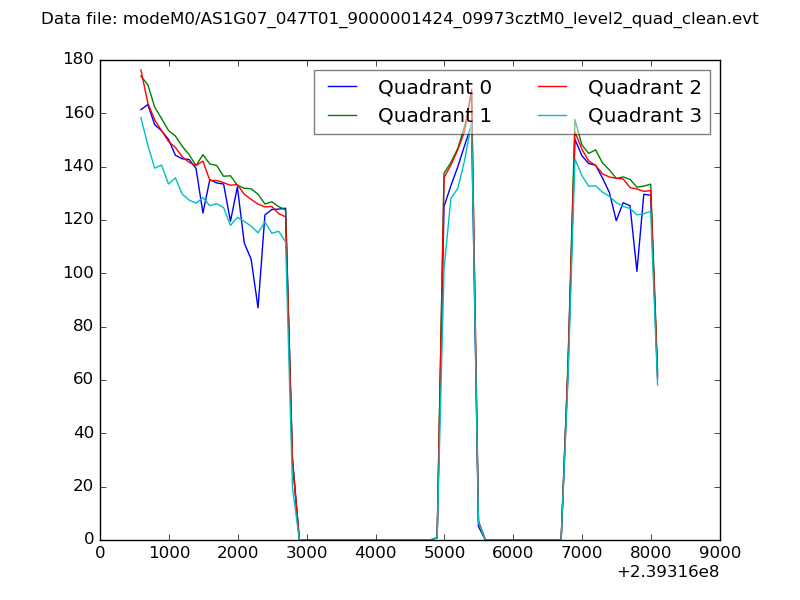 |
|
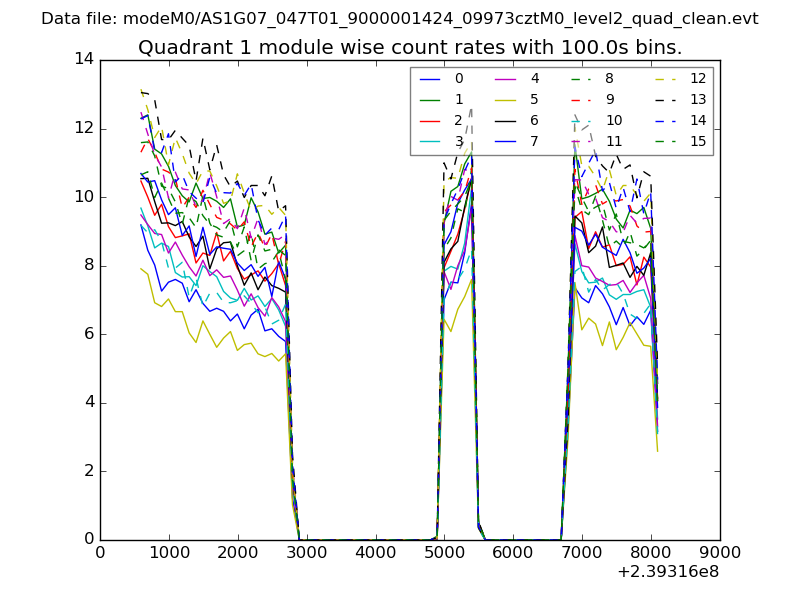
| Module-wise count rates for Quadrant A Data is divided into 100 sec bins |
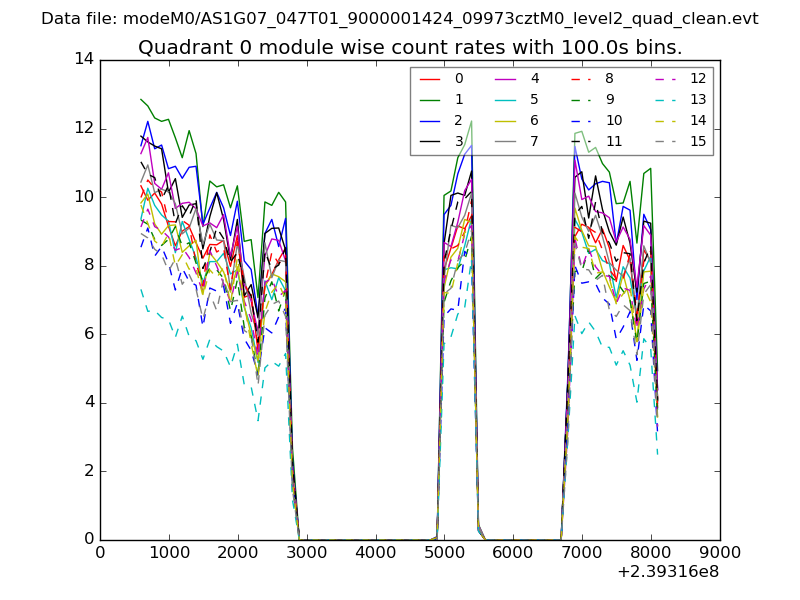 |
 |
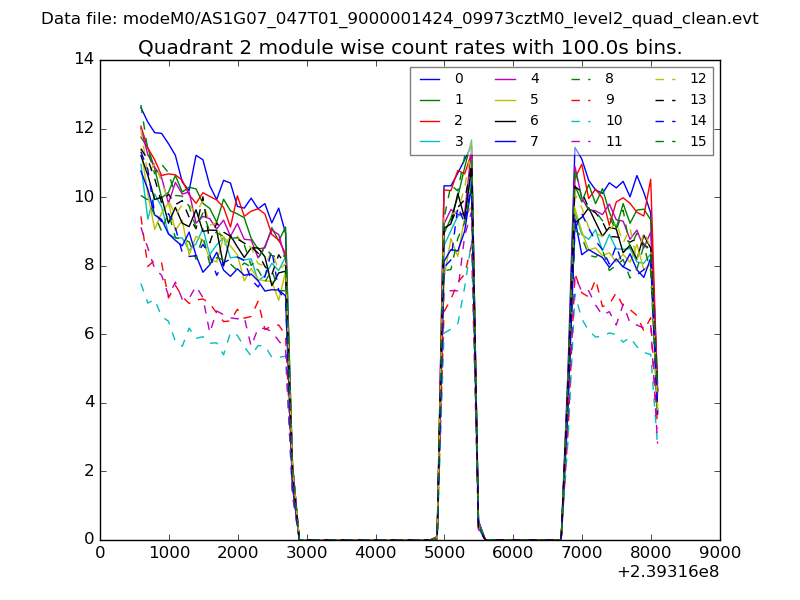
| Module-wise count rates for Quadrant B Data is divided into 100 sec bins |
 |
 |
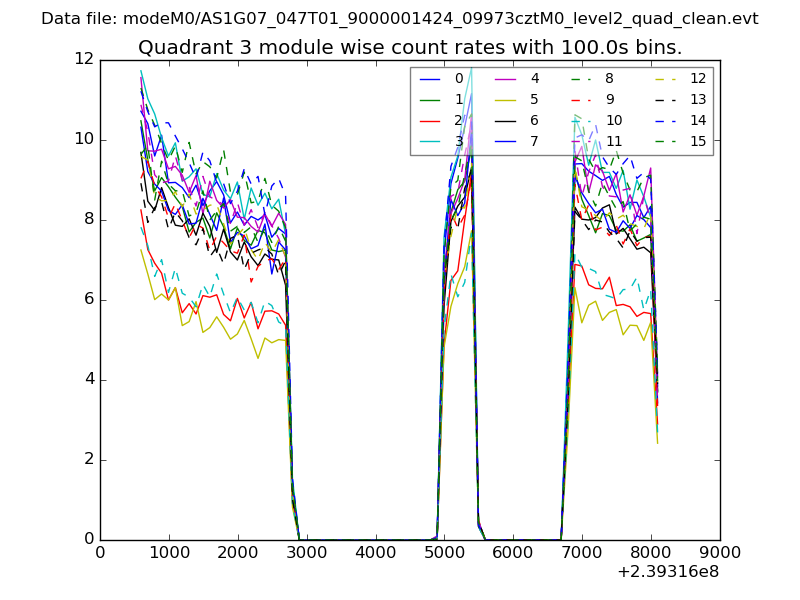
| Module-wise count rates for Quadrant C Data is divided into 100 sec bins |
 |
 |
| Module-wise count rates for Quadrant D Data is divided into 100 sec bins |
 |
 |
| Parameter | Plot |
|---|---|
| CZT HV Monitor | 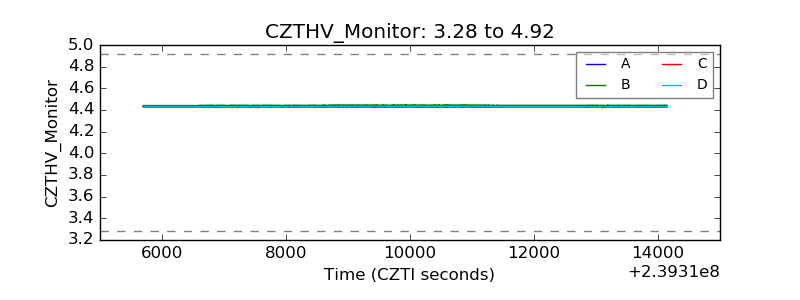 |
| D_VDD | 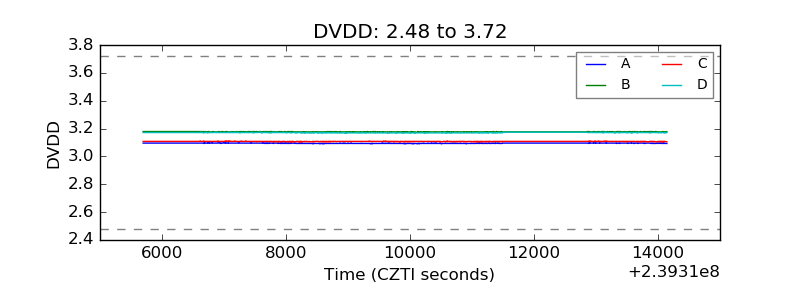 |
| Temperature 1 | 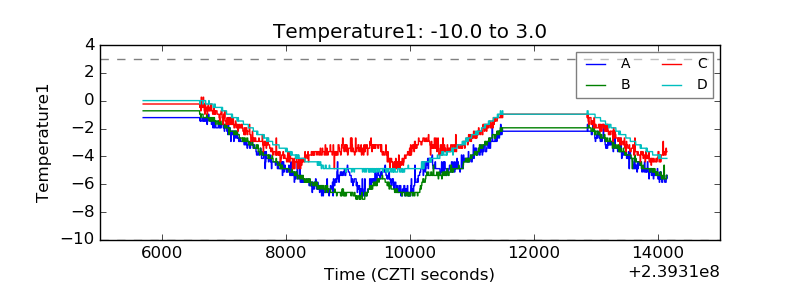 |
| Veto HV Monitor | 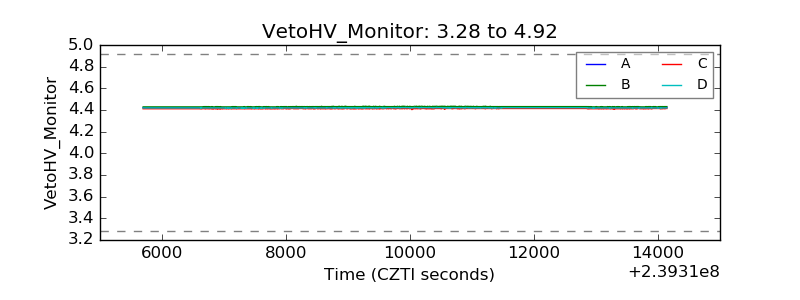 |
| Veto LLD | 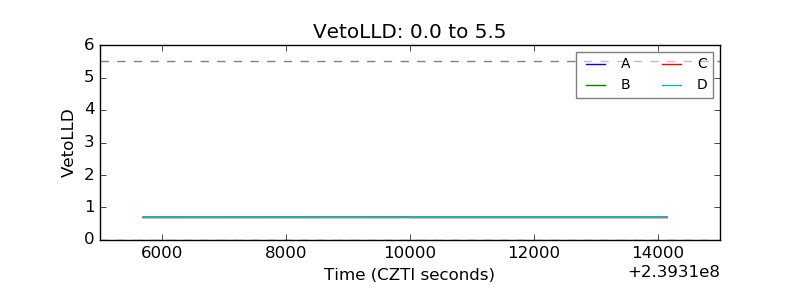 |
| Alpha Counter | 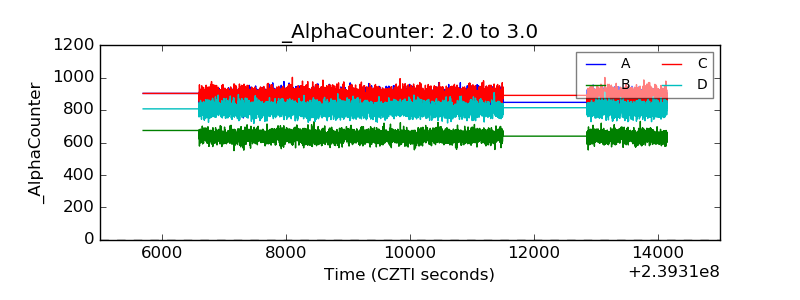 |
| _CPM_Rate | 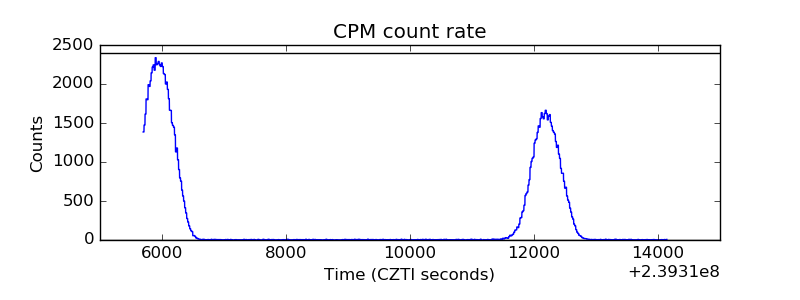 |
| CZT Counter | 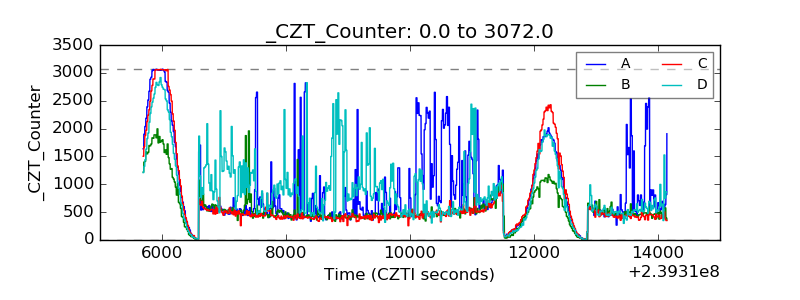 |
| +2.5 Volts monitor | 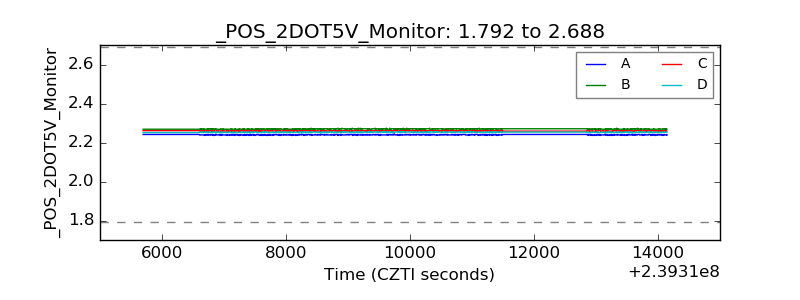 |
| +5 Volts monitor | 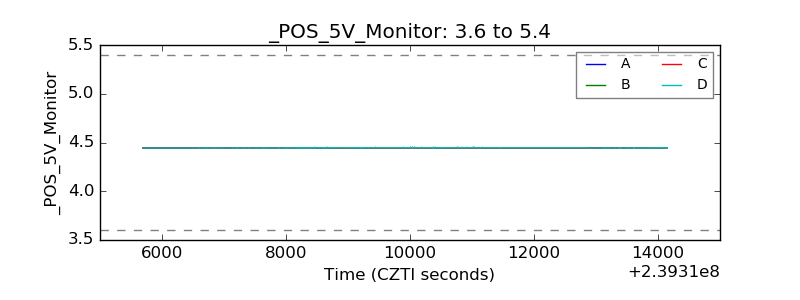 |
| _ROLL_ROT | 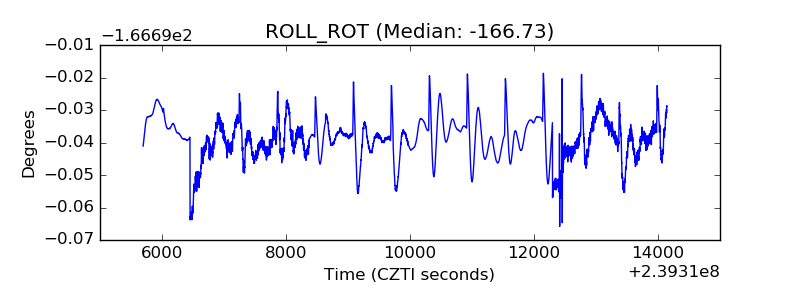 |
| _Roll_DEC | 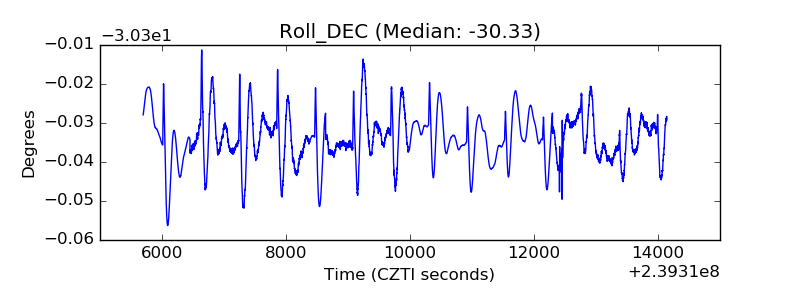 |
| _Roll_RA | 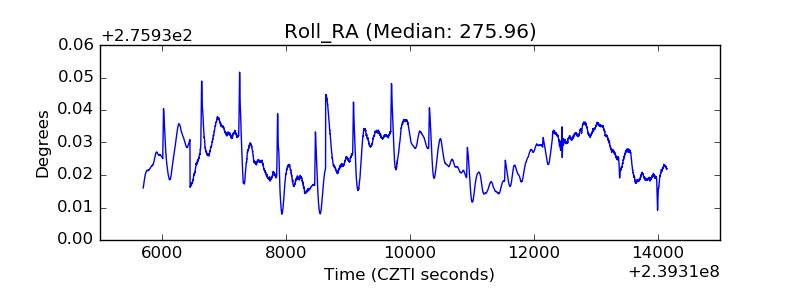 |
| Veto Counter | 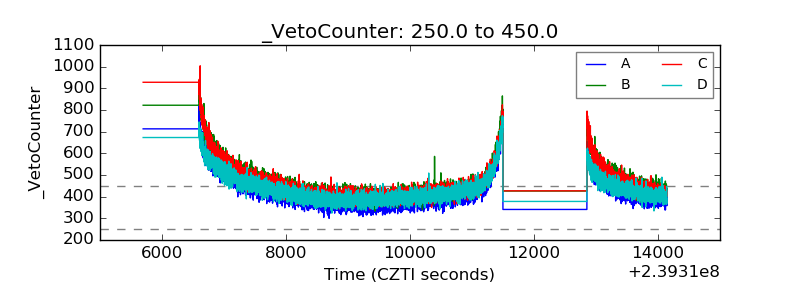 |