| Param | Original file | Final file |
|---|---|---|
| Filename | modeM0/AS1G07_047T01_9000001424_09974cztM0_level2.evt | modeM0/AS1G07_047T01_9000001424_09974cztM0_level2_quad_clean.evt |
| Size (bytes) | 520,030,080 | 85,944,960 |
| Size | 495.9 MB | 82.0 MB |
| Events in quadrant A | 5,364,390 | 529,562 |
| Events in quadrant B | 3,172,980 | 560,664 |
| Events in quadrant C | 2,852,223 | 553,667 |
| Events in quadrant D | 3,930,896 | 517,588 |
| Mode M0 | |||
|---|---|---|---|
| Quadrant | BADHDUFLAG | Total packets | Discarded packets |
| A | 0 | 20257 | 31 |
| B | 0 | 13737 | 10 |
| C | 0 | 12942 | 6 |
| D | 0 | 15907 | 36 |
| Mode SS | |||
|---|---|---|---|
| Quadrant | BADHDUFLAG | Total packets | Discarded packets |
| A | 0 | 130 | 0 |
| B | 0 | 130 | 2 |
| C | 0 | 130 | 0 |
| D | 0 | 130 | 0 |
| Mode M9 | |||
|---|---|---|---|
| Quadrant | BADHDUFLAG | Total packets | Discarded packets |
| A | 0 | 23 | 0 |
| B | 0 | 23 | 0 |
| C | 0 | 23 | 0 |
| D | 0 | 24 | 0 |
| Quadrant | Total seconds | Saturated seconds | Saturation percentage |
|---|---|---|---|
| A | 6315 | 639 | 10.118765% |
| B | 6318 | 43 | 0.680595% |
| C | 6320 | 8 | 0.126582% |
| D | 6314 | 100 | 1.583782% |
Noise dominated data is calculated using 1-second bins in cleaned event files. If a bin has >2000 counts, and if more than 50% of those come from <1% of pixels, then it is considered to be noise-dominated and hence unusable.
| Quadrant | # 1 sec bins | Bins with >0 counts | Bins with >2000 counts | High rate bins dominated by noise | Noise dominated (total time) | Noise dominated (detector-on time) | Marked lightcurve |
|---|---|---|---|---|---|---|---|
| A | 7542 | 6322 | 512 | 512 | 6.79% | 8.10% | 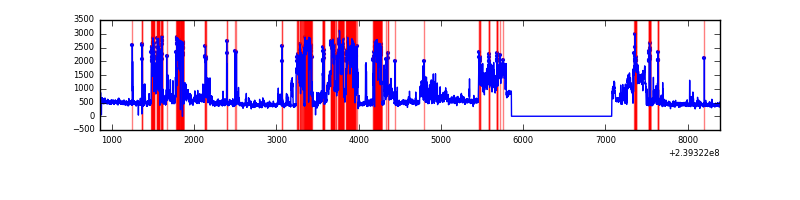 |
| B | 7542 | 6323 | 8 | 8 | 0.11% | 0.13% | 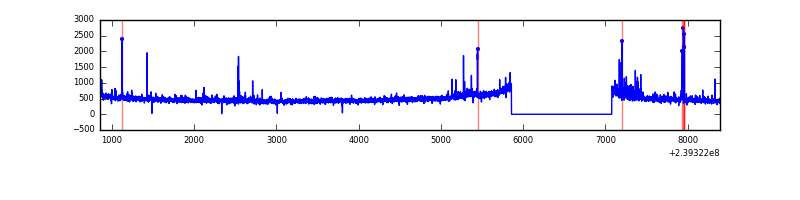 |
| C | 7542 | 6323 | 0 | 0 | 0.00% | 0.00% | 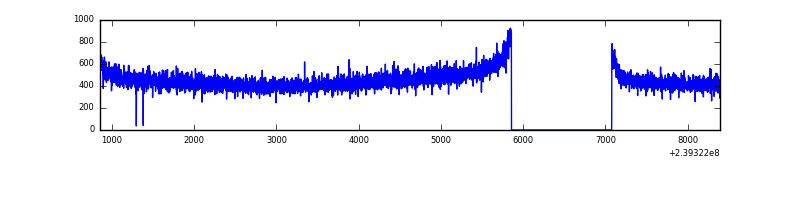 |
| D | 7542 | 6320 | 113 | 113 | 1.50% | 1.79% | 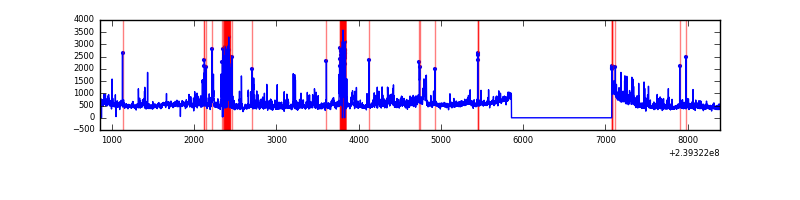 |
Top three noisy pixels from each quadrant. If the there are fewer than three noisy pixels in the level2.evt file, extra rows are filled as -1
| Pixel properties | Quadrant properties | ||||||
|---|---|---|---|---|---|---|---|
| Quadrant | DetID | PixID | Counts | Sigma | Mean | Median | Sigma |
| A | 13 | 251 | 2523247 | 16862.98 | 730 | 715 | 149.6 |
| A | 15 | 174 | 30289 | 197.7 | 730 | 715 | 149.6 |
| A | 0 | 226 | 6668 | 39.8 | 730 | 715 | 149.6 |
| B | 0 | 85 | 72635 | 489.26 | 762 | 746 | 146.9 |
| B | 0 | 187 | 35947 | 239.57 | 762 | 746 | 146.9 |
| B | 0 | 214 | 30253 | 200.82 | 762 | 746 | 146.9 |
| C | 13 | 61 | 5495 | 28.13 | 729 | 732 | 169.3 |
| C | 14 | 67 | 4146 | 20.16 | 729 | 732 | 169.3 |
| C | 8 | 222 | 3162 | 14.35 | 729 | 732 | 169.3 |
| D | 1 | 52 | 676906 | 3687.51 | 710 | 693 | 183.4 |
| D | 8 | 195 | 132040 | 716.26 | 710 | 693 | 183.4 |
| D | 2 | 16 | 128699 | 698.04 | 710 | 693 | 183.4 |
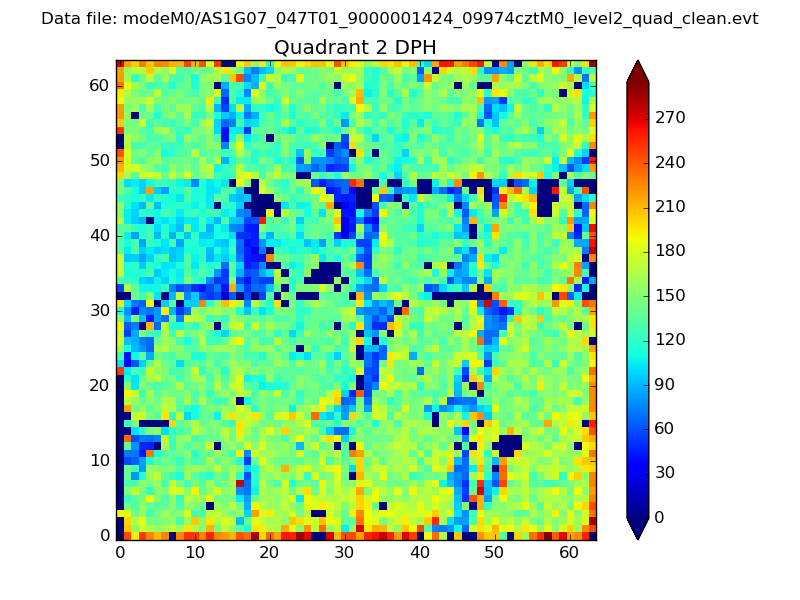
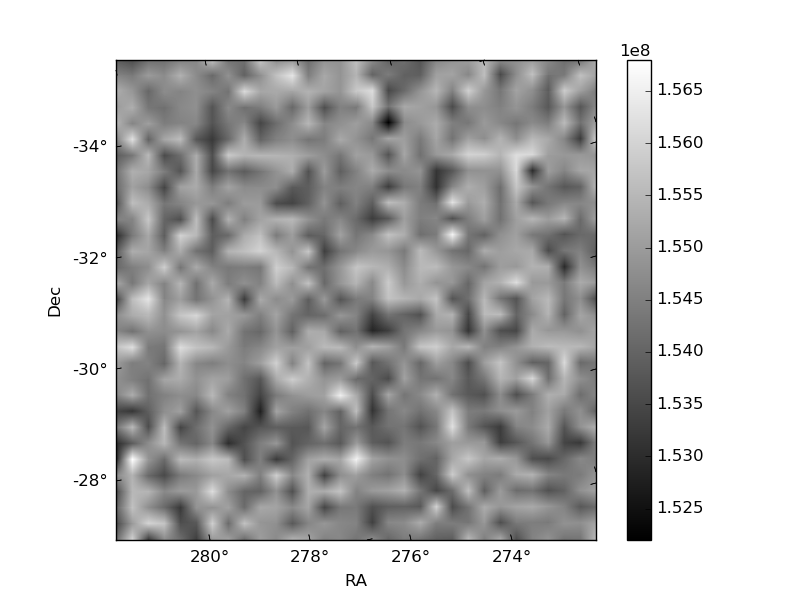
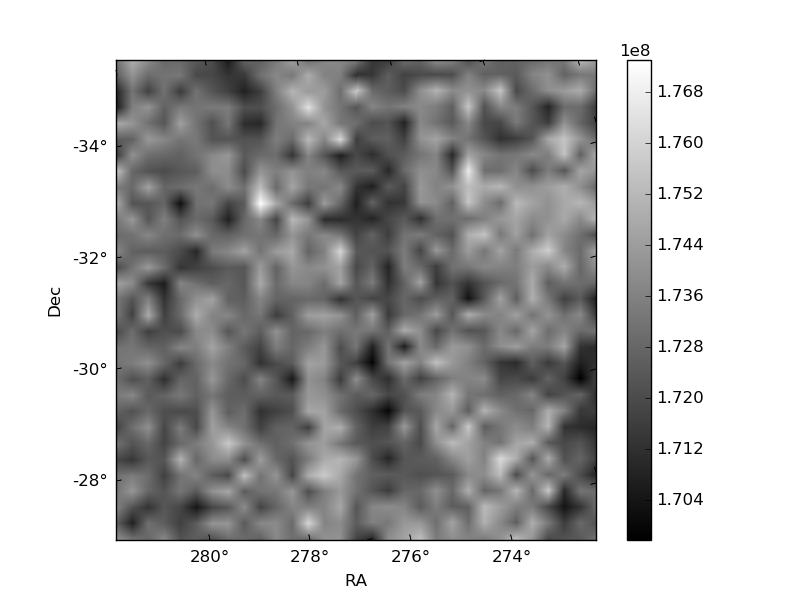
Histogram calculated using DETX and DETY for each event in the final _common_clean file
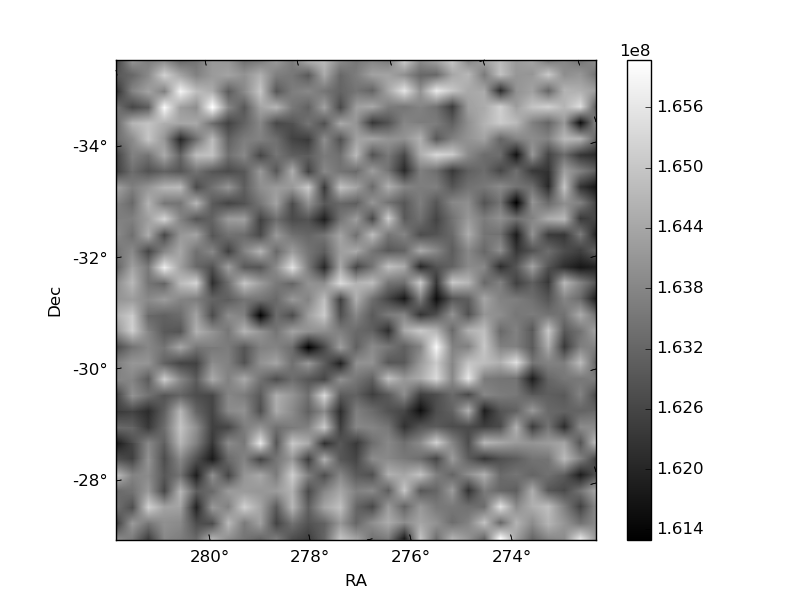
| Quadrant A |  |
 |
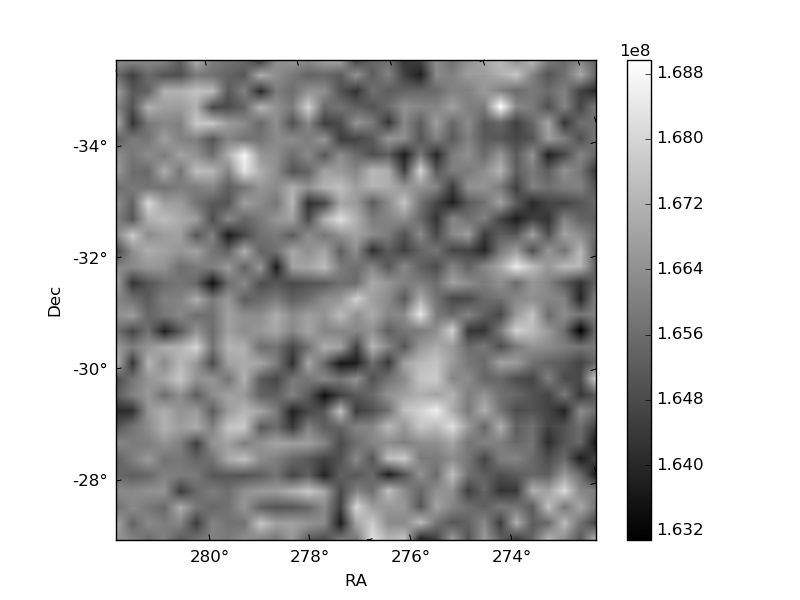
Quadrant B |
|---|---|---|---|
| Quadrant D | 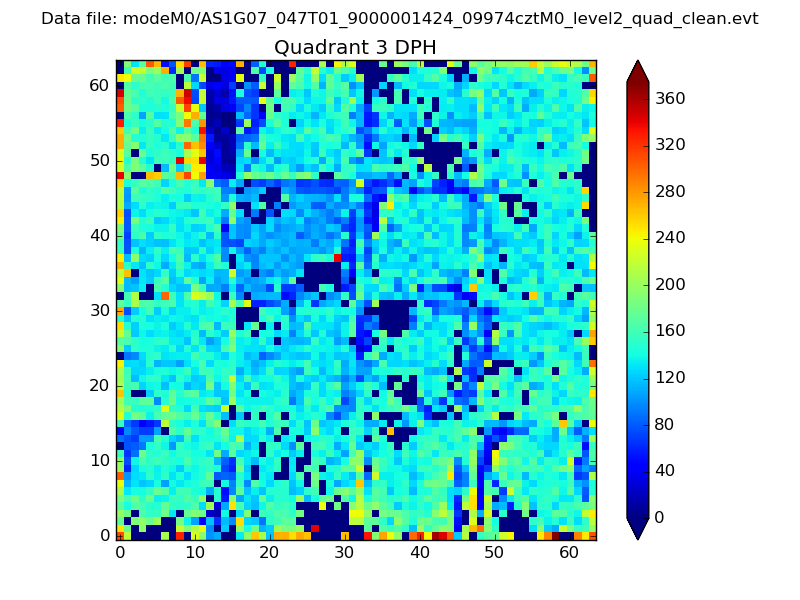 |
 |
Quadrant C |
| Plot type | Count rate plots | Images |
|---|---|---|
| Comparison with Poisson distribution Blue bars denote a histogram of data divided into 1 sec bins. Red curve is a Poisson curve with rate = median count rate of data. |
 |
 |
| Quadrant-wise count rates Data is divided into 100 sec bins |
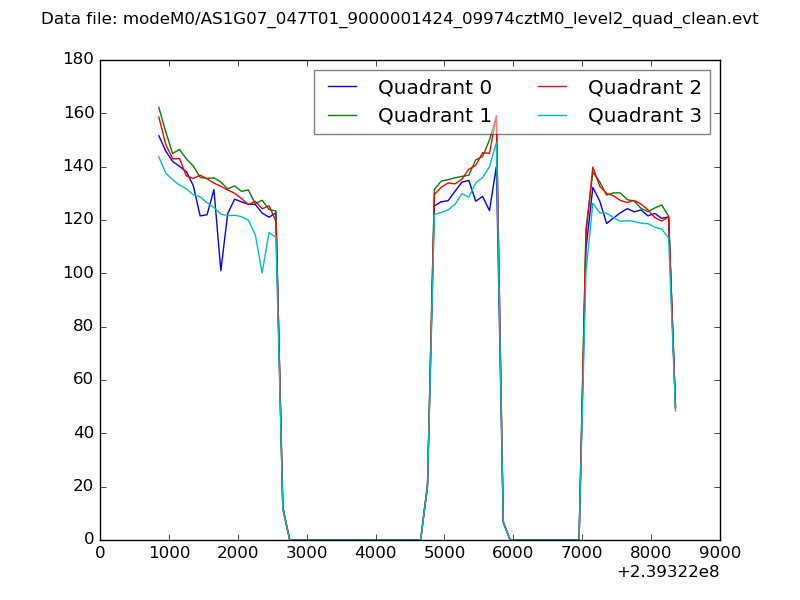 |
|
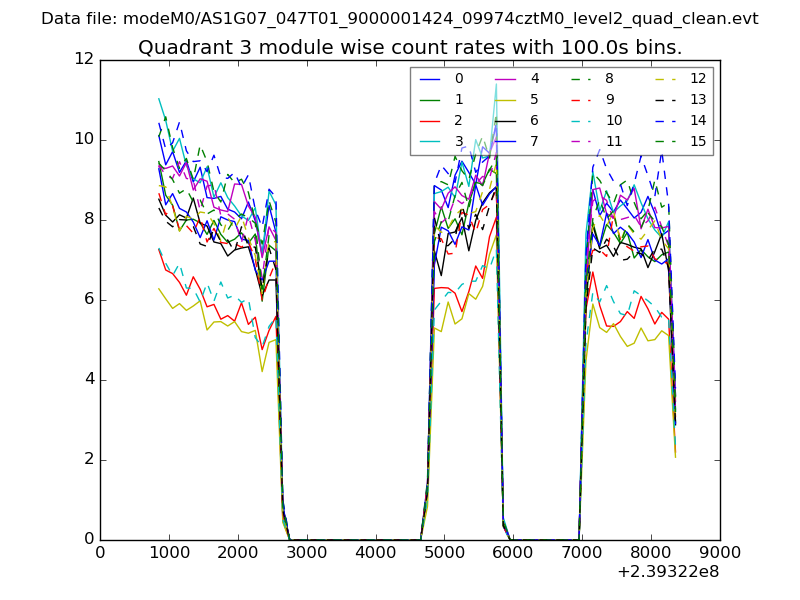
| Module-wise count rates for Quadrant A Data is divided into 100 sec bins |
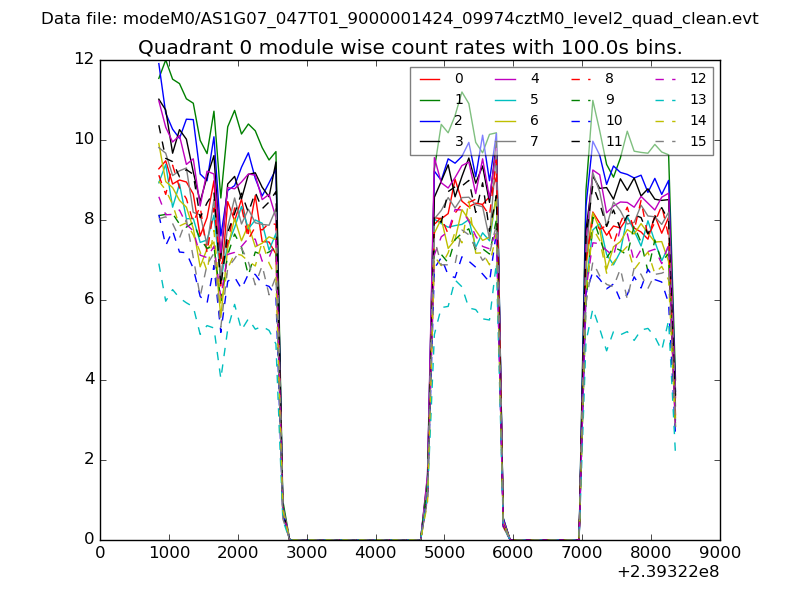 |
 |
| Module-wise count rates for Quadrant B Data is divided into 100 sec bins |
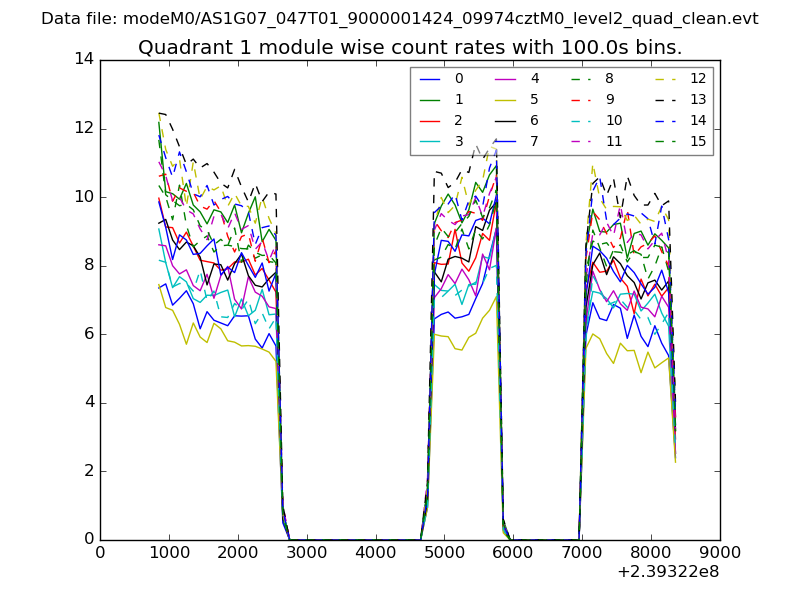 |
 |
| Module-wise count rates for Quadrant C Data is divided into 100 sec bins |
 |
 |
| Module-wise count rates for Quadrant D Data is divided into 100 sec bins |
 |
 |
| Parameter | Plot |
|---|---|
| CZT HV Monitor |  |
| D_VDD | 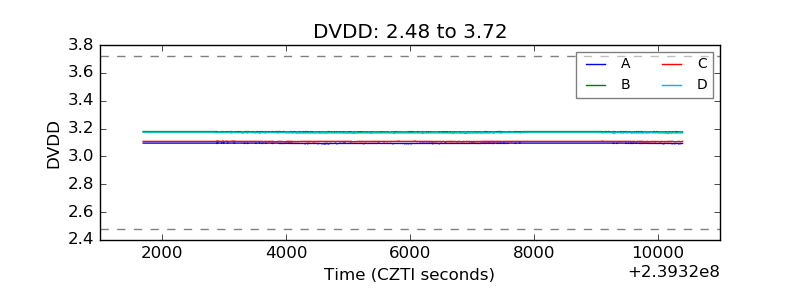 |
| Temperature 1 | 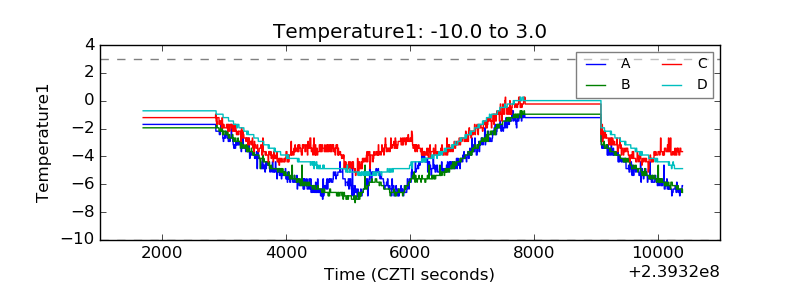 |
| Veto HV Monitor | 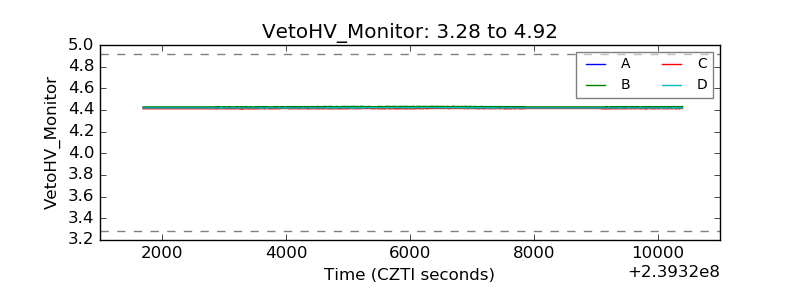 |
| Veto LLD | 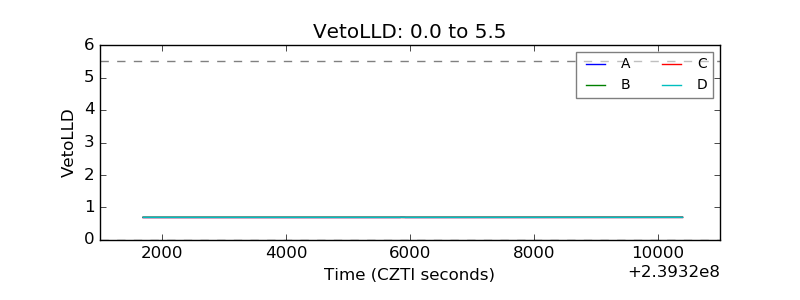 |
| Alpha Counter | 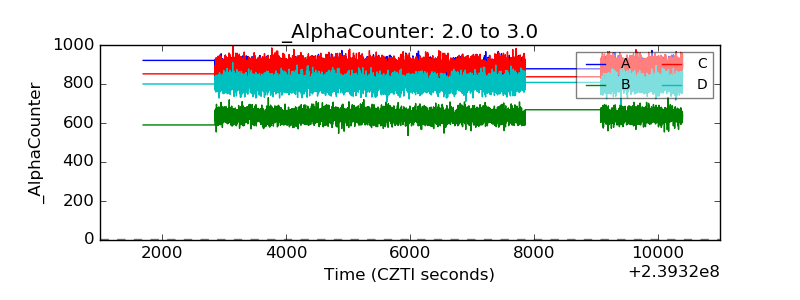 |
| _CPM_Rate | 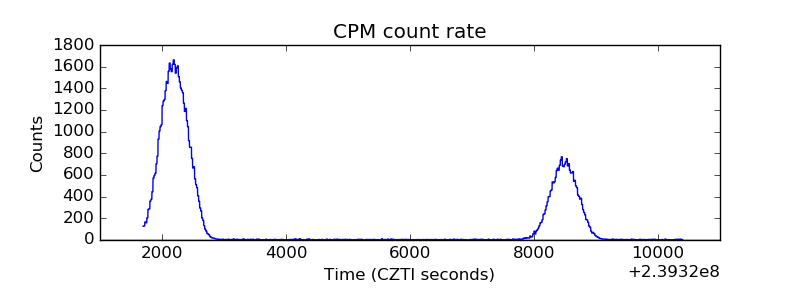 |
| CZT Counter | 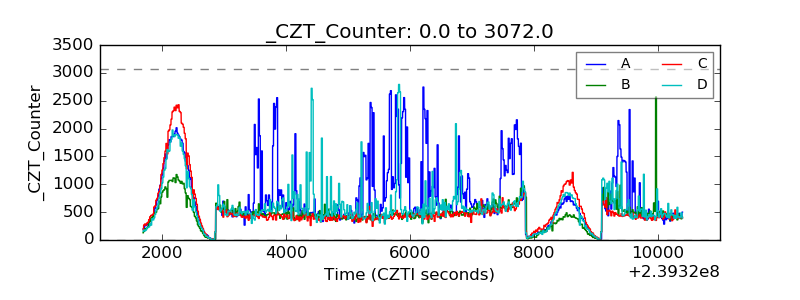 |
| +2.5 Volts monitor |  |
| +5 Volts monitor |  |
| _ROLL_ROT | 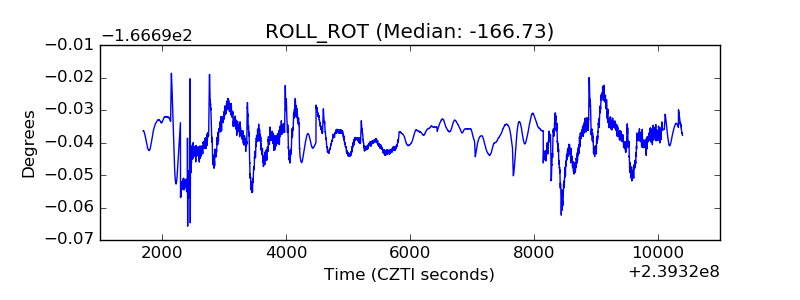 |
| _Roll_DEC | 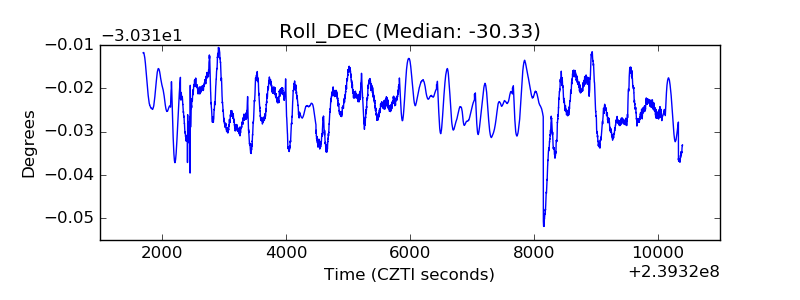 |
| _Roll_RA | 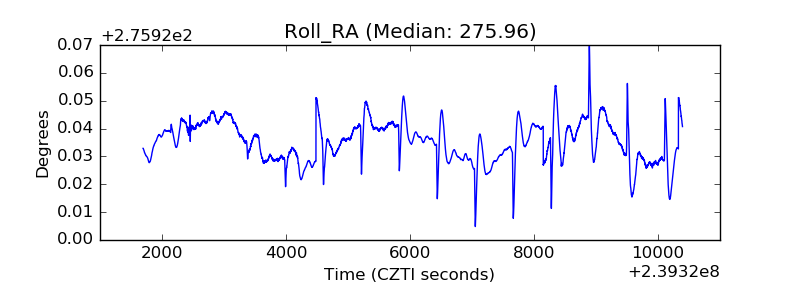 |
| Veto Counter | 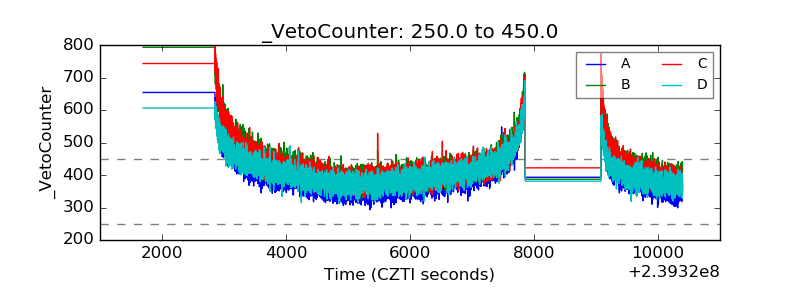 |