| Param | Original file | Final file |
|---|---|---|
| Filename | modeM0/AS1G07_047T01_9000001424_09975cztM0_level2.evt | modeM0/AS1G07_047T01_9000001424_09975cztM0_level2_quad_clean.evt |
| Size (bytes) | 299,885,760 | 40,628,160 |
| Size | 286.0 MB | 38.7 MB |
| Events in quadrant A | 2,919,815 | 227,596 |
| Events in quadrant B | 1,933,947 | 245,928 |
| Events in quadrant C | 1,764,894 | 245,128 |
| Events in quadrant D | 2,188,905 | 227,685 |
| Mode M0 | |||
|---|---|---|---|
| Quadrant | BADHDUFLAG | Total packets | Discarded packets |
| A | 0 | 12036 | 564 |
| B | 0 | 8881 | 256 |
| C | 0 | 8484 | 187 |
| D | 0 | 9649 | 298 |
| Mode SS | |||
|---|---|---|---|
| Quadrant | BADHDUFLAG | Total packets | Discarded packets |
| A | 0 | 84 | 0 |
| B | 0 | 84 | 2 |
| C | 0 | 84 | 4 |
| D | 0 | 84 | 2 |
| Mode M9 | |||
|---|---|---|---|
| Quadrant | BADHDUFLAG | Total packets | Discarded packets |
| A | 0 | 12 | 1 |
| B | 0 | 12 | 0 |
| C | 0 | 12 | 0 |
| D | 0 | 12 | 0 |
| Quadrant | Total seconds | Saturated seconds | Saturation percentage |
|---|---|---|---|
| A | 3975 | 235 | 5.911950% |
| B | 4029 | 32 | 0.794242% |
| C | 4042 | 8 | 0.197922% |
| D | 4025 | 60 | 1.490683% |
Noise dominated data is calculated using 1-second bins in cleaned event files. If a bin has >2000 counts, and if more than 50% of those come from <1% of pixels, then it is considered to be noise-dominated and hence unusable.
| Quadrant | # 1 sec bins | Bins with >0 counts | Bins with >2000 counts | High rate bins dominated by noise | Noise dominated (total time) | Noise dominated (detector-on time) | Marked lightcurve |
|---|---|---|---|---|---|---|---|
| A | 5347 | 4094 | 162 | 162 | 3.03% | 3.96% | 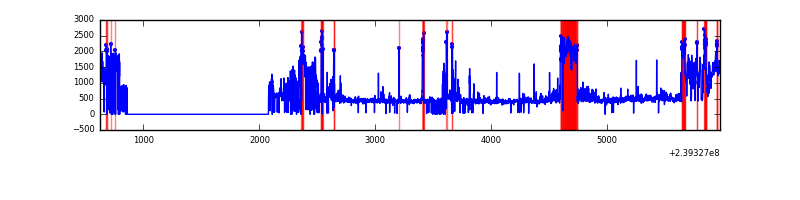 |
| B | 5347 | 4115 | 5 | 5 | 0.09% | 0.12% | 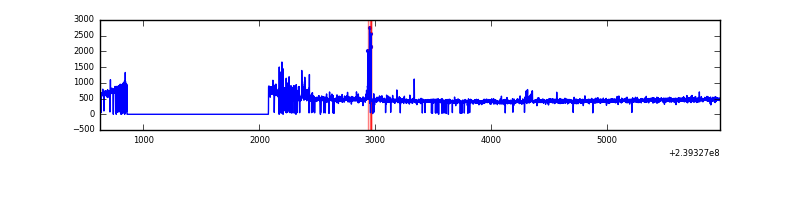 |
| C | 5347 | 4121 | 0 | 0 | 0.00% | 0.00% | 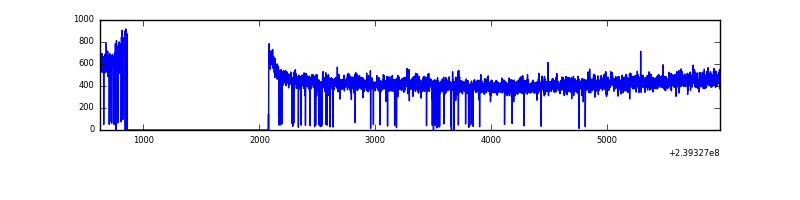 |
| D | 5347 | 4122 | 58 | 58 | 1.08% | 1.41% | 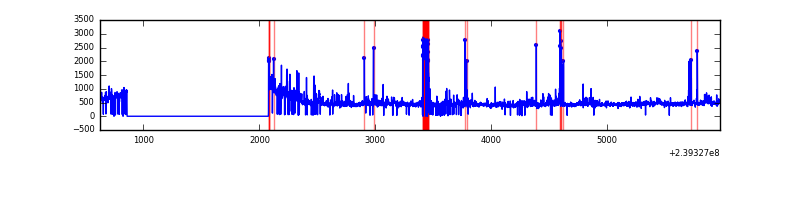 |
Top three noisy pixels from each quadrant. If the there are fewer than three noisy pixels in the level2.evt file, extra rows are filled as -1
| Pixel properties | Quadrant properties | ||||||
|---|---|---|---|---|---|---|---|
| Quadrant | DetID | PixID | Counts | Sigma | Mean | Median | Sigma |
| A | 13 | 251 | 1089724 | 11705.64 | 446 | 435 | 93.1 |
| A | 15 | 174 | 112118 | 1200.16 | 446 | 435 | 93.1 |
| A | 0 | 226 | 4008 | 38.39 | 446 | 435 | 93.1 |
| B | 0 | 85 | 59008 | 642.54 | 467 | 455 | 91.1 |
| B | 4 | 239 | 23516 | 253.06 | 467 | 455 | 91.1 |
| B | 0 | 214 | 14151 | 150.3 | 467 | 455 | 91.1 |
| C | 13 | 61 | 3387 | 27.78 | 451 | 453 | 105.6 |
| C | 14 | 67 | 2872 | 22.91 | 451 | 453 | 105.6 |
| C | 8 | 222 | 2396 | 18.4 | 451 | 453 | 105.6 |
| D | 1 | 52 | 225899 | 2017.46 | 439 | 428 | 111.8 |
| D | 2 | 16 | 112389 | 1001.8 | 439 | 428 | 111.8 |
| D | 8 | 195 | 55362 | 491.54 | 439 | 428 | 111.8 |
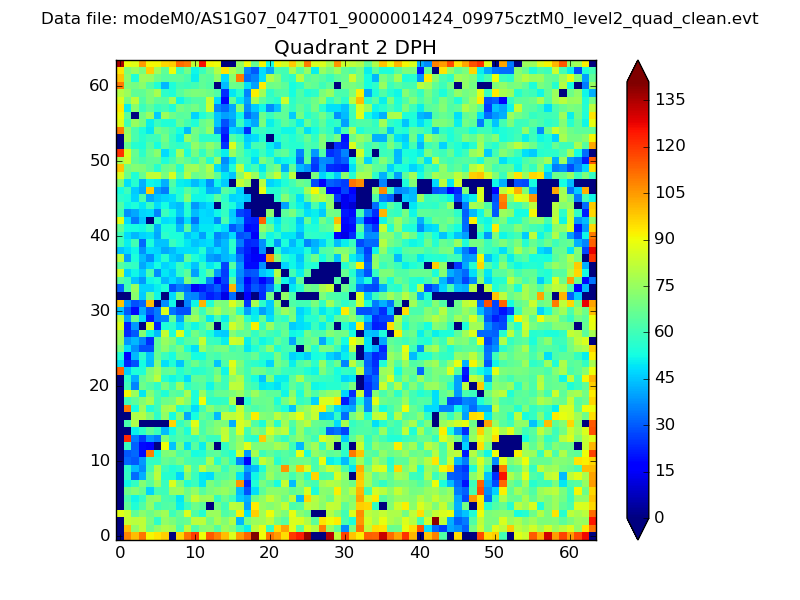
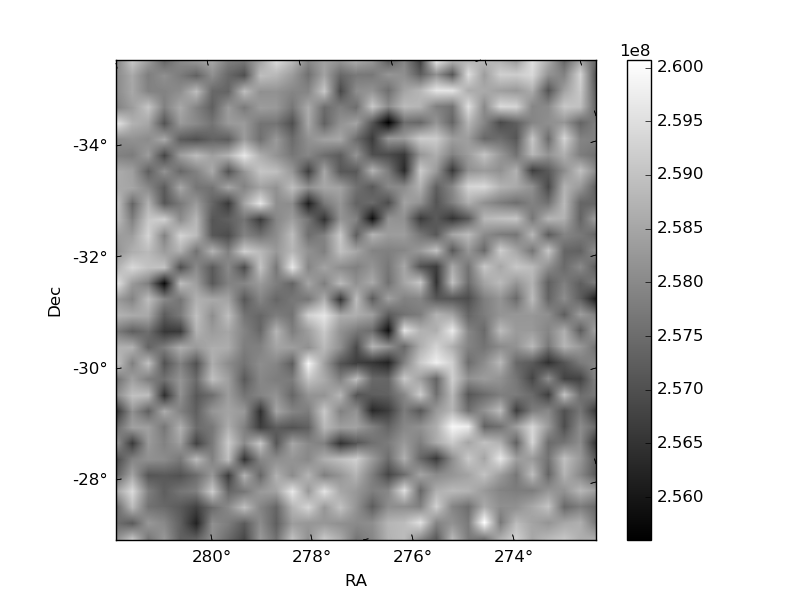
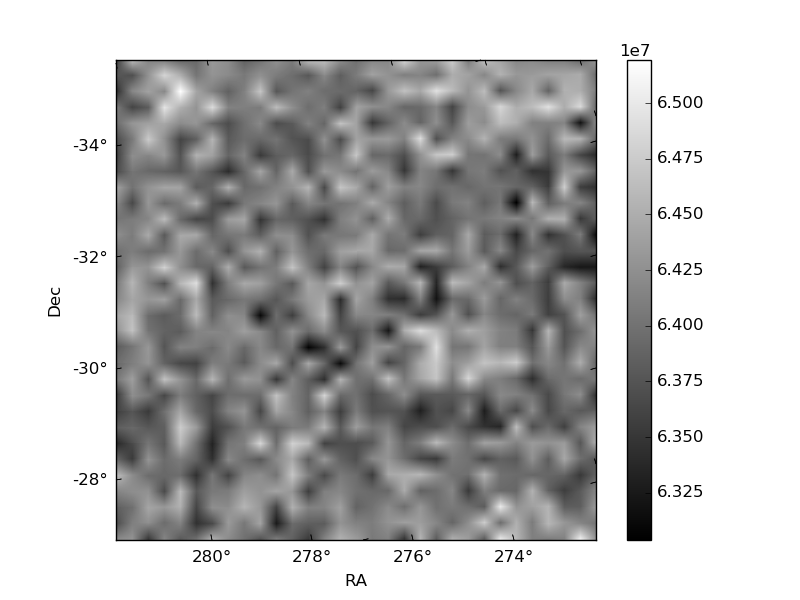
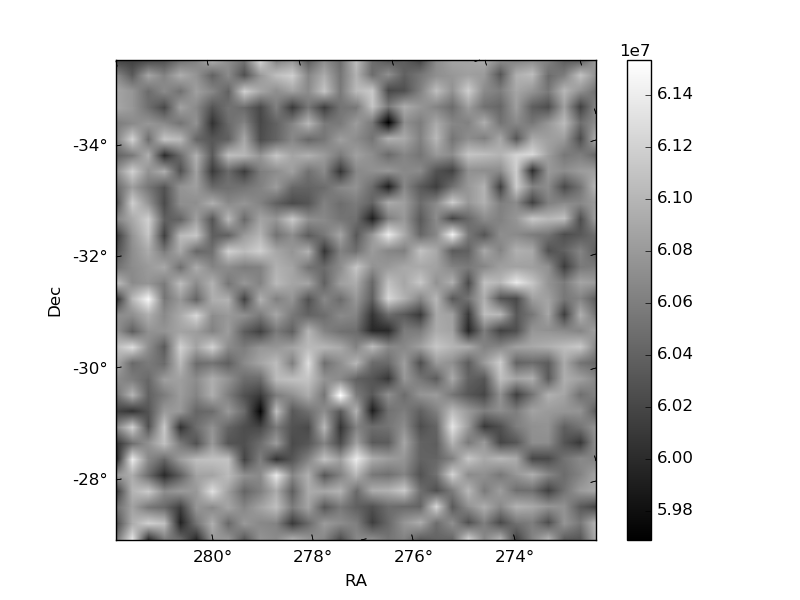
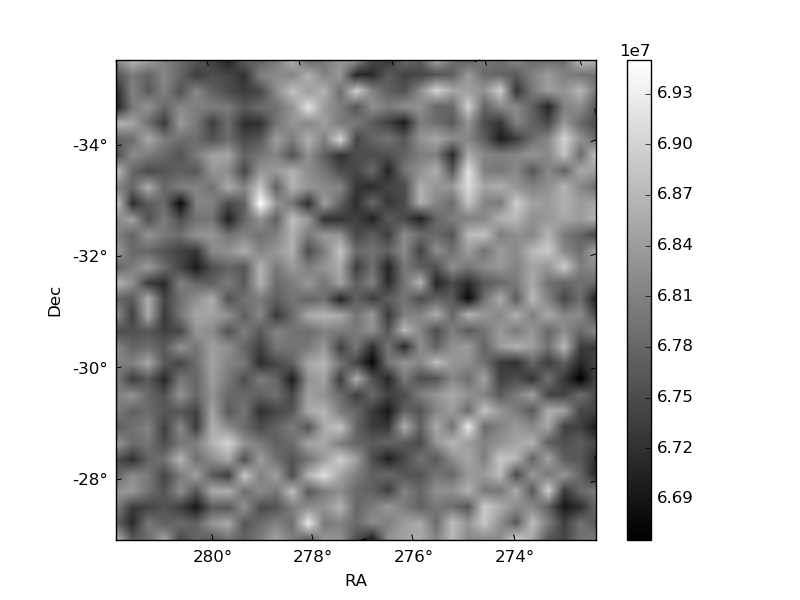
Histogram calculated using DETX and DETY for each event in the final _common_clean file
| Quadrant A | 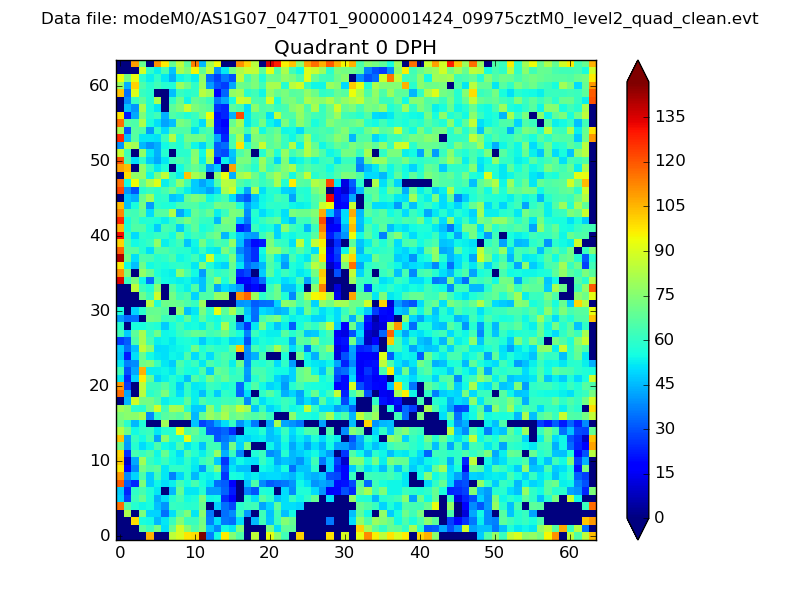 |
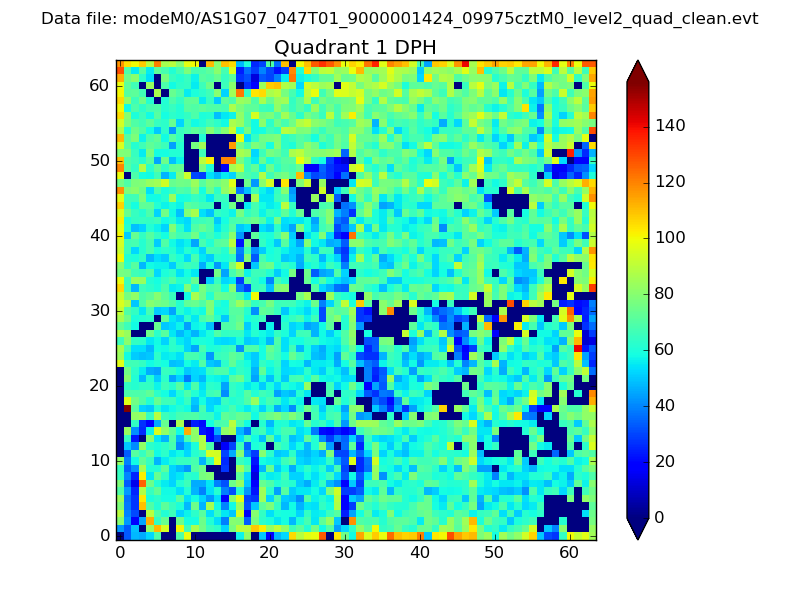 |
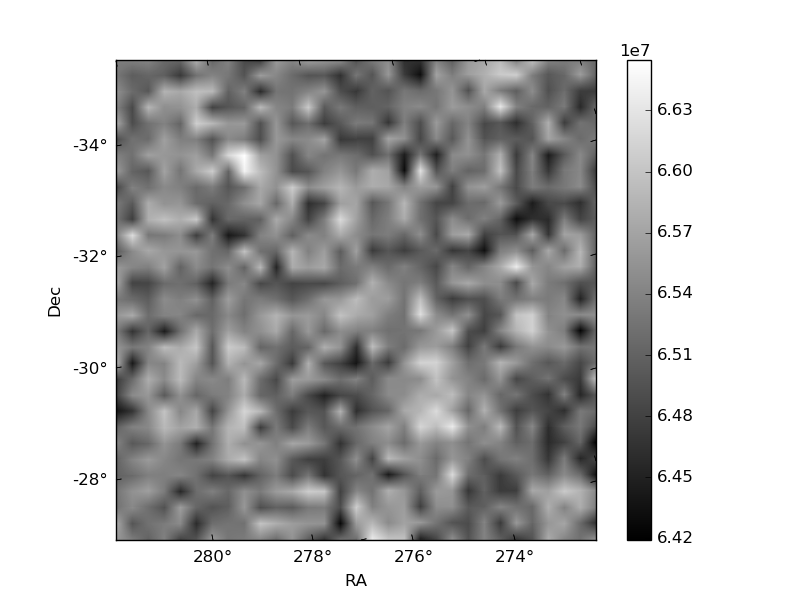
Quadrant B |
|---|---|---|---|
| Quadrant D | 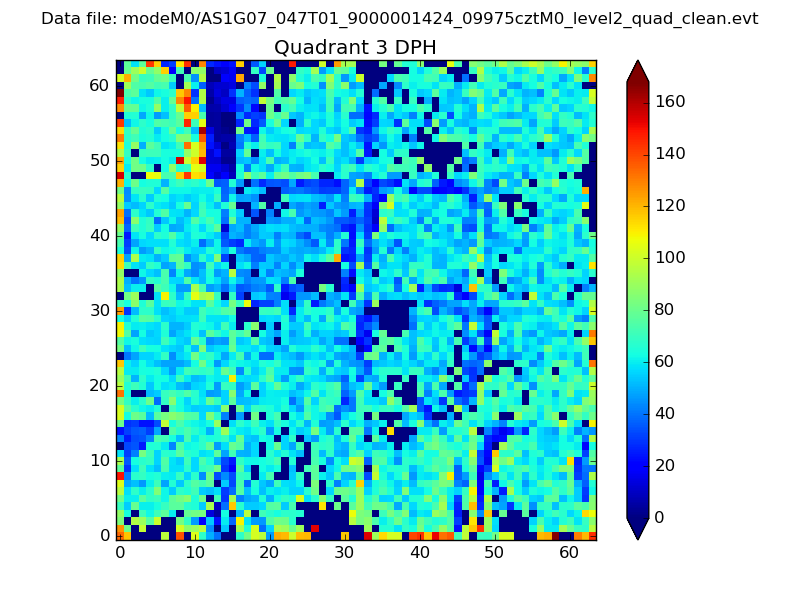 |
 |
Quadrant C |
| Plot type | Count rate plots | Images |
|---|---|---|
| Comparison with Poisson distribution Blue bars denote a histogram of data divided into 1 sec bins. Red curve is a Poisson curve with rate = median count rate of data. |
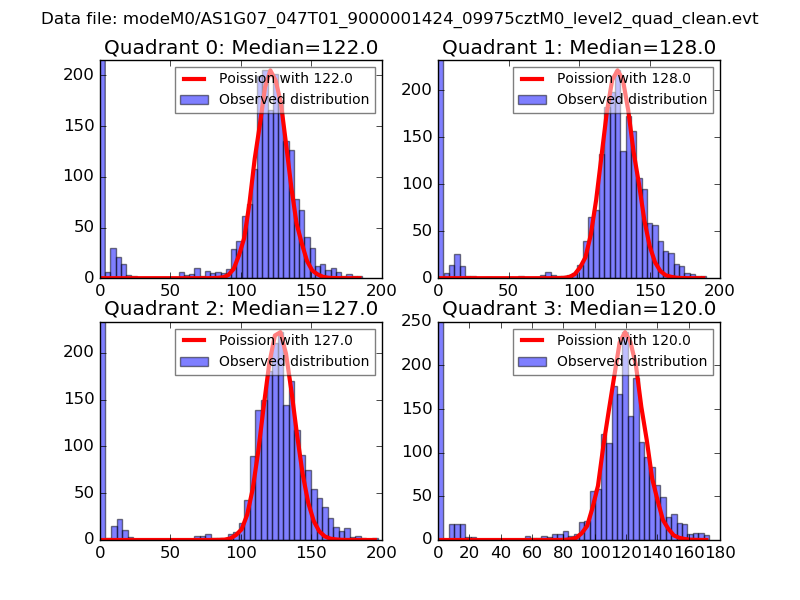 |
 |
| Quadrant-wise count rates Data is divided into 100 sec bins |
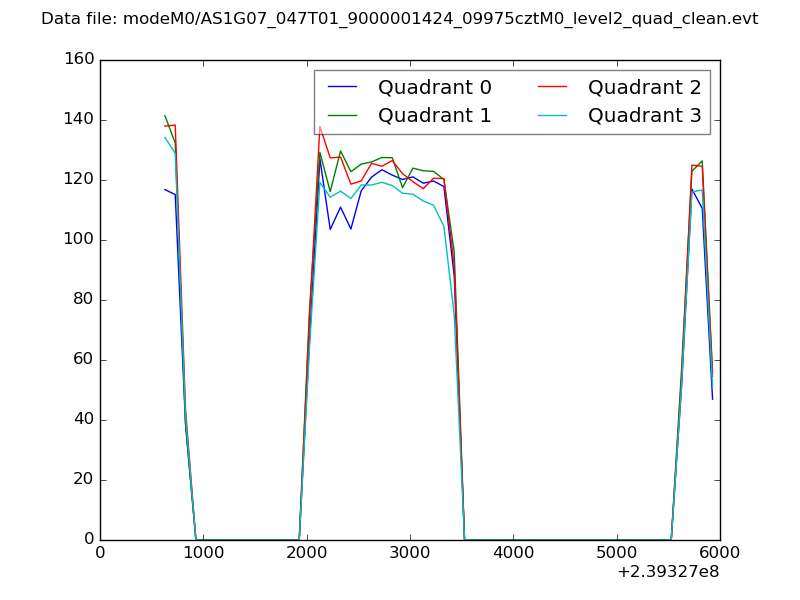 |
|
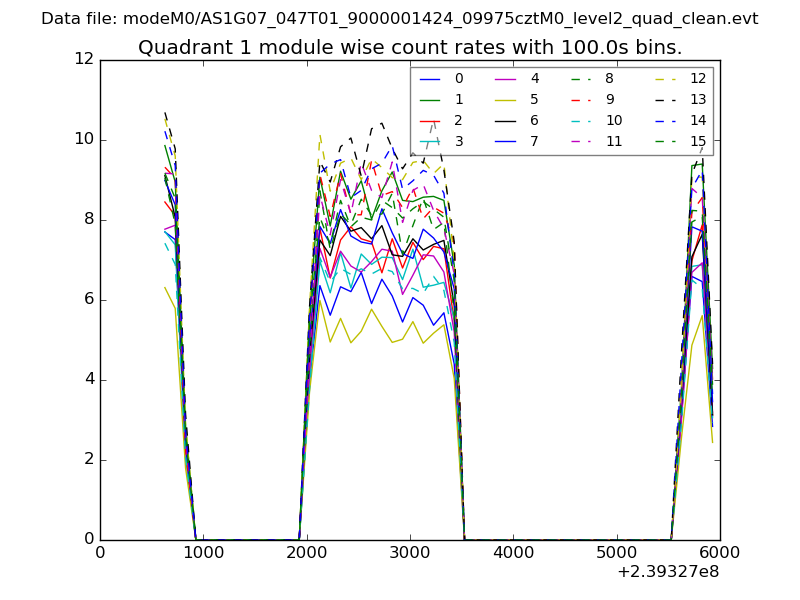
| Module-wise count rates for Quadrant A Data is divided into 100 sec bins |
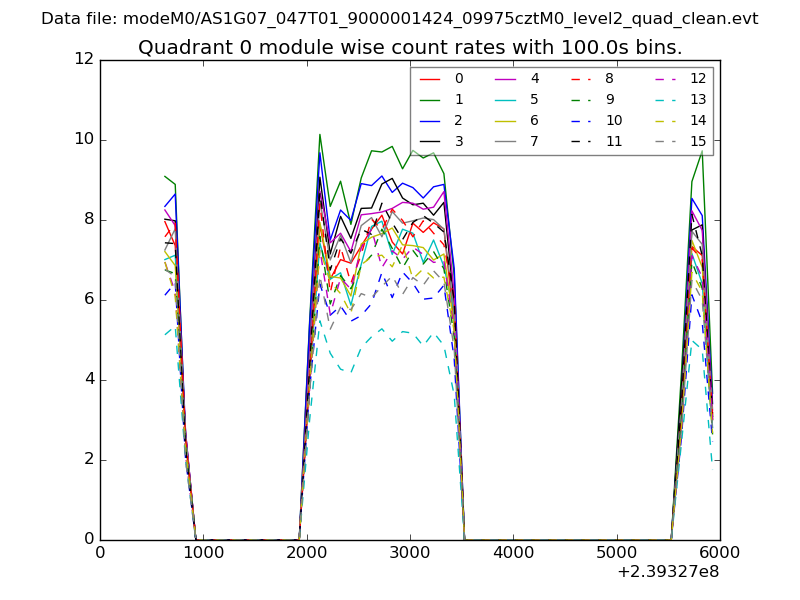 |
 |
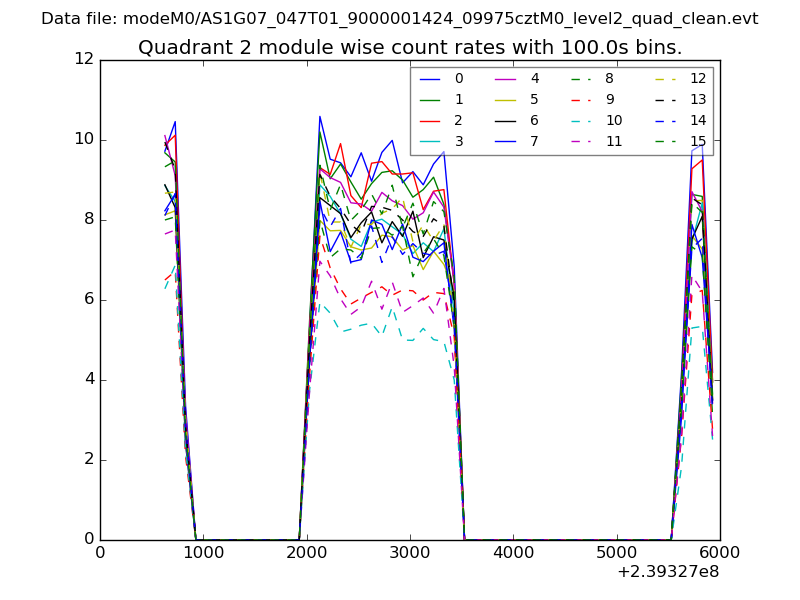
| Module-wise count rates for Quadrant B Data is divided into 100 sec bins |
 |
 |
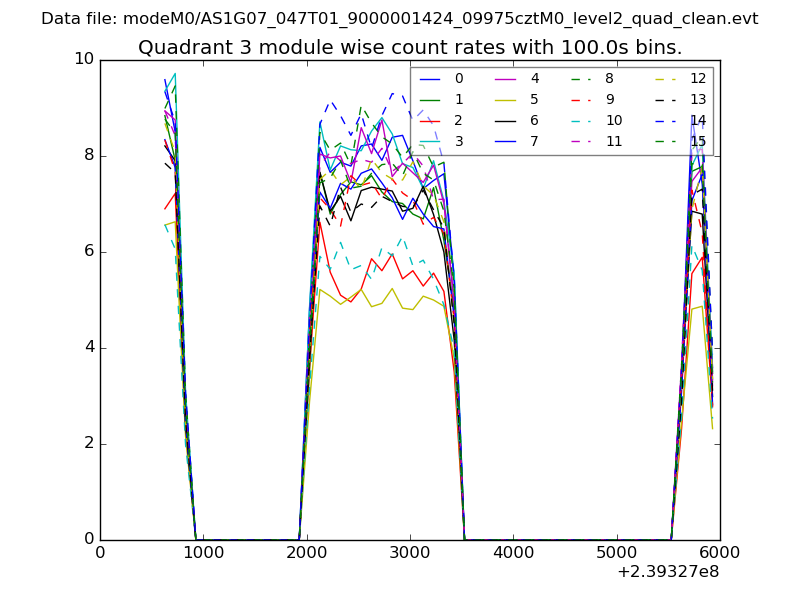
| Module-wise count rates for Quadrant C Data is divided into 100 sec bins |
 |
 |
| Module-wise count rates for Quadrant D Data is divided into 100 sec bins |
 |
 |
| Parameter | Plot |
|---|---|
| CZT HV Monitor | 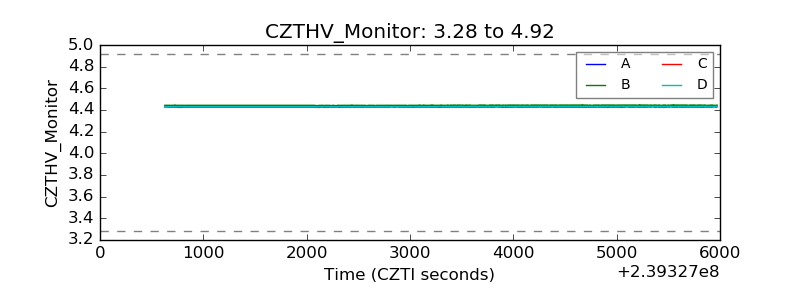 |
| D_VDD | 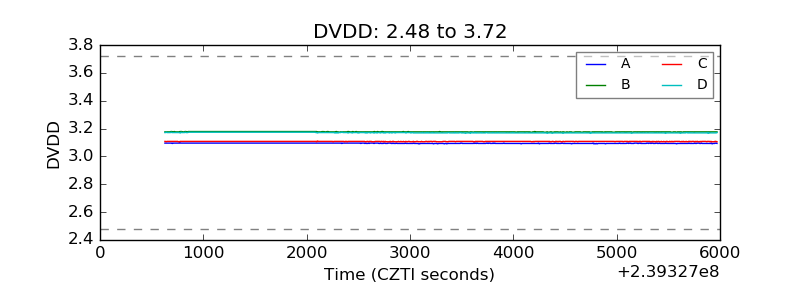 |
| Temperature 1 | 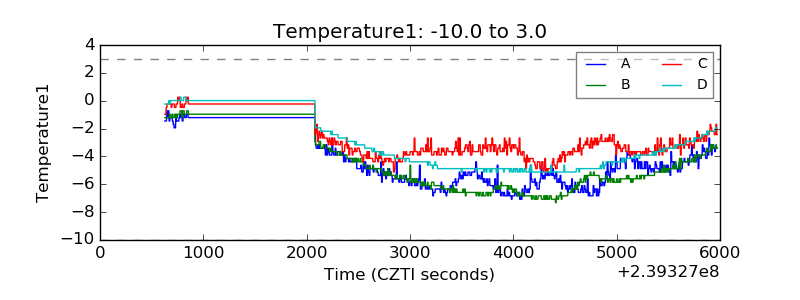 |
| Veto HV Monitor |  |
| Veto LLD | 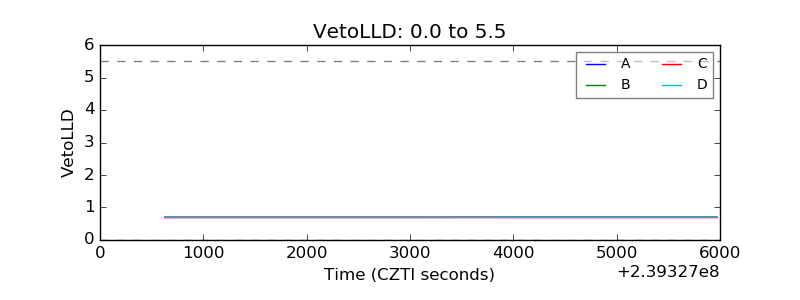 |
| Alpha Counter | 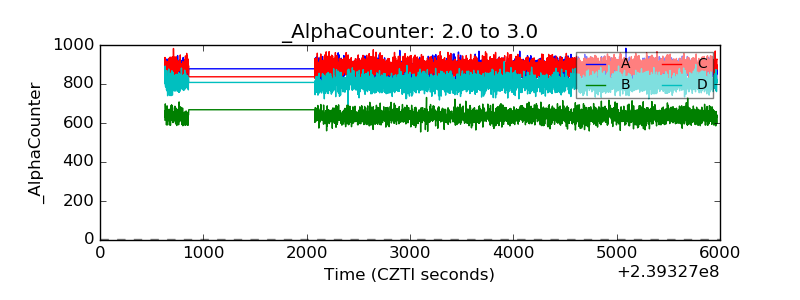 |
| _CPM_Rate |  |
| CZT Counter | 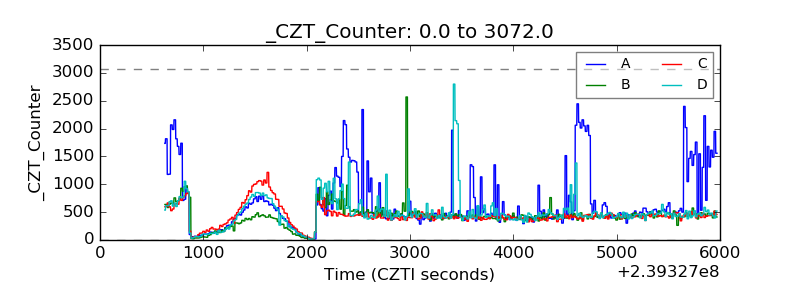 |
| +2.5 Volts monitor | 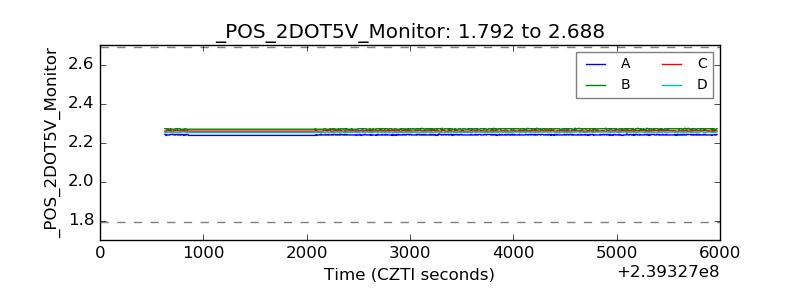 |
| +5 Volts monitor | 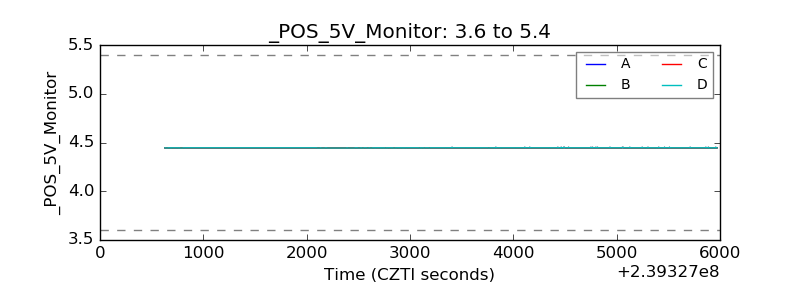 |
| _ROLL_ROT | 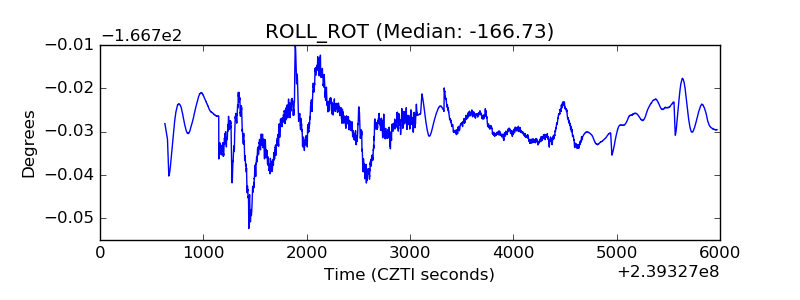 |
| _Roll_DEC |  |
| _Roll_RA | 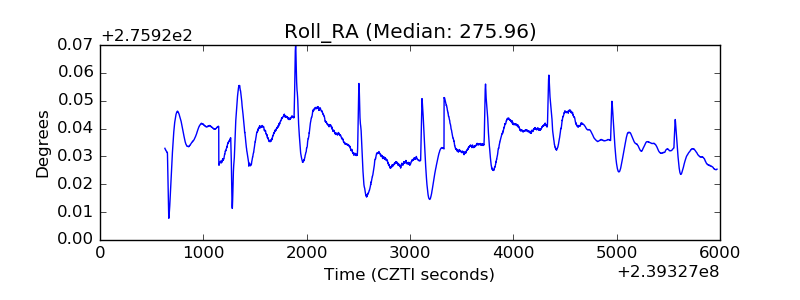 |
| Veto Counter | 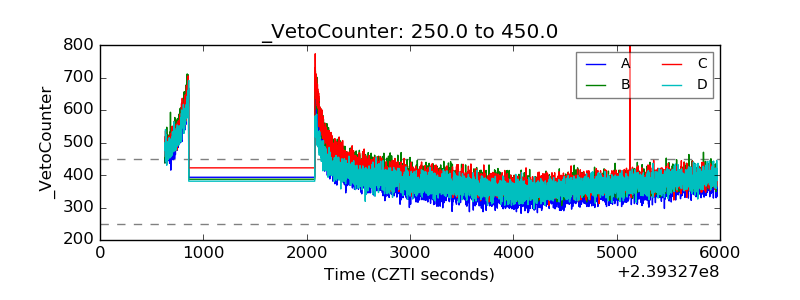 |