| Param | Original file | Final file |
|---|---|---|
| Filename | modeM0/AS1G07_074T01_9000001426_09975cztM0_level2.evt | modeM0/AS1G07_074T01_9000001426_09975cztM0_level2_quad_clean.evt |
| Size (bytes) | 175,656,960 | 32,595,840 |
| Size | 167.5 MB | 31.1 MB |
| Events in quadrant A | 1,669,125 | 203,052 |
| Events in quadrant B | 1,193,282 | 209,935 |
| Events in quadrant C | 1,022,993 | 209,791 |
| Events in quadrant D | 1,278,325 | 200,467 |
| Mode M9 | |||
|---|---|---|---|
| Quadrant | BADHDUFLAG | Total packets | Discarded packets |
| A | 0 | 9 | 0 |
| B | 0 | 9 | 0 |
| C | 0 | 9 | 0 |
| D | 0 | 9 | 0 |
| Mode M0 | |||
|---|---|---|---|
| Quadrant | BADHDUFLAG | Total packets | Discarded packets |
| A | 0 | 6458 | 3 |
| B | 0 | 5040 | 2 |
| C | 0 | 4662 | 2 |
| D | 0 | 5325 | 2 |
| Mode SS | |||
|---|---|---|---|
| Quadrant | BADHDUFLAG | Total packets | Discarded packets |
| A | 0 | 48 | 0 |
| B | 0 | 48 | 0 |
| C | 0 | 48 | 0 |
| D | 0 | 48 | 0 |
| Quadrant | Total seconds | Saturated seconds | Saturation percentage |
|---|---|---|---|
| A | 2260 | 155 | 6.858407% |
| B | 2260 | 39 | 1.725664% |
| C | 2260 | 19 | 0.840708% |
| D | 2260 | 26 | 1.150442% |
Noise dominated data is calculated using 1-second bins in cleaned event files. If a bin has >2000 counts, and if more than 50% of those come from <1% of pixels, then it is considered to be noise-dominated and hence unusable.
| Quadrant | # 1 sec bins | Bins with >0 counts | Bins with >2000 counts | High rate bins dominated by noise | Noise dominated (total time) | Noise dominated (detector-on time) | Marked lightcurve |
|---|---|---|---|---|---|---|---|
| A | 3175 | 2261 | 113 | 113 | 3.56% | 5.00% | 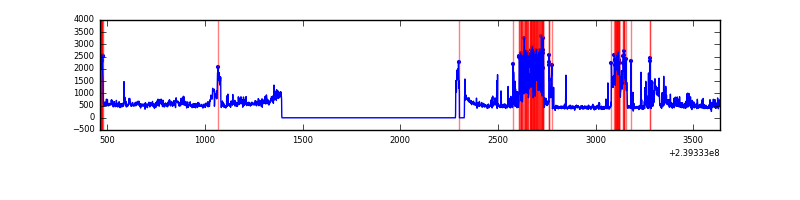 |
| B | 3175 | 2261 | 9 | 9 | 0.28% | 0.40% | 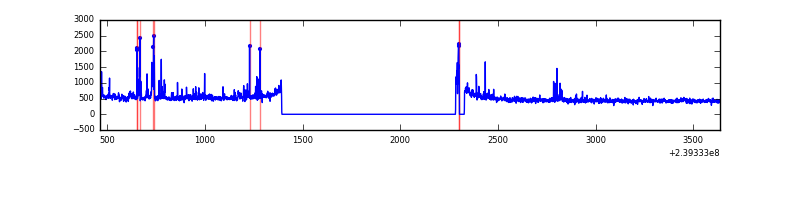 |
| C | 3175 | 2262 | 0 | 0 | 0.00% | 0.00% | 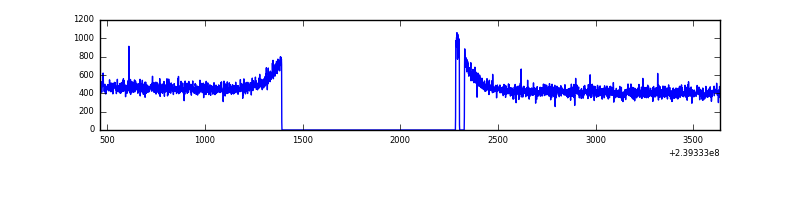 |
| D | 3175 | 2262 | 4 | 4 | 0.13% | 0.18% | 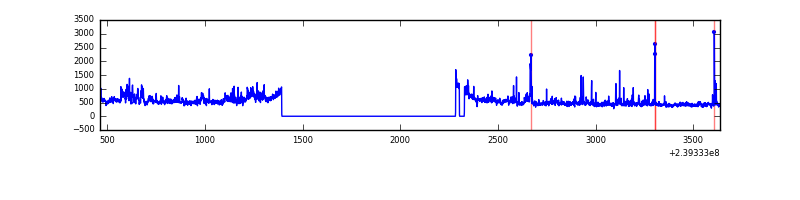 |
Top three noisy pixels from each quadrant. If the there are fewer than three noisy pixels in the level2.evt file, extra rows are filled as -1
| Pixel properties | Quadrant properties | ||||||
|---|---|---|---|---|---|---|---|
| Quadrant | DetID | PixID | Counts | Sigma | Mean | Median | Sigma |
| A | 13 | 251 | 630396 | 11056.69 | 266 | 260 | 57.0 |
| A | 15 | 174 | 11958 | 205.26 | 266 | 260 | 57.0 |
| A | 0 | 226 | 2354 | 36.74 | 266 | 260 | 57.0 |
| B | 4 | 239 | 61946 | 1119.57 | 272 | 265 | 55.1 |
| B | 11 | 51 | 23243 | 417.07 | 272 | 265 | 55.1 |
| B | 0 | 189 | 13600 | 242.04 | 272 | 265 | 55.1 |
| C | 13 | 61 | 1963 | 27.27 | 261 | 262 | 62.4 |
| C | 14 | 67 | 847 | 9.38 | 261 | 262 | 62.4 |
| C | 12 | 4 | 781 | 8.32 | 261 | 262 | 62.4 |
| D | 1 | 52 | 100628 | 1537.85 | 261 | 253 | 65.3 |
| D | 2 | 33 | 56637 | 863.86 | 261 | 253 | 65.3 |
| D | 8 | 195 | 50603 | 771.41 | 261 | 253 | 65.3 |
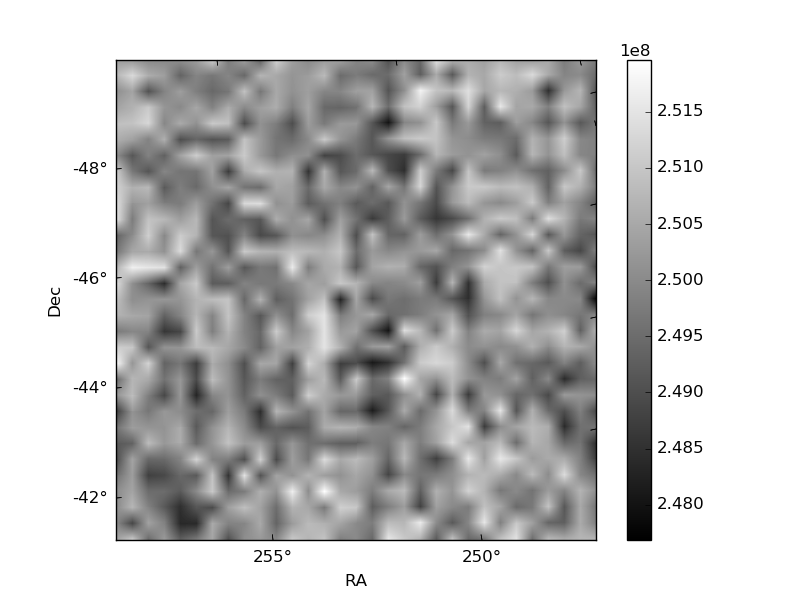
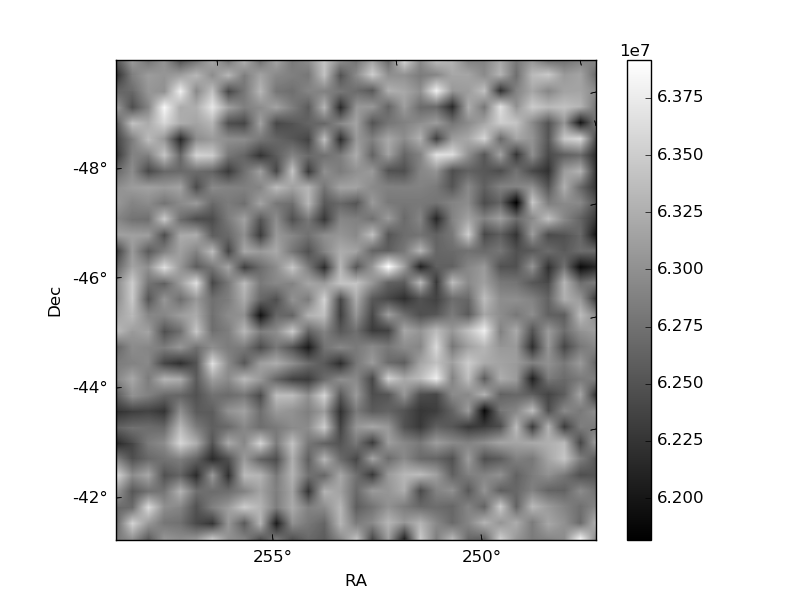
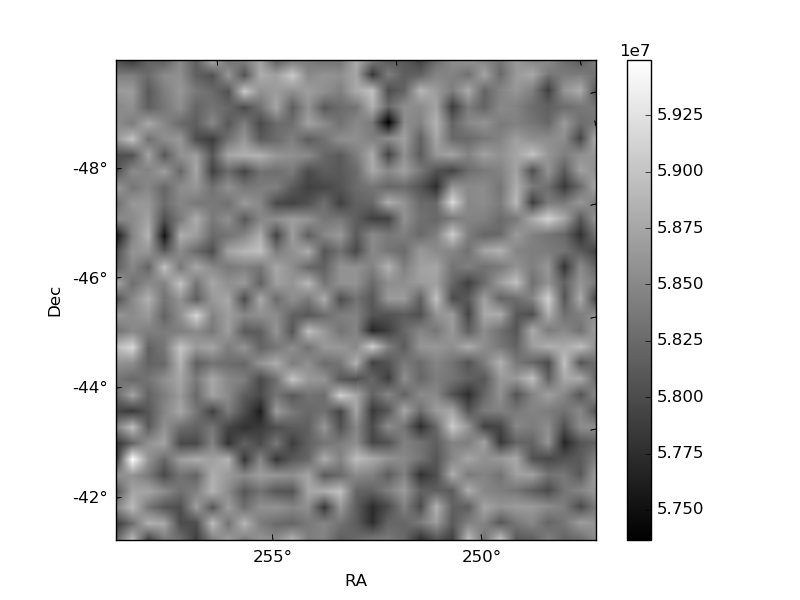
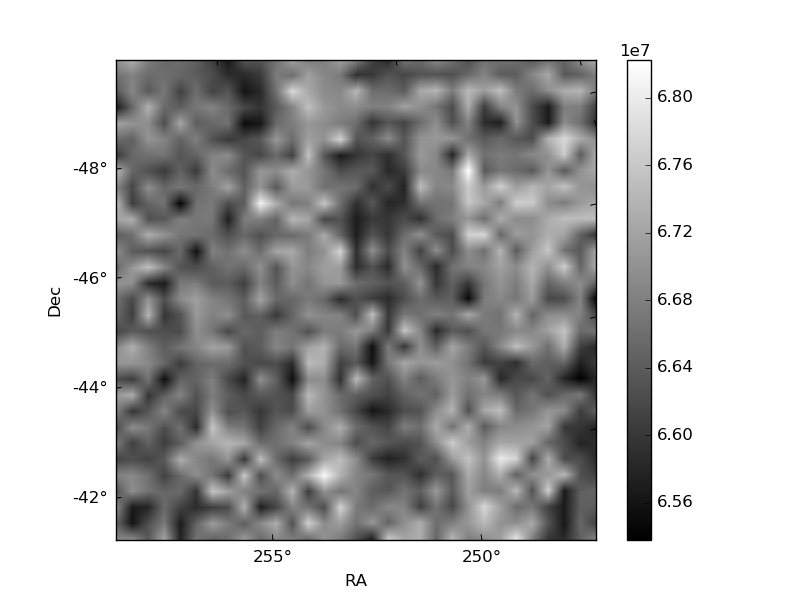
Histogram calculated using DETX and DETY for each event in the final _common_clean file
| Quadrant A | 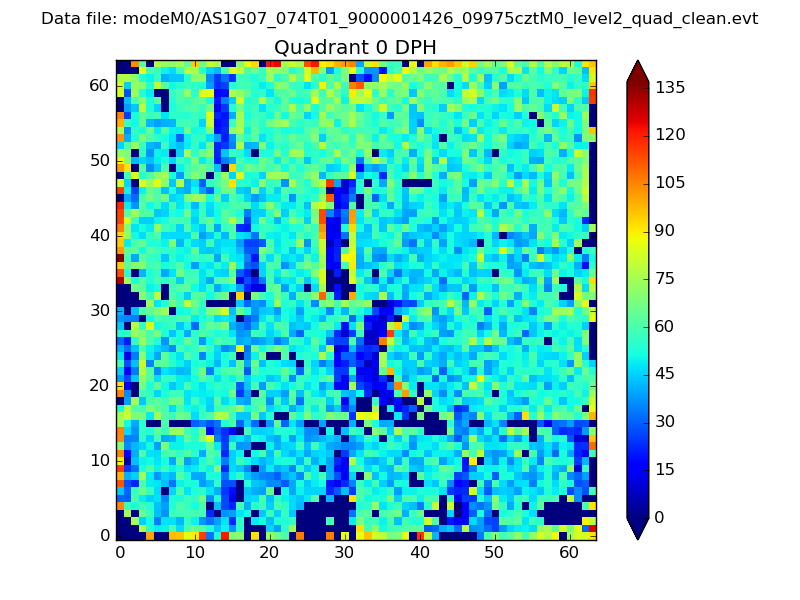 |
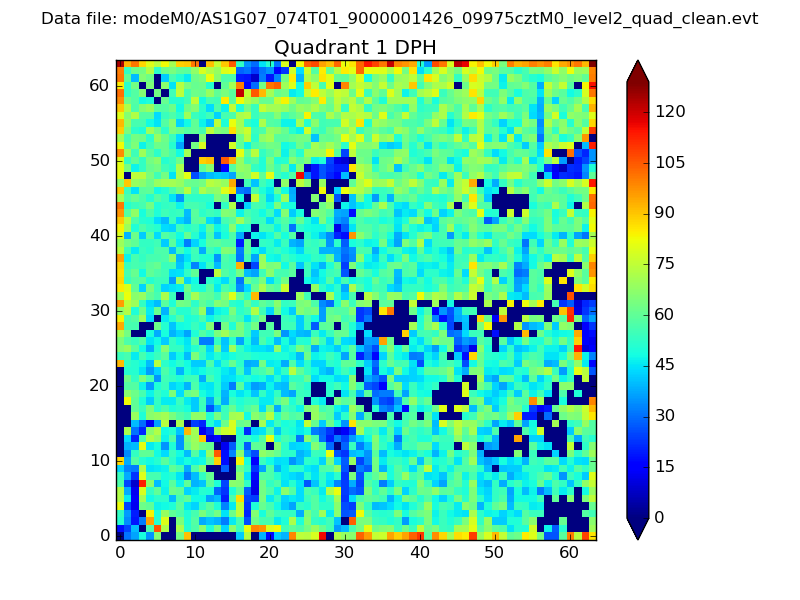 |
Quadrant B |
|---|---|---|---|
| Quadrant D | 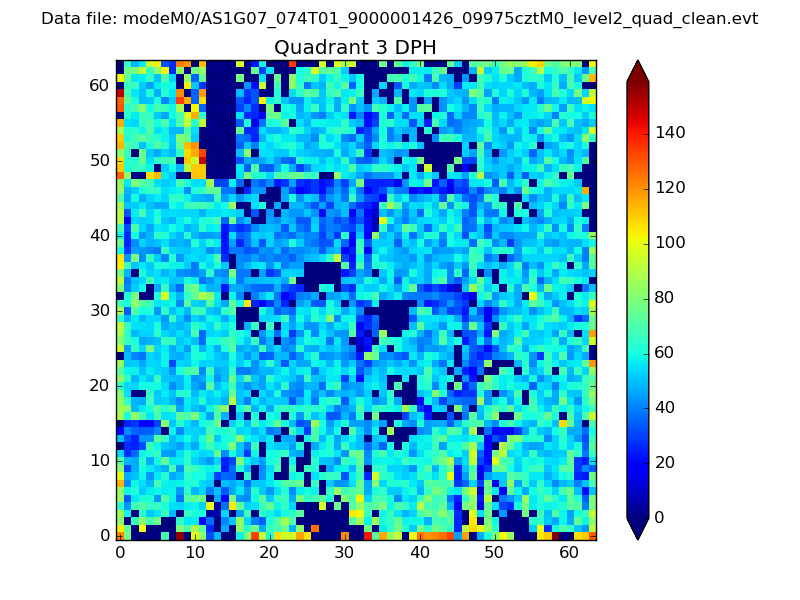 |
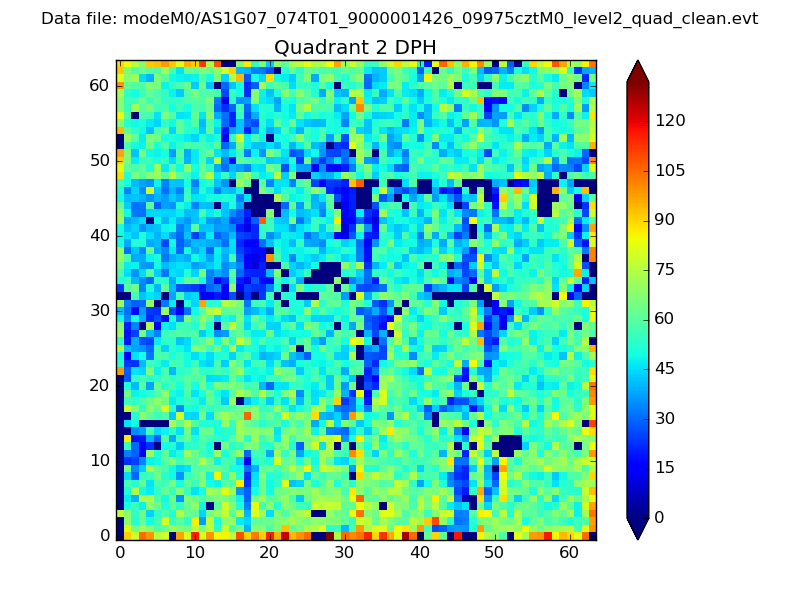 |
Quadrant C |
| Plot type | Count rate plots | Images |
|---|---|---|
| Comparison with Poisson distribution Blue bars denote a histogram of data divided into 1 sec bins. Red curve is a Poisson curve with rate = median count rate of data. |
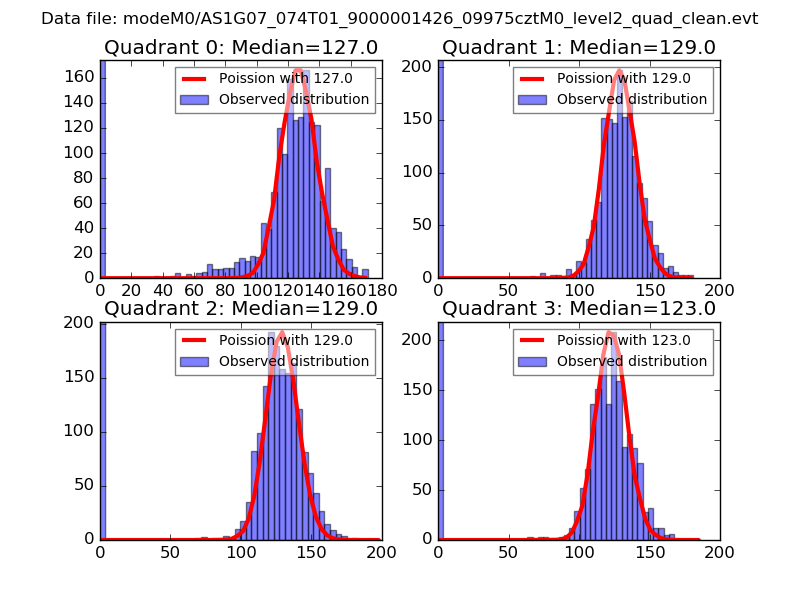 |
 |
| Quadrant-wise count rates Data is divided into 100 sec bins |
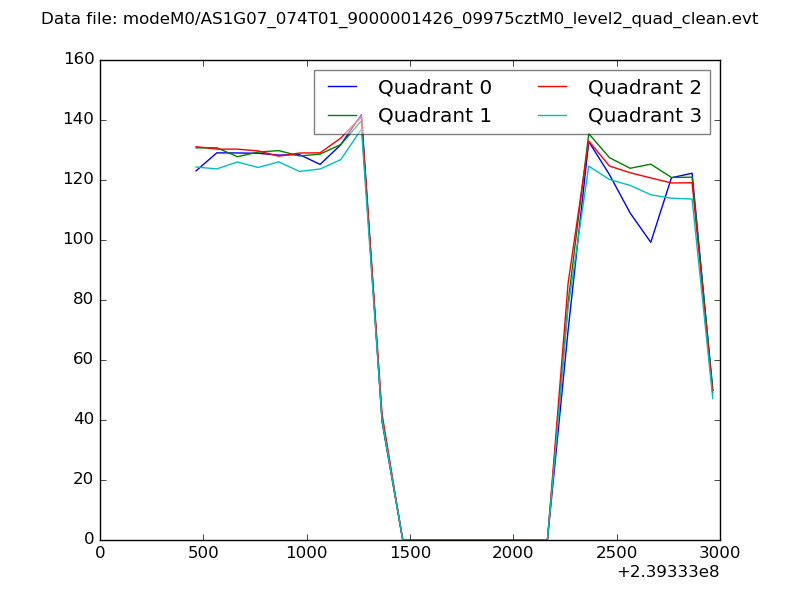 |
|
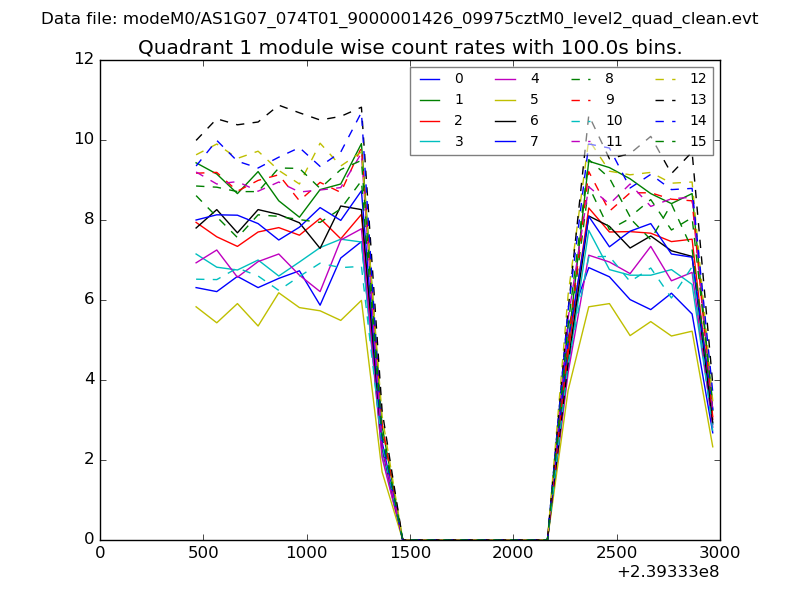
| Module-wise count rates for Quadrant A Data is divided into 100 sec bins |
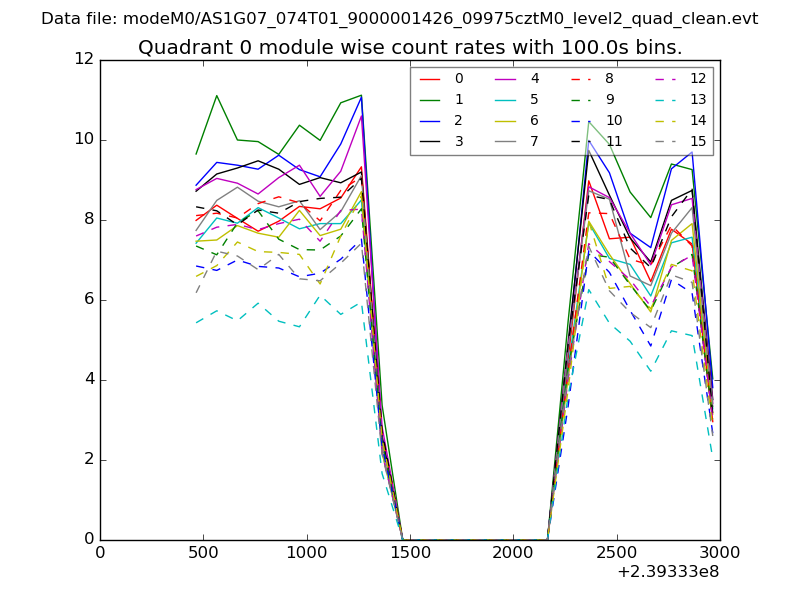 |
 |
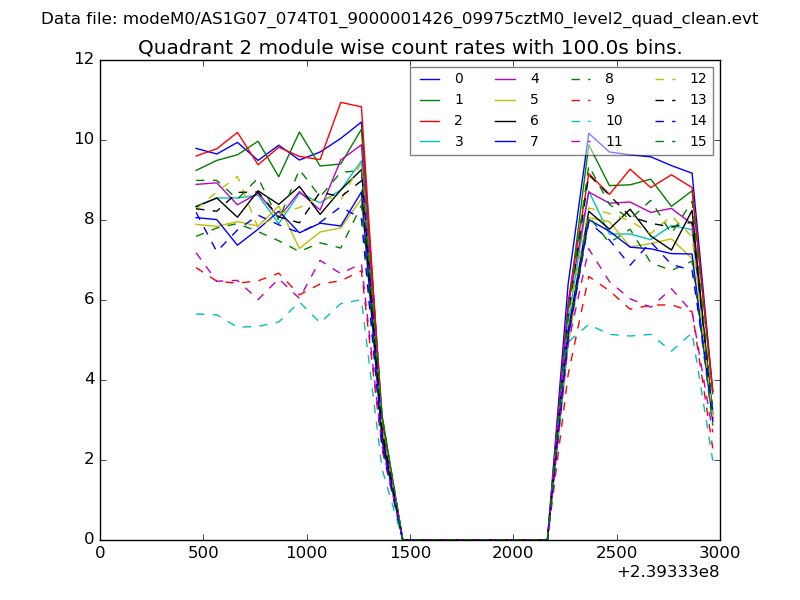
| Module-wise count rates for Quadrant B Data is divided into 100 sec bins |
 |
 |
| Module-wise count rates for Quadrant C Data is divided into 100 sec bins |
 |
 |
| Module-wise count rates for Quadrant D Data is divided into 100 sec bins |
 |
 |
| Parameter | Plot |
|---|---|
| CZT HV Monitor | 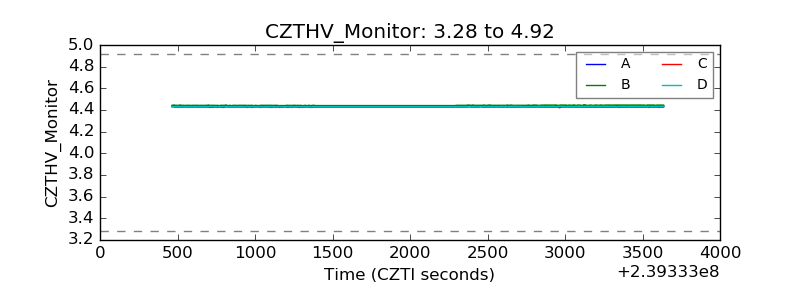 |
| D_VDD | 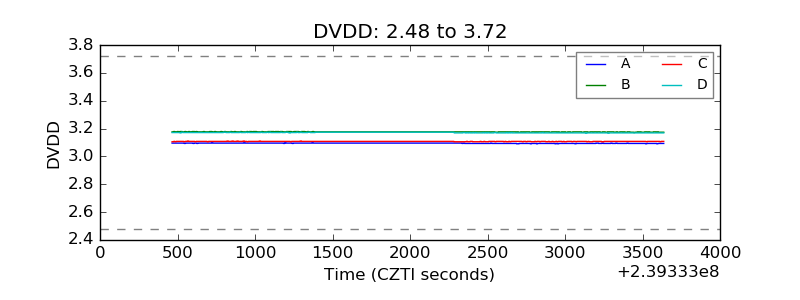 |
| Temperature 1 | 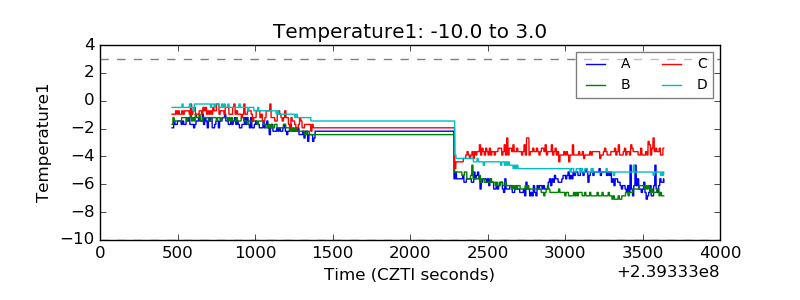 |
| Veto HV Monitor |  |
| Veto LLD |  |
| Alpha Counter | 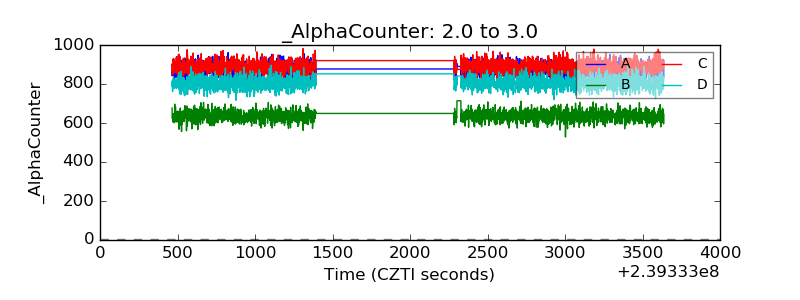 |
| _CPM_Rate | 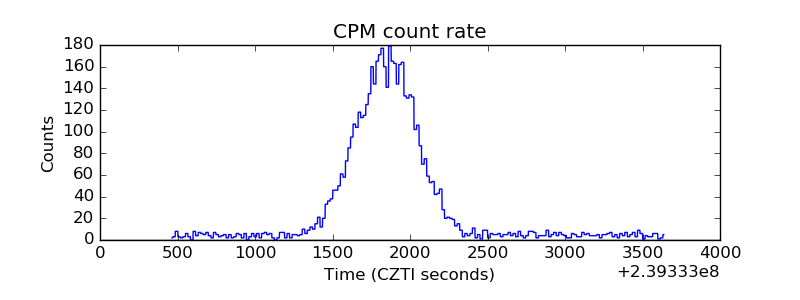 |
| CZT Counter | 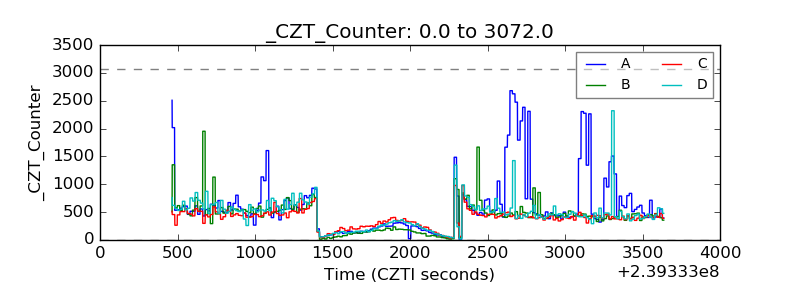 |
| +2.5 Volts monitor |  |
| +5 Volts monitor |  |
| _ROLL_ROT |  |
| _Roll_DEC | 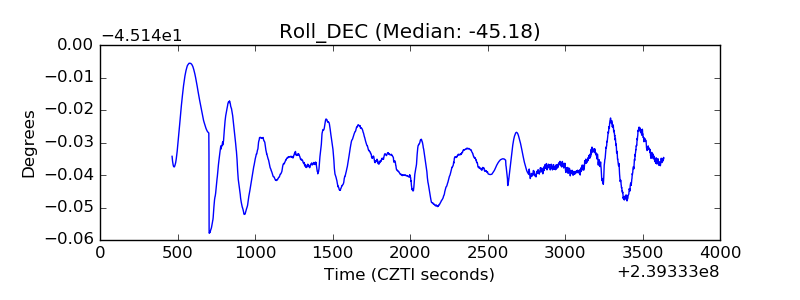 |
| _Roll_RA | 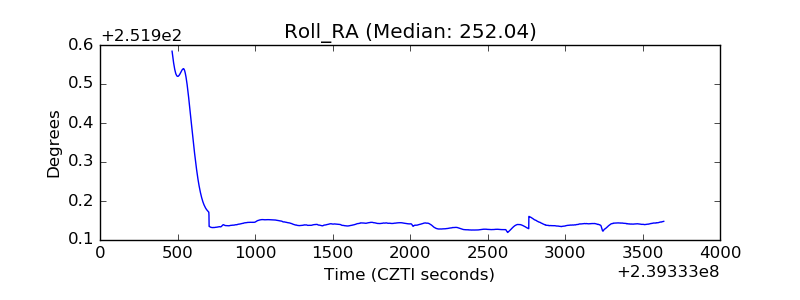 |
| Veto Counter | 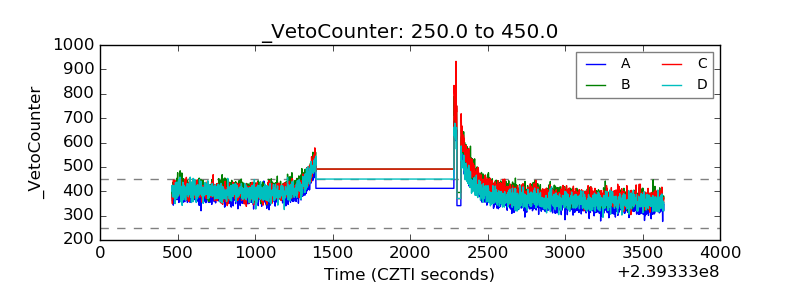 |