| Param | Original file | Final file |
|---|---|---|
| Filename | modeM0/AS1G07_074T01_9000001426_09976cztM0_level2.evt | modeM0/AS1G07_074T01_9000001426_09976cztM0_level2_quad_clean.evt |
| Size (bytes) | 567,921,600 | 88,318,080 |
| Size | 541.6 MB | 84.2 MB |
| Events in quadrant A | 4,474,850 | 535,441 |
| Events in quadrant B | 4,189,122 | 535,534 |
| Events in quadrant C | 3,399,529 | 550,115 |
| Events in quadrant D | 4,618,242 | 522,114 |
| Mode M9 | |||
|---|---|---|---|
| Quadrant | BADHDUFLAG | Total packets | Discarded packets |
| A | 0 | 14 | 0 |
| B | 0 | 14 | 0 |
| C | 0 | 14 | 0 |
| D | 0 | 14 | 0 |
| Mode M0 | |||
|---|---|---|---|
| Quadrant | BADHDUFLAG | Total packets | Discarded packets |
| A | 0 | 18621 | 4 |
| B | 0 | 17754 | 3 |
| C | 0 | 15755 | 3 |
| D | 0 | 19007 | 3 |
| Mode SS | |||
|---|---|---|---|
| Quadrant | BADHDUFLAG | Total packets | Discarded packets |
| A | 0 | 156 | 0 |
| B | 0 | 156 | 0 |
| C | 0 | 156 | 0 |
| D | 0 | 156 | 0 |
| Quadrant | Total seconds | Saturated seconds | Saturation percentage |
|---|---|---|---|
| A | 7635 | 275 | 3.601834% |
| B | 7635 | 319 | 4.178127% |
| C | 7635 | 70 | 0.916830% |
| D | 7635 | 165 | 2.161100% |
Noise dominated data is calculated using 1-second bins in cleaned event files. If a bin has >2000 counts, and if more than 50% of those come from <1% of pixels, then it is considered to be noise-dominated and hence unusable.
| Quadrant | # 1 sec bins | Bins with >0 counts | Bins with >2000 counts | High rate bins dominated by noise | Noise dominated (total time) | Noise dominated (detector-on time) | Marked lightcurve |
|---|---|---|---|---|---|---|---|
| A | 9010 | 7636 | 157 | 157 | 1.74% | 2.06% | 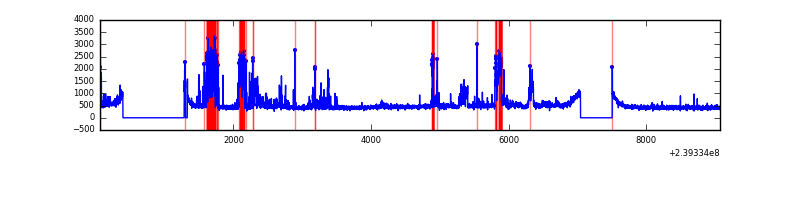 |
| B | 9010 | 7636 | 152 | 152 | 1.69% | 1.99% | 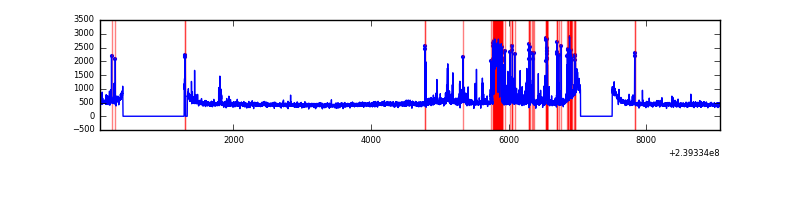 |
| C | 9010 | 7637 | 1 | 1 | 0.01% | 0.01% | 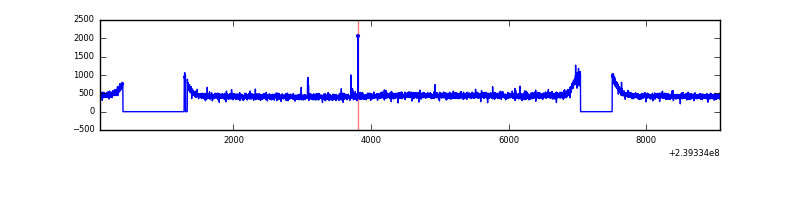 |
| D | 9010 | 7637 | 78 | 78 | 0.87% | 1.02% |  |
Top three noisy pixels from each quadrant. If the there are fewer than three noisy pixels in the level2.evt file, extra rows are filled as -1
| Pixel properties | Quadrant properties | ||||||
|---|---|---|---|---|---|---|---|
| Quadrant | DetID | PixID | Counts | Sigma | Mean | Median | Sigma |
| A | 13 | 251 | 925432 | 5124.92 | 879 | 860 | 180.4 |
| A | 15 | 174 | 108941 | 599.1 | 879 | 860 | 180.4 |
| A | 8 | 15 | 35873 | 194.08 | 879 | 860 | 180.4 |
| B | 4 | 239 | 593765 | 3468.23 | 880 | 856 | 171.0 |
| B | 11 | 51 | 50455 | 290.13 | 880 | 856 | 171.0 |
| B | 0 | 214 | 41354 | 236.89 | 880 | 856 | 171.0 |
| C | 14 | 67 | 8354 | 37.08 | 864 | 865 | 202.0 |
| C | 9 | 221 | 6609 | 28.44 | 864 | 865 | 202.0 |
| C | 13 | 61 | 6506 | 27.93 | 864 | 865 | 202.0 |
| D | 1 | 52 | 411870 | 1873.1 | 850 | 828 | 219.4 |
| D | 2 | 16 | 236688 | 1074.8 | 850 | 828 | 219.4 |
| D | 8 | 195 | 226863 | 1030.03 | 850 | 828 | 219.4 |
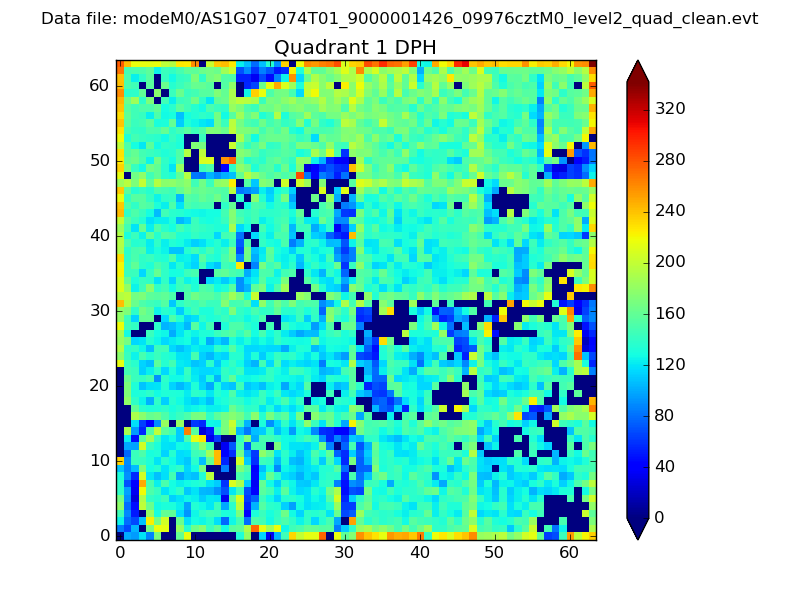
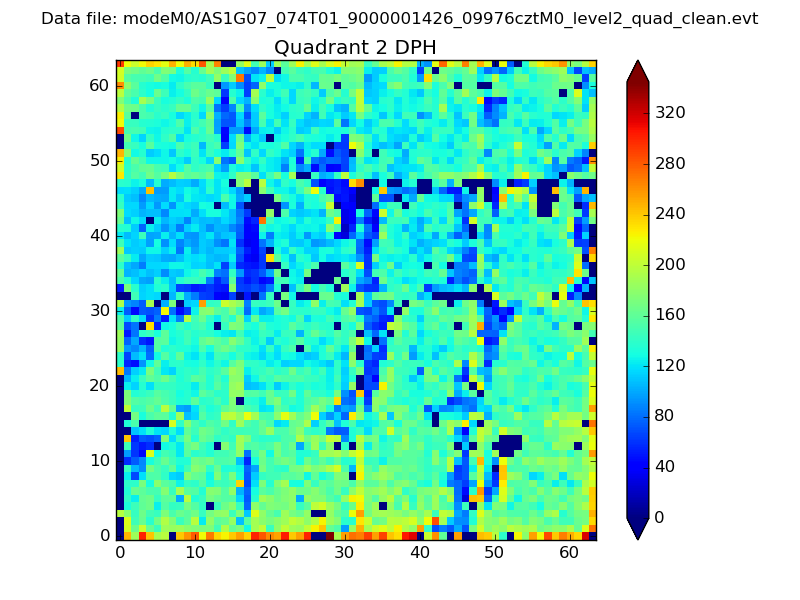
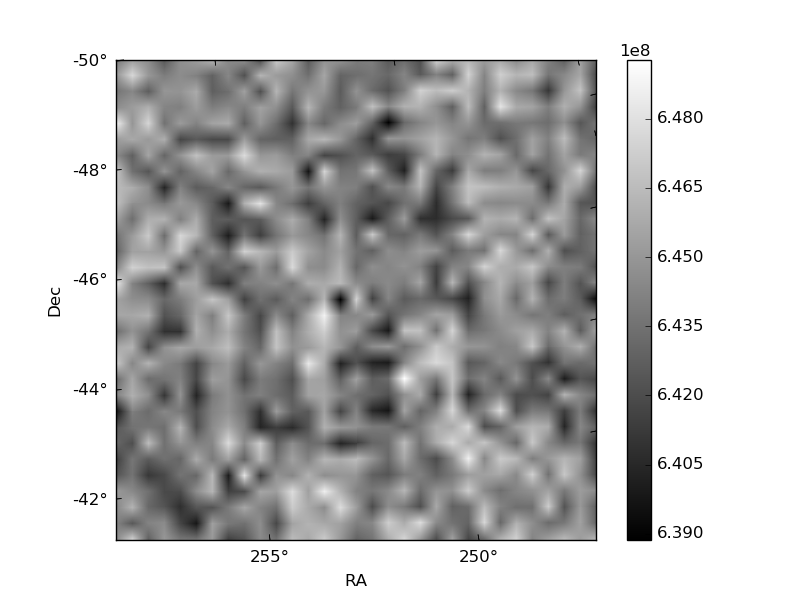
Histogram calculated using DETX and DETY for each event in the final _common_clean file
| Quadrant A | 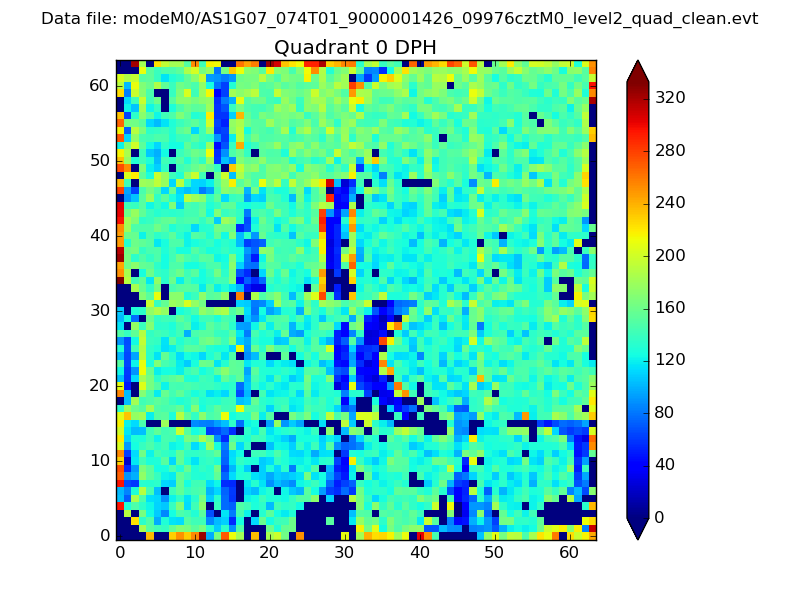 |
 |
Quadrant B |
|---|---|---|---|
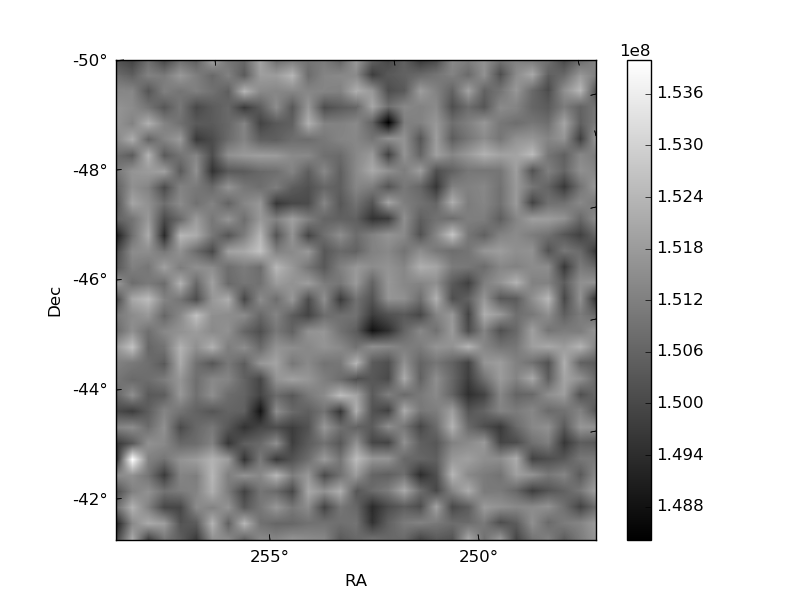
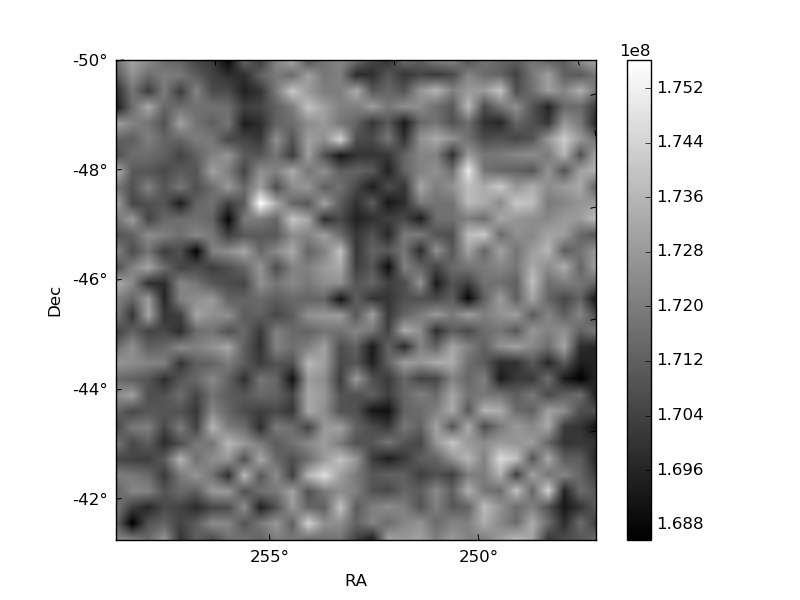
| Quadrant D | 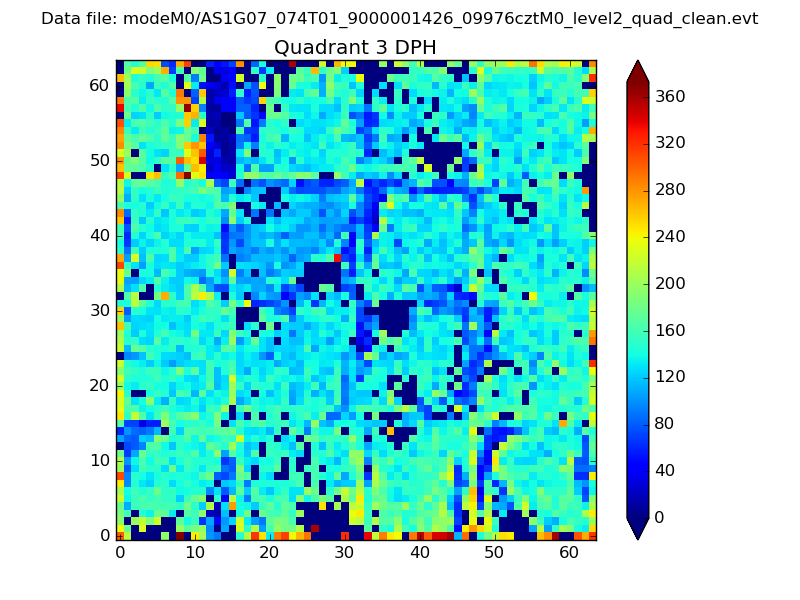 |
 |
Quadrant C |
| Plot type | Count rate plots | Images |
|---|---|---|
| Comparison with Poisson distribution Blue bars denote a histogram of data divided into 1 sec bins. Red curve is a Poisson curve with rate = median count rate of data. |
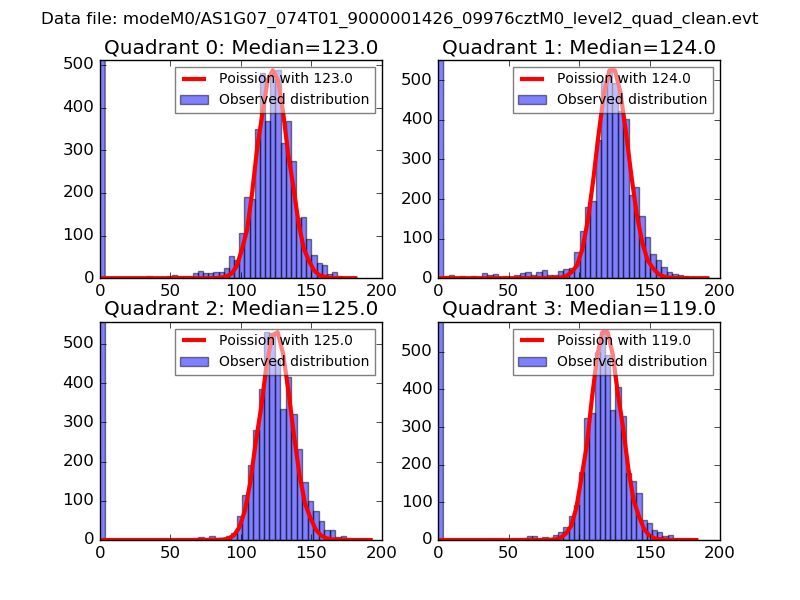 |
 |
| Quadrant-wise count rates Data is divided into 100 sec bins |
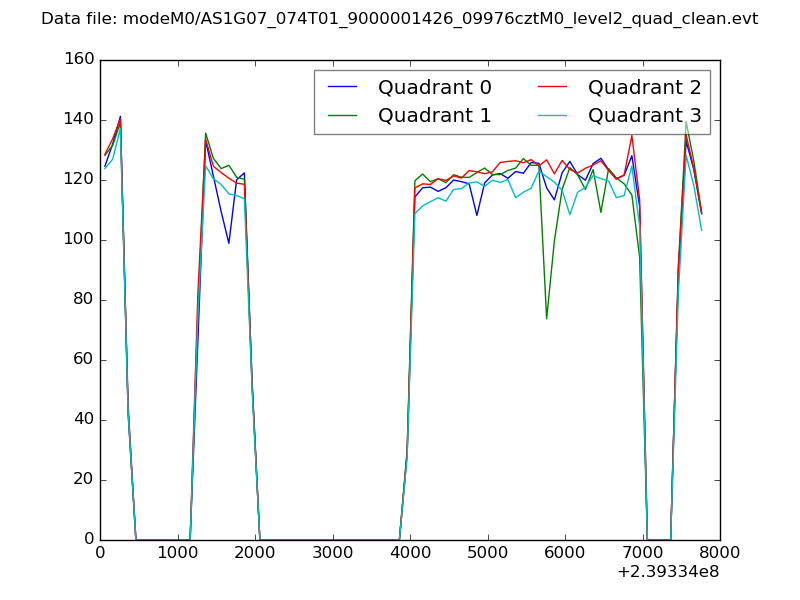 |
|
| Module-wise count rates for Quadrant A Data is divided into 100 sec bins |
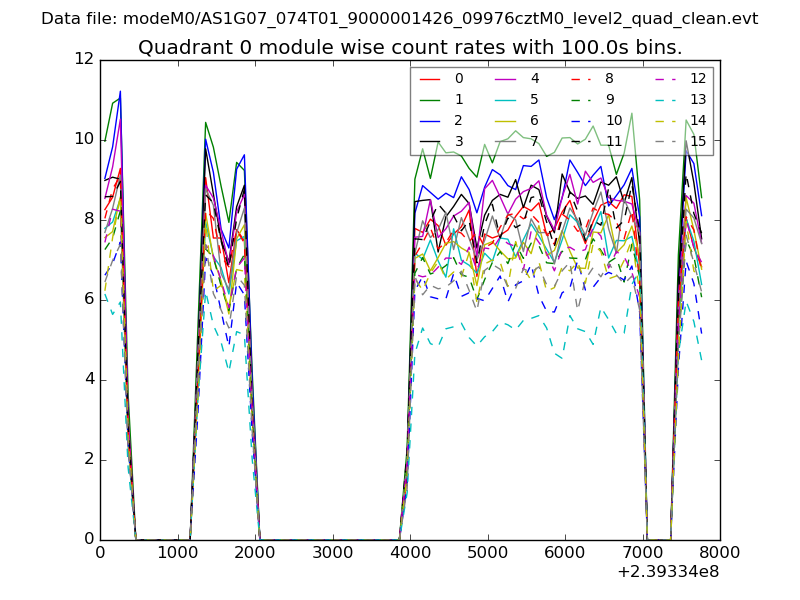 |
 |
| Module-wise count rates for Quadrant B Data is divided into 100 sec bins |
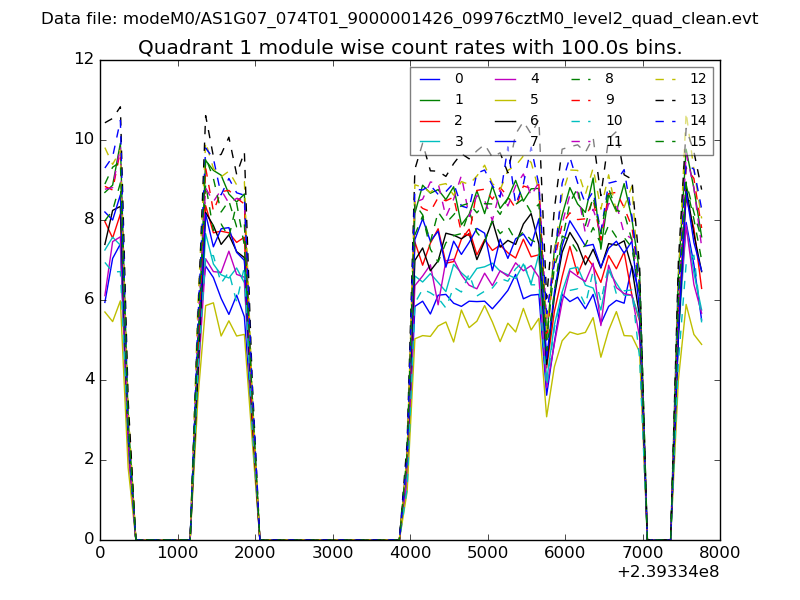 |
 |
| Module-wise count rates for Quadrant C Data is divided into 100 sec bins |
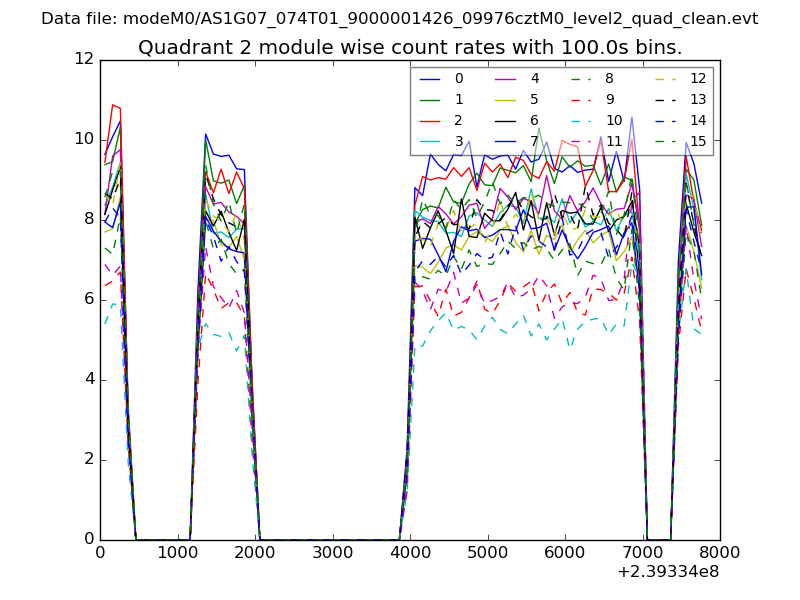 |
 |
| Module-wise count rates for Quadrant D Data is divided into 100 sec bins |
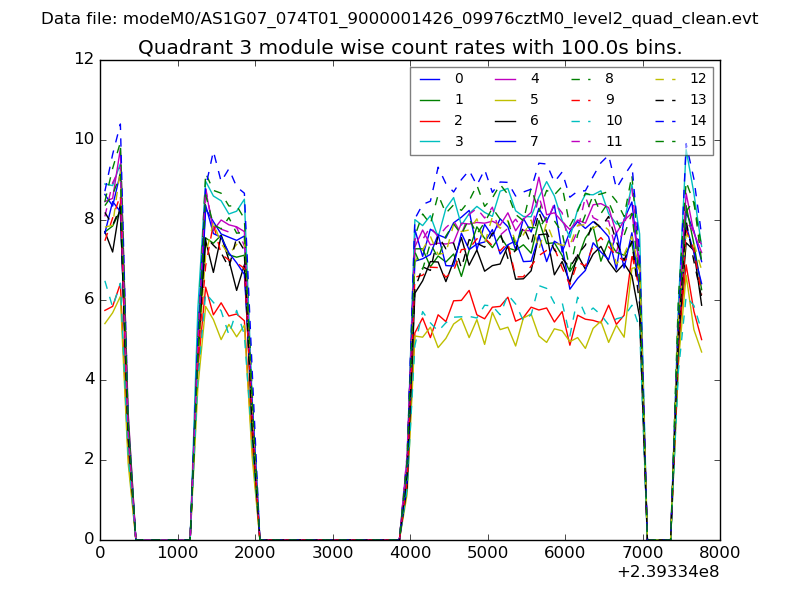 |
 |
| Parameter | Plot |
|---|---|
| CZT HV Monitor | 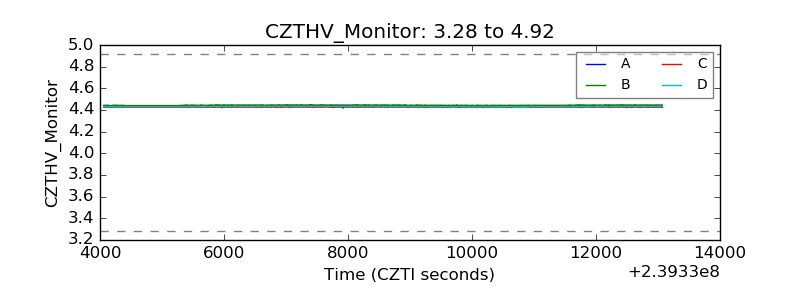 |
| D_VDD | 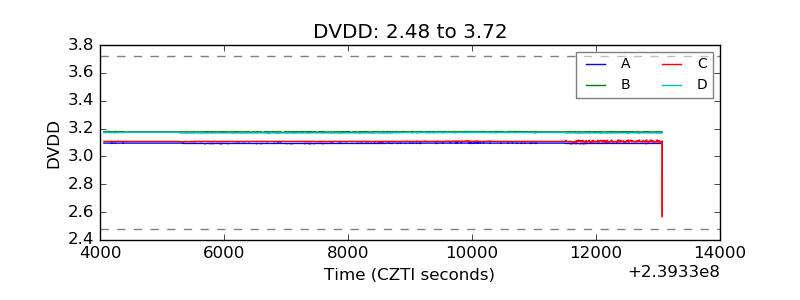 |
| Temperature 1 | 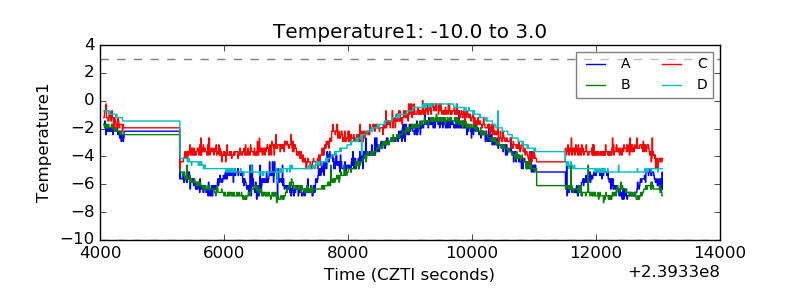 |
| Veto HV Monitor |  |
| Veto LLD | 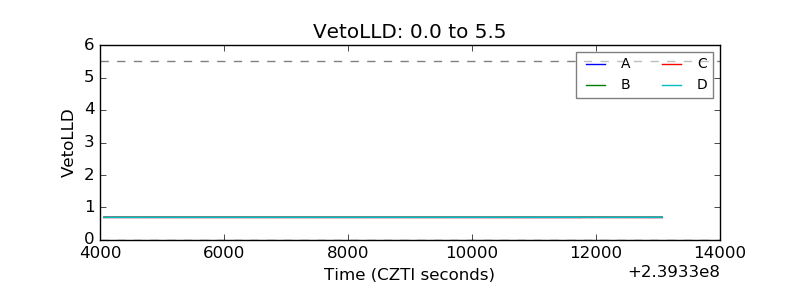 |
| Alpha Counter | 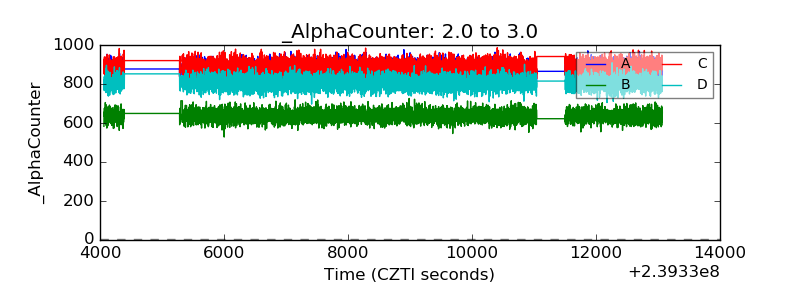 |
| _CPM_Rate | 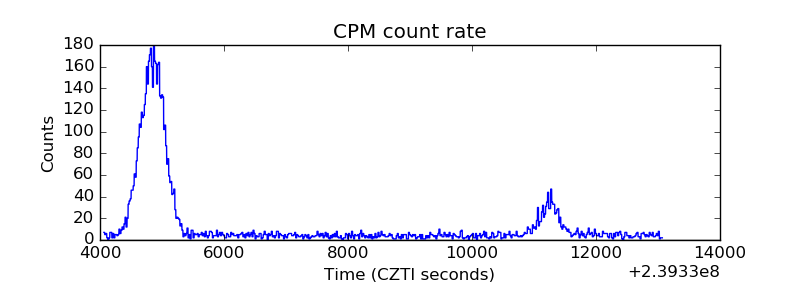 |
| CZT Counter | 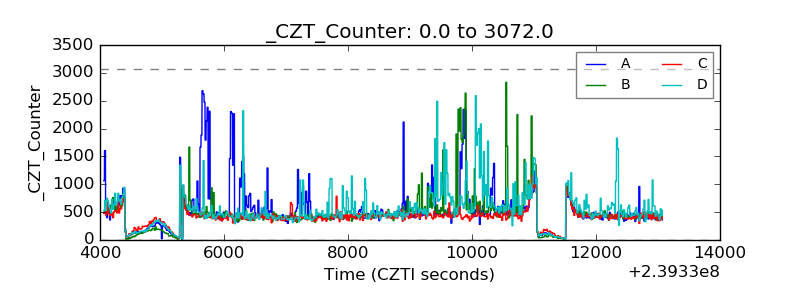 |
| +2.5 Volts monitor |  |
| +5 Volts monitor |  |
| _ROLL_ROT | 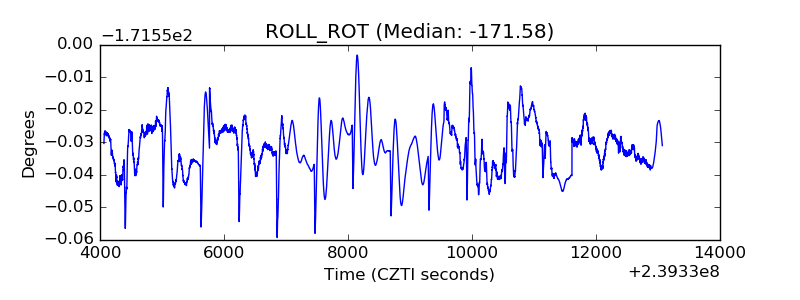 |
| _Roll_DEC | 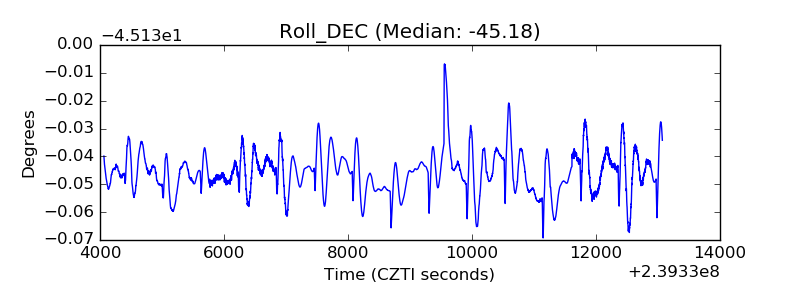 |
| _Roll_RA | 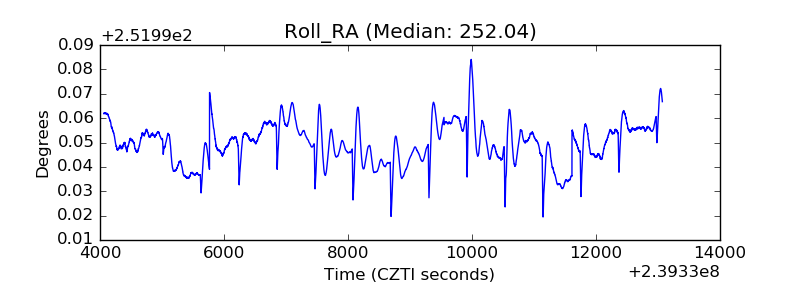 |
| Veto Counter | 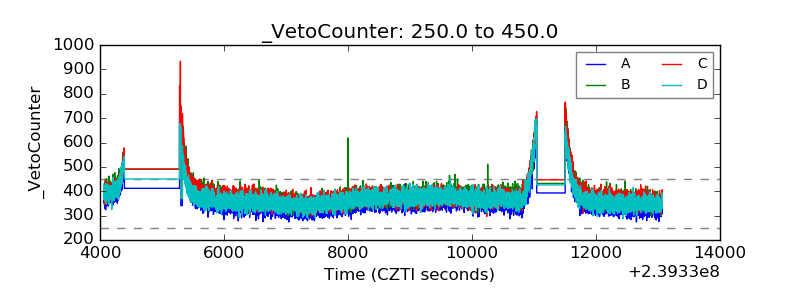 |