| Param | Original file | Final file |
|---|---|---|
| Filename | modeM0/AS1G07_074T01_9000001426_09977cztM0_level2.evt | modeM0/AS1G07_074T01_9000001426_09977cztM0_level2_quad_clean.evt |
| Size (bytes) | 684,659,520 | 96,131,520 |
| Size | 652.9 MB | 91.7 MB |
| Events in quadrant A | 6,639,210 | 576,389 |
| Events in quadrant B | 4,424,695 | 589,189 |
| Events in quadrant C | 3,809,653 | 596,311 |
| Events in quadrant D | 5,291,842 | 565,059 |
| Mode M9 | |||
|---|---|---|---|
| Quadrant | BADHDUFLAG | Total packets | Discarded packets |
| A | 0 | 7 | 0 |
| B | 0 | 7 | 0 |
| C | 0 | 7 | 0 |
| D | 0 | 7 | 0 |
| Mode M0 | |||
|---|---|---|---|
| Quadrant | BADHDUFLAG | Total packets | Discarded packets |
| A | 0 | 25613 | 47 |
| B | 0 | 18931 | 36 |
| C | 0 | 17543 | 14 |
| D | 0 | 21420 | 50 |
| Mode SS | |||
|---|---|---|---|
| Quadrant | BADHDUFLAG | Total packets | Discarded packets |
| A | 0 | 172 | 0 |
| B | 0 | 172 | 0 |
| C | 0 | 172 | 0 |
| D | 0 | 172 | 0 |
| Quadrant | Total seconds | Saturated seconds | Saturation percentage |
|---|---|---|---|
| A | 8402 | 1002 | 11.925732% |
| B | 8403 | 286 | 3.403546% |
| C | 8412 | 161 | 1.913932% |
| D | 8403 | 252 | 2.998929% |
Noise dominated data is calculated using 1-second bins in cleaned event files. If a bin has >2000 counts, and if more than 50% of those come from <1% of pixels, then it is considered to be noise-dominated and hence unusable.
| Quadrant | # 1 sec bins | Bins with >0 counts | Bins with >2000 counts | High rate bins dominated by noise | Noise dominated (total time) | Noise dominated (detector-on time) | Marked lightcurve |
|---|---|---|---|---|---|---|---|
| A | 9088 | 8418 | 736 | 736 | 8.10% | 8.74% | 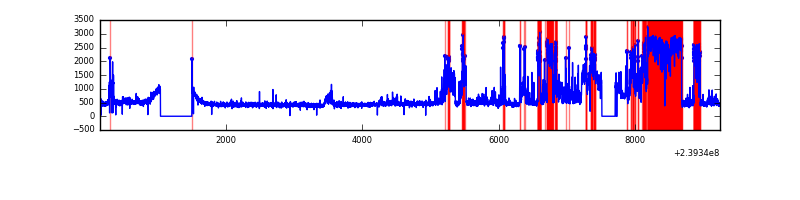 |
| B | 9088 | 8418 | 53 | 53 | 0.58% | 0.63% | 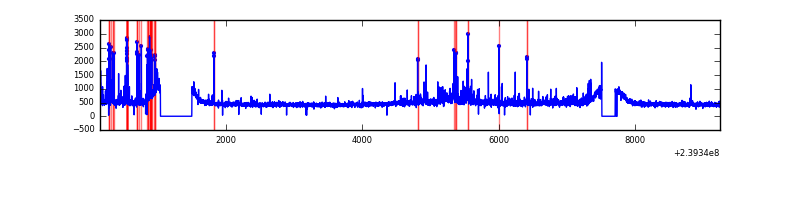 |
| C | 9088 | 8418 | 0 | 0 | 0.00% | 0.00% | 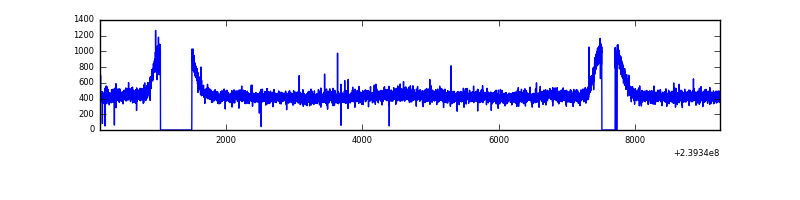 |
| D | 9088 | 8419 | 93 | 93 | 1.02% | 1.10% | 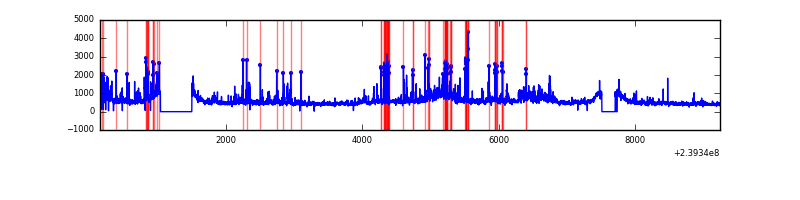 |
Top three noisy pixels from each quadrant. If the there are fewer than three noisy pixels in the level2.evt file, extra rows are filled as -1
| Pixel properties | Quadrant properties | ||||||
|---|---|---|---|---|---|---|---|
| Quadrant | DetID | PixID | Counts | Sigma | Mean | Median | Sigma |
| A | 13 | 251 | 2919507 | 14892.76 | 951 | 930 | 196.0 |
| A | 8 | 15 | 44057 | 220.07 | 951 | 930 | 196.0 |
| A | 0 | 226 | 8692 | 39.61 | 951 | 930 | 196.0 |
| B | 4 | 239 | 244652 | 1256.53 | 991 | 963 | 193.9 |
| B | 11 | 51 | 94820 | 483.95 | 991 | 963 | 193.9 |
| B | 4 | 81 | 89837 | 458.26 | 991 | 963 | 193.9 |
| C | 8 | 128 | 11444 | 45.94 | 969 | 974 | 227.9 |
| C | 14 | 67 | 8978 | 35.12 | 969 | 974 | 227.9 |
| C | 13 | 61 | 7274 | 27.64 | 969 | 974 | 227.9 |
| D | 8 | 195 | 520621 | 2103.56 | 950 | 925 | 247.1 |
| D | 2 | 16 | 348168 | 1405.53 | 950 | 925 | 247.1 |
| D | 1 | 52 | 322053 | 1299.82 | 950 | 925 | 247.1 |
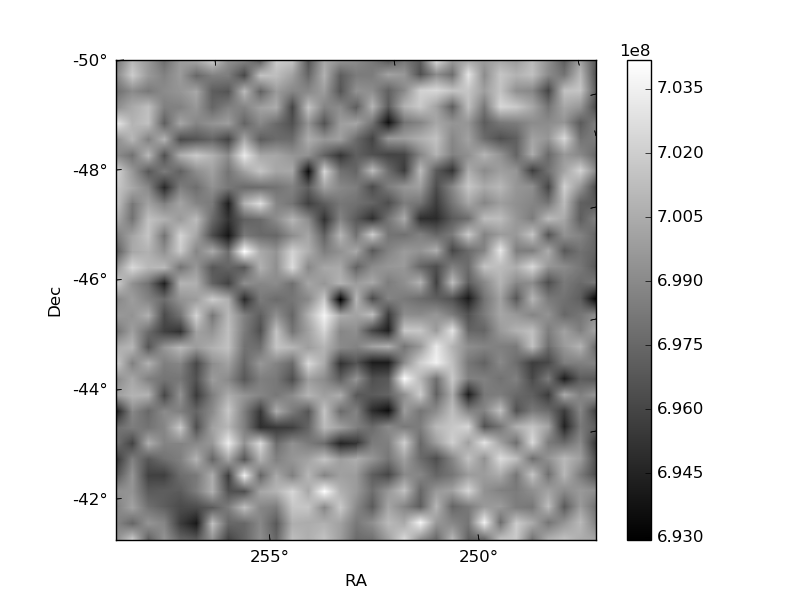
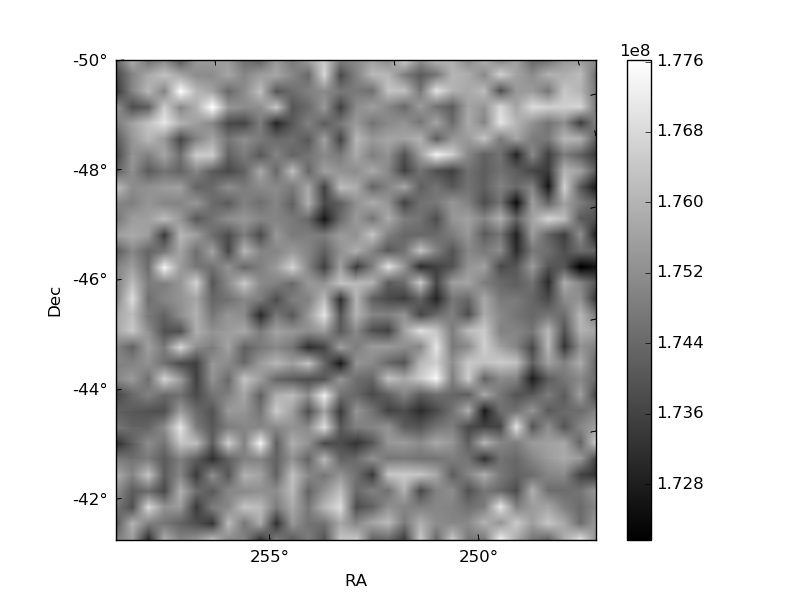
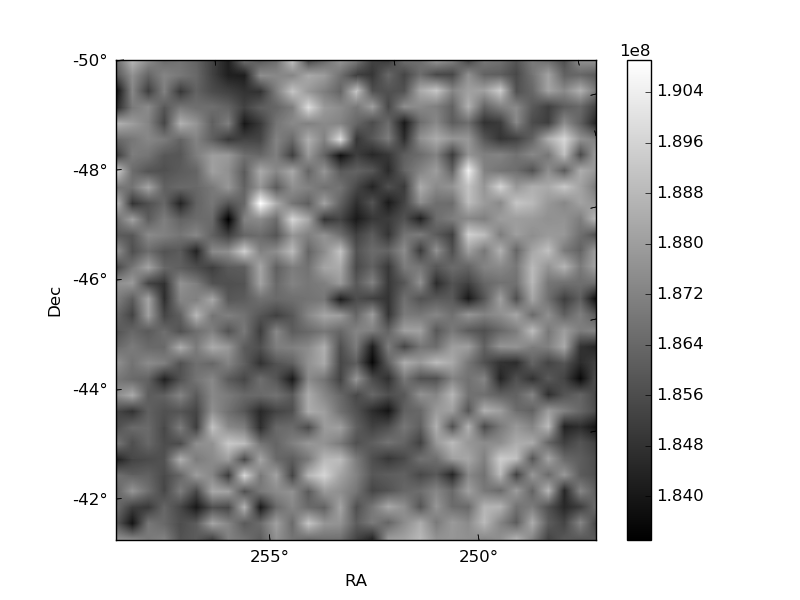
Histogram calculated using DETX and DETY for each event in the final _common_clean file
| Quadrant A | 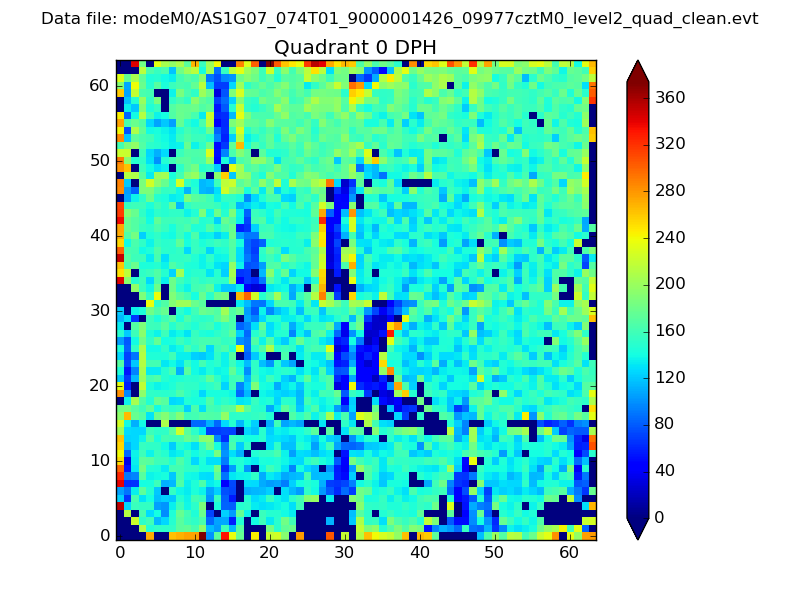 |
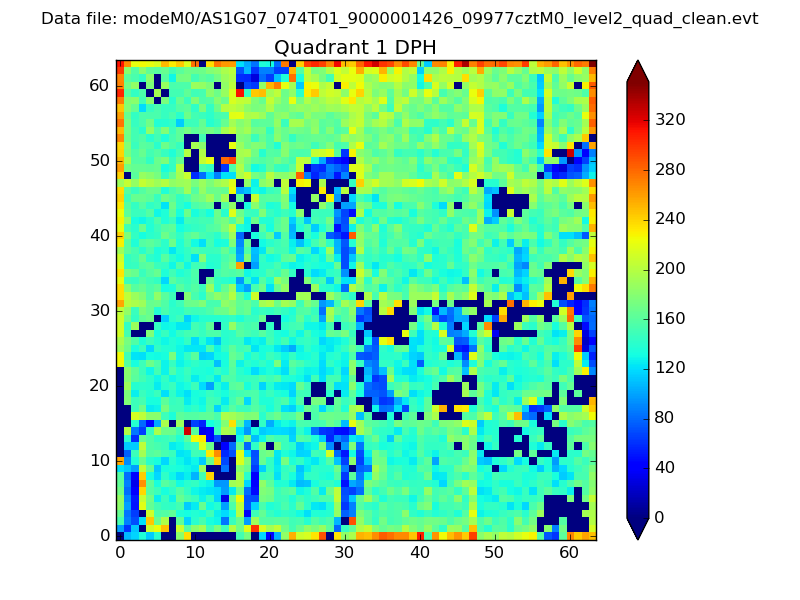 |
Quadrant B |
|---|---|---|---|
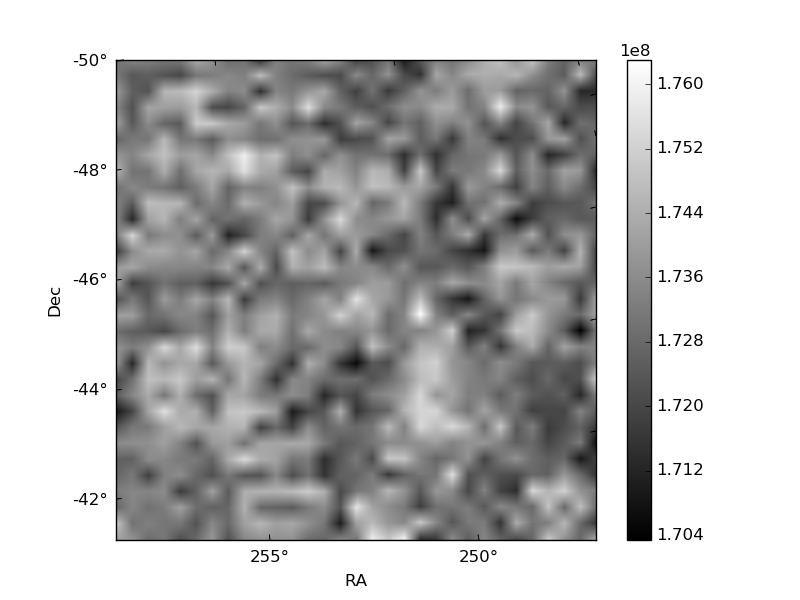
| Quadrant D | 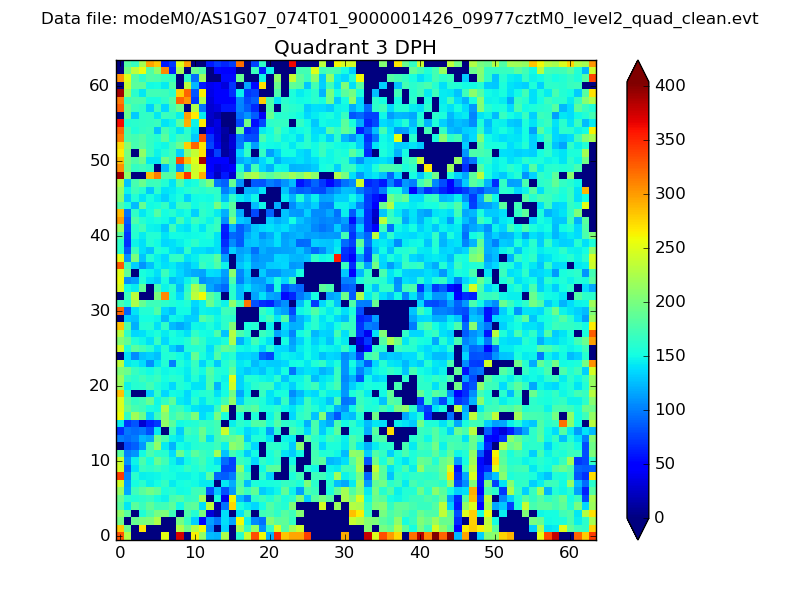 |
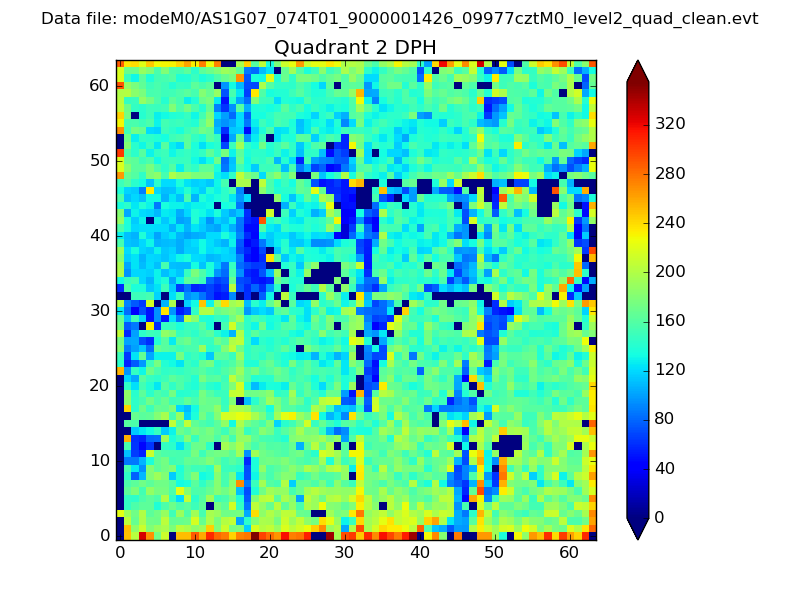 |
Quadrant C |
| Plot type | Count rate plots | Images |
|---|---|---|
| Comparison with Poisson distribution Blue bars denote a histogram of data divided into 1 sec bins. Red curve is a Poisson curve with rate = median count rate of data. |
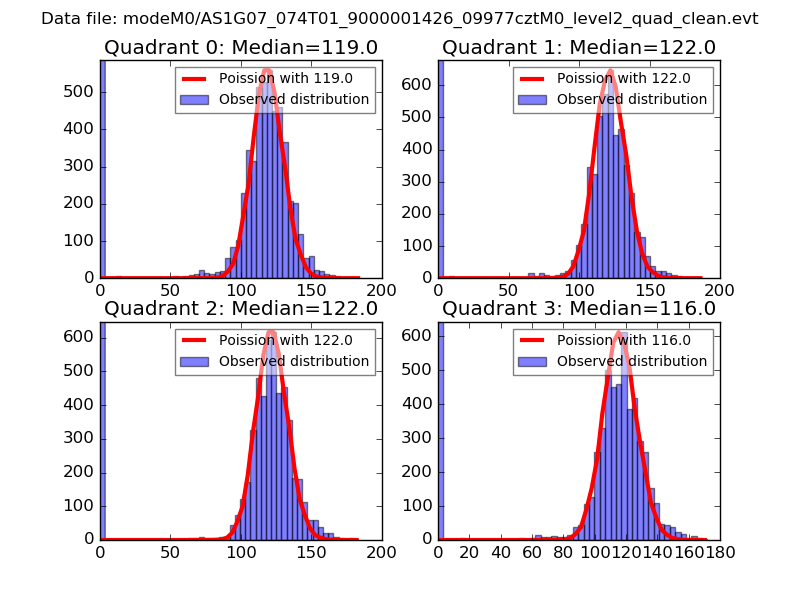 |
 |
| Quadrant-wise count rates Data is divided into 100 sec bins |
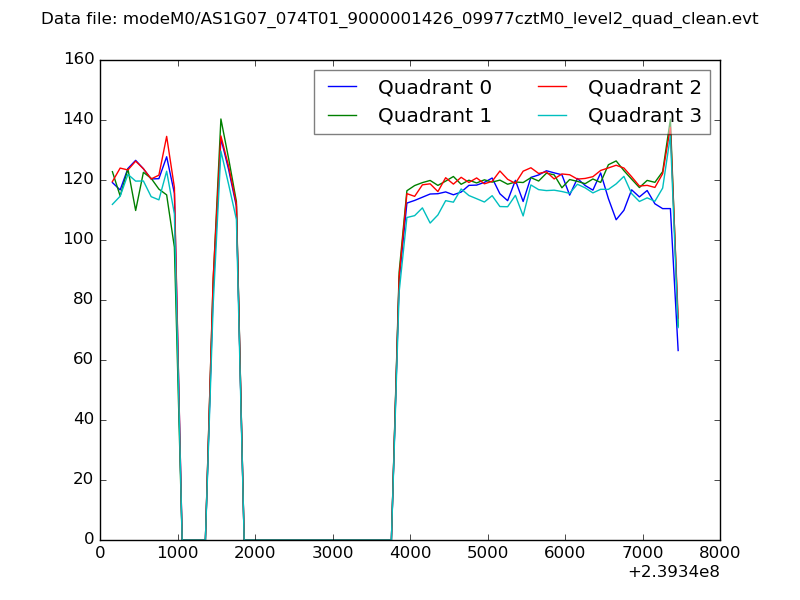 |
|
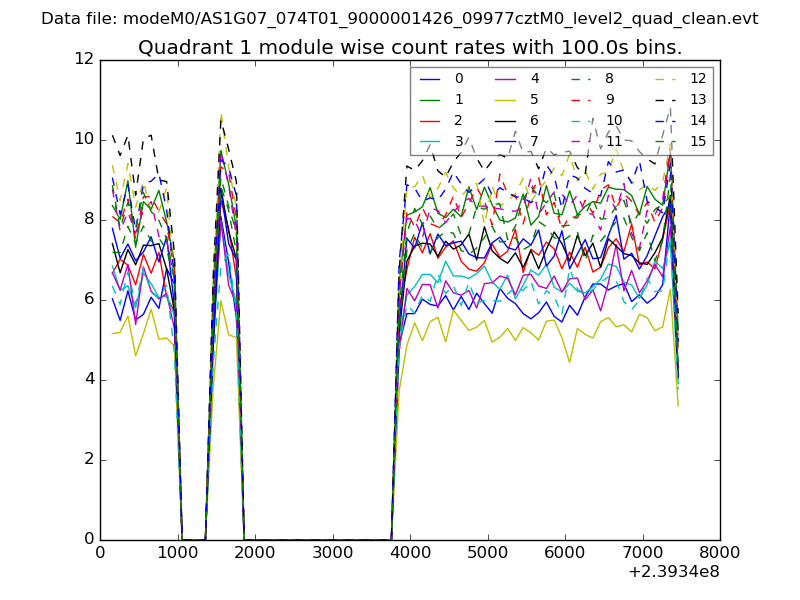
| Module-wise count rates for Quadrant A Data is divided into 100 sec bins |
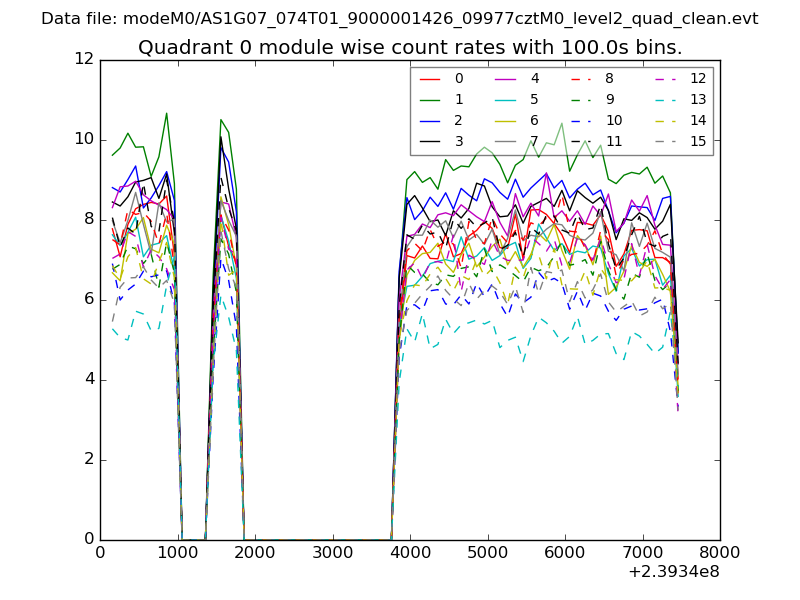 |
 |
| Module-wise count rates for Quadrant B Data is divided into 100 sec bins |
 |
 |
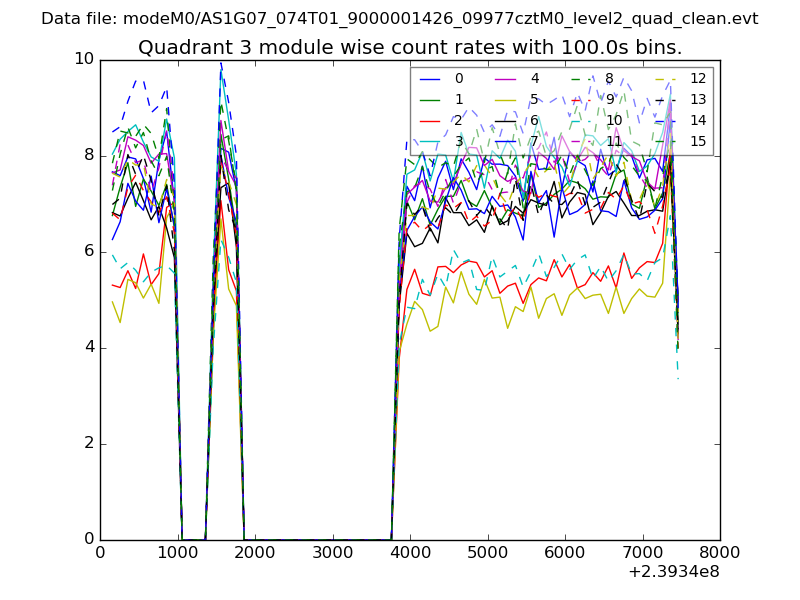
| Module-wise count rates for Quadrant C Data is divided into 100 sec bins |
 |
 |
| Module-wise count rates for Quadrant D Data is divided into 100 sec bins |
 |
 |
| Parameter | Plot |
|---|---|
| CZT HV Monitor |  |
| D_VDD | 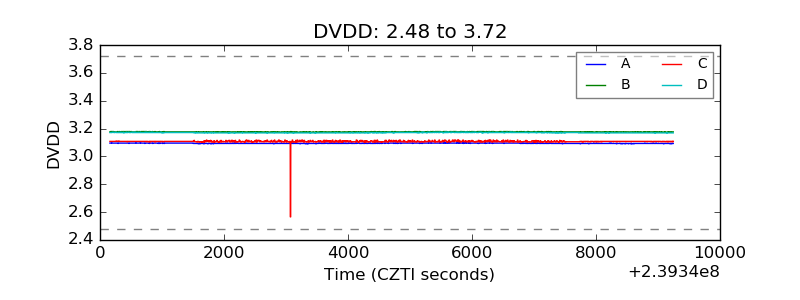 |
| Temperature 1 |  |
| Veto HV Monitor | 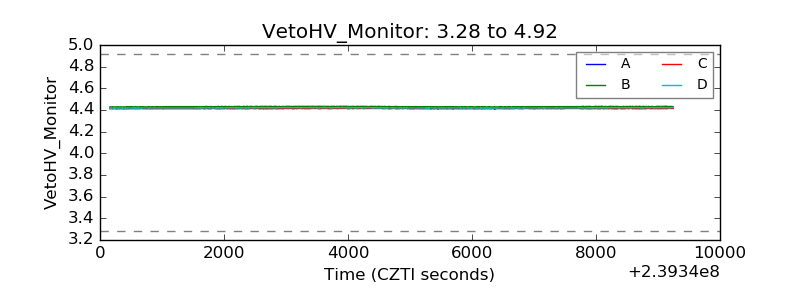 |
| Veto LLD | 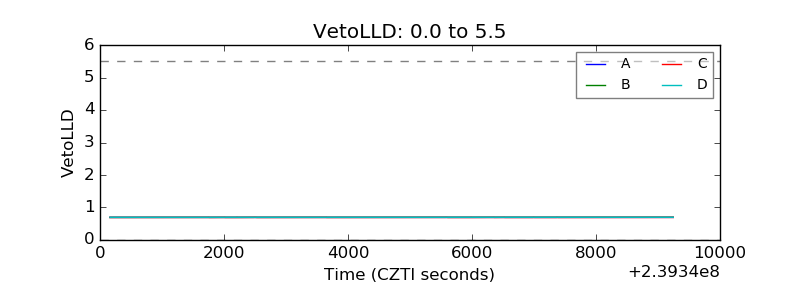 |
| Alpha Counter | 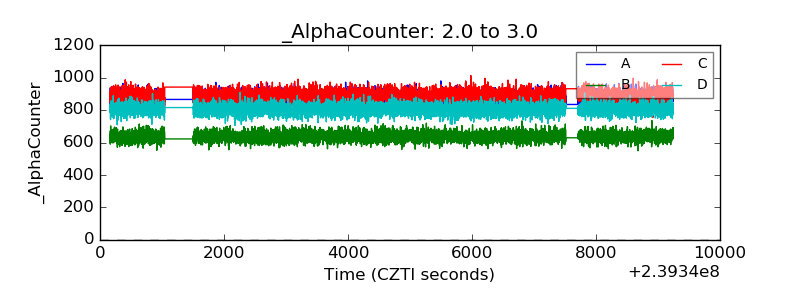 |
| _CPM_Rate | 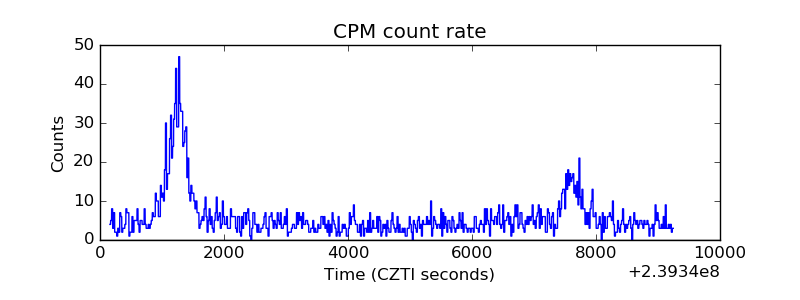 |
| CZT Counter | 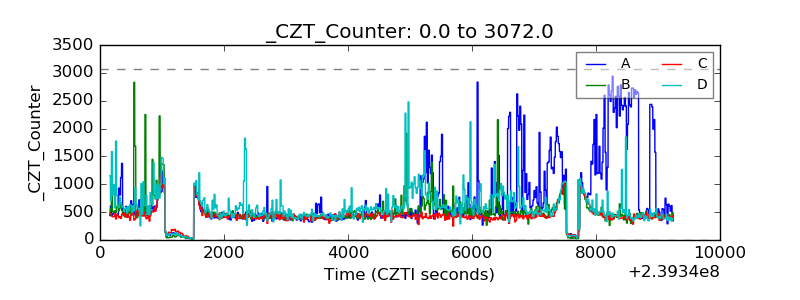 |
| +2.5 Volts monitor |  |
| +5 Volts monitor |  |
| _ROLL_ROT | 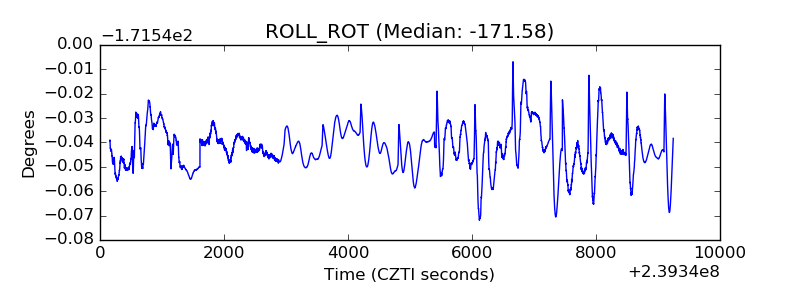 |
| _Roll_DEC | 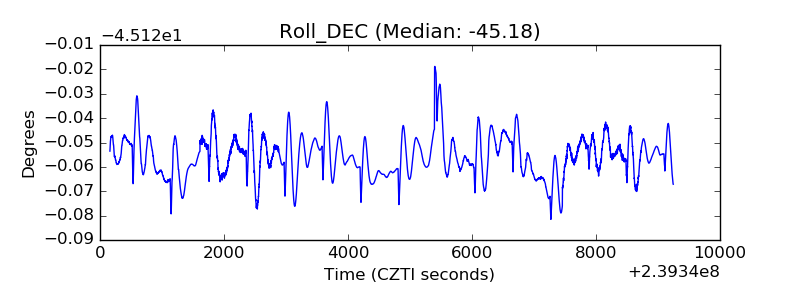 |
| _Roll_RA | 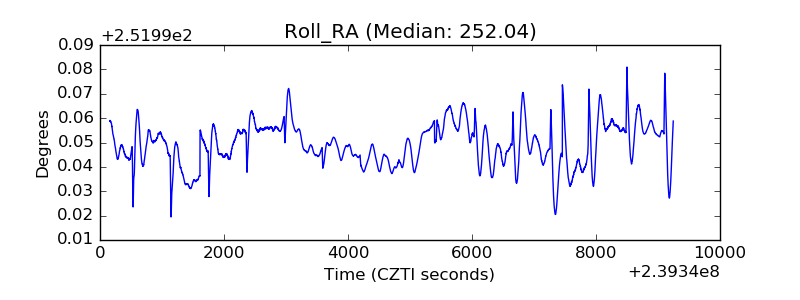 |
| Veto Counter | 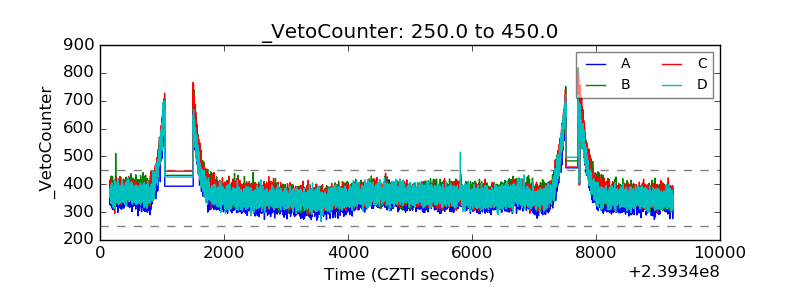 |