| Param | Original file | Final file |
|---|---|---|
| Filename | modeM0/AS1G07_074T01_9000001426_09978cztM0_level2.evt | modeM0/AS1G07_074T01_9000001426_09978cztM0_level2_quad_clean.evt |
| Size (bytes) | 698,160,960 | 78,834,240 |
| Size | 665.8 MB | 75.2 MB |
| Events in quadrant A | 8,767,002 | 439,851 |
| Events in quadrant B | 3,799,652 | 480,591 |
| Events in quadrant C | 3,505,278 | 481,422 |
| Events in quadrant D | 4,553,155 | 452,727 |
| Mode M9 | |||
|---|---|---|---|
| Quadrant | BADHDUFLAG | Total packets | Discarded packets |
| A | 0 | 4 | 0 |
| B | 0 | 4 | 0 |
| C | 0 | 4 | 0 |
| D | 0 | 4 | 0 |
| Mode M0 | |||
|---|---|---|---|
| Quadrant | BADHDUFLAG | Total packets | Discarded packets |
| A | 0 | 33004 | 1861 |
| B | 0 | 16832 | 314 |
| C | 0 | 16455 | 346 |
| D | 0 | 19287 | 424 |
| Mode SS | |||
|---|---|---|---|
| Quadrant | BADHDUFLAG | Total packets | Discarded packets |
| A | 0 | 162 | 8 |
| B | 0 | 162 | 4 |
| C | 0 | 162 | 4 |
| D | 0 | 162 | 4 |
| Quadrant | Total seconds | Saturated seconds | Saturation percentage |
|---|---|---|---|
| A | 7528 | 1981 | 26.315090% |
| B | 7709 | 284 | 3.684006% |
| C | 7692 | 252 | 3.276131% |
| D | 7672 | 361 | 4.705422% |
Noise dominated data is calculated using 1-second bins in cleaned event files. If a bin has >2000 counts, and if more than 50% of those come from <1% of pixels, then it is considered to be noise-dominated and hence unusable.
| Quadrant | # 1 sec bins | Bins with >0 counts | Bins with >2000 counts | High rate bins dominated by noise | Noise dominated (total time) | Noise dominated (detector-on time) | Marked lightcurve |
|---|---|---|---|---|---|---|---|
| A | 8313 | 7713 | 1554 | 1554 | 18.69% | 20.15% | 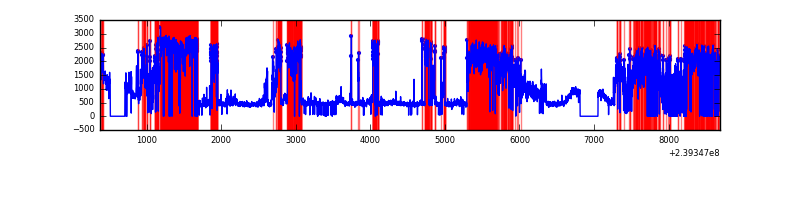 |
| B | 8314 | 7835 | 0 | 0 | 0.00% | 0.00% | 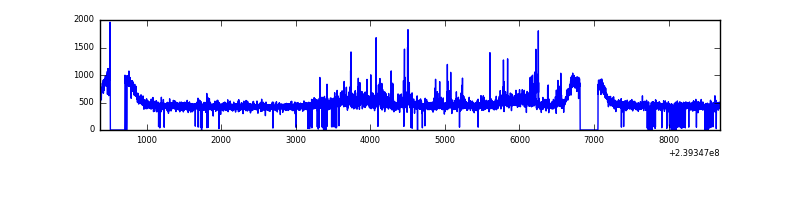 |
| C | 8314 | 7836 | 0 | 0 | 0.00% | 0.00% | 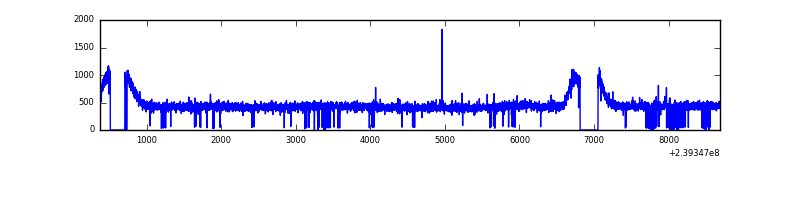 |
| D | 8314 | 7833 | 90 | 90 | 1.08% | 1.15% | 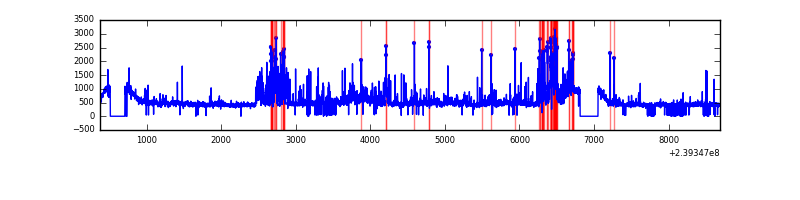 |
Top three noisy pixels from each quadrant. If the there are fewer than three noisy pixels in the level2.evt file, extra rows are filled as -1
| Pixel properties | Quadrant properties | ||||||
|---|---|---|---|---|---|---|---|
| Quadrant | DetID | PixID | Counts | Sigma | Mean | Median | Sigma |
| A | 13 | 251 | 5476794 | 31506.76 | 839 | 816 | 173.8 |
| A | 8 | 15 | 46854 | 264.89 | 839 | 816 | 173.8 |
| A | 15 | 174 | 13067 | 70.49 | 839 | 816 | 173.8 |
| B | 0 | 214 | 78427 | 432.61 | 919 | 893 | 179.2 |
| B | 11 | 51 | 70378 | 387.7 | 919 | 893 | 179.2 |
| B | 12 | 111 | 19900 | 106.05 | 919 | 893 | 179.2 |
| C | 13 | 61 | 6668 | 27.42 | 896 | 900 | 210.3 |
| C | 14 | 67 | 4643 | 17.8 | 896 | 900 | 210.3 |
| C | 14 | 234 | 4534 | 17.28 | 896 | 900 | 210.3 |
| D | 2 | 152 | 456713 | 2060.0 | 878 | 851 | 221.3 |
| D | 2 | 16 | 236335 | 1064.13 | 878 | 851 | 221.3 |
| D | 2 | 33 | 184765 | 831.09 | 878 | 851 | 221.3 |
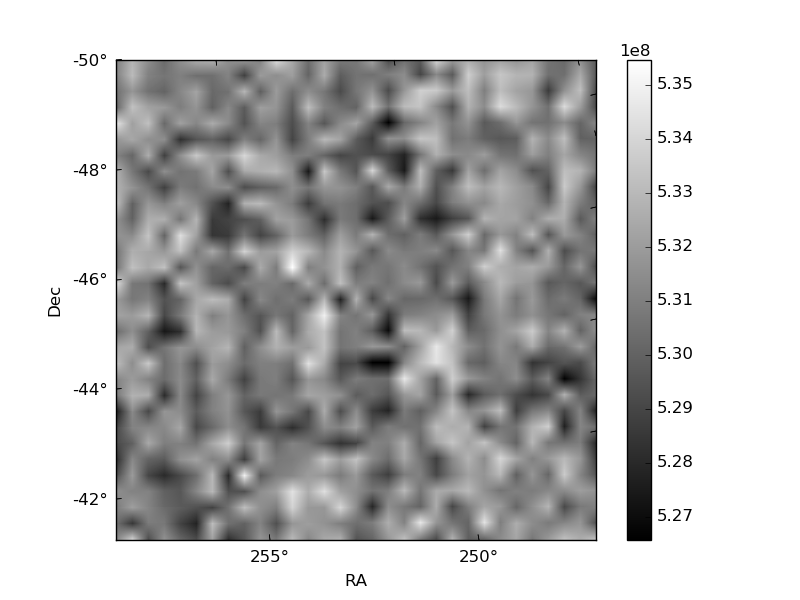
Histogram calculated using DETX and DETY for each event in the final _common_clean file
| Quadrant A | 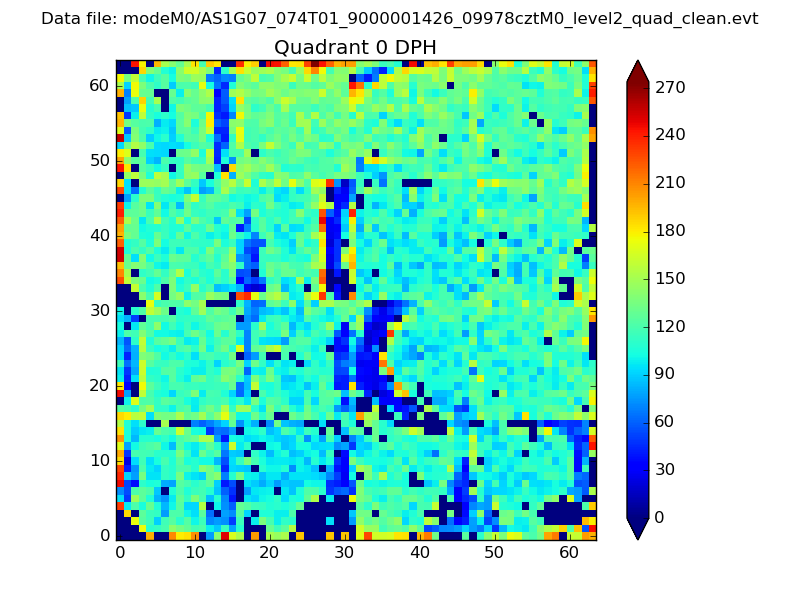 |
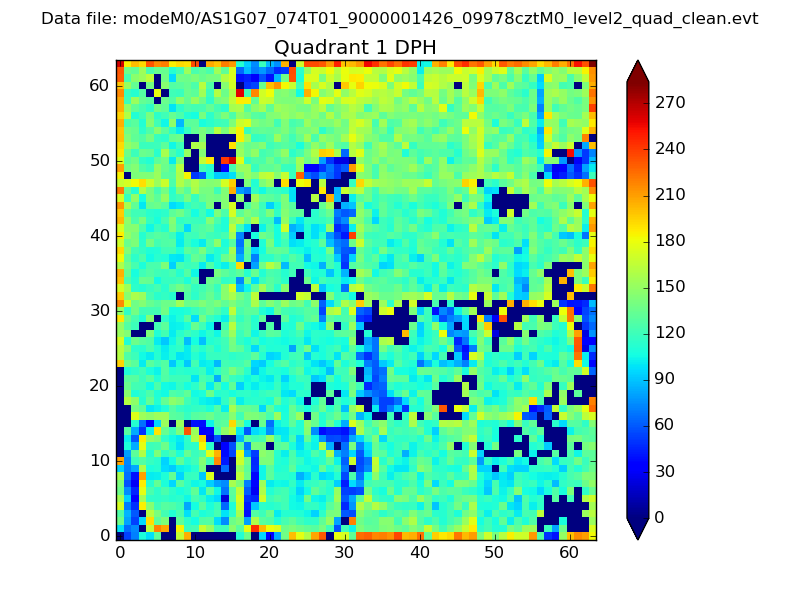 |
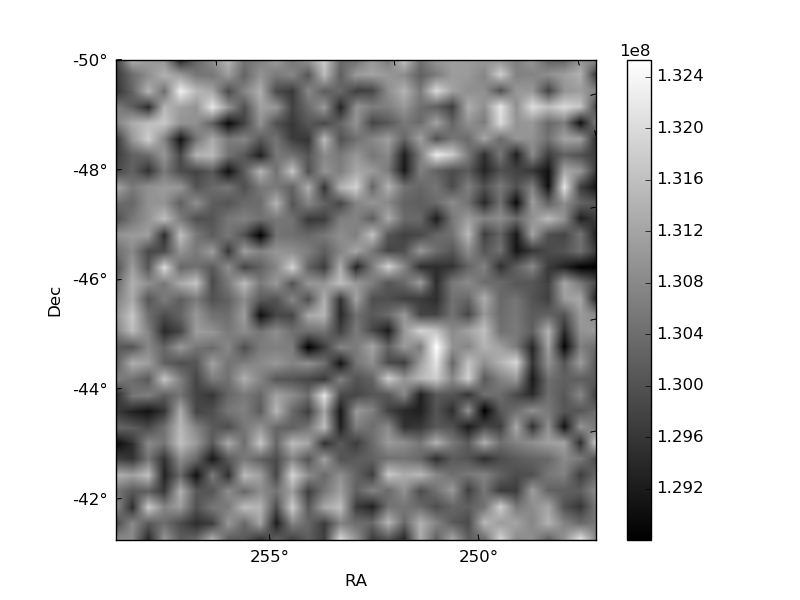
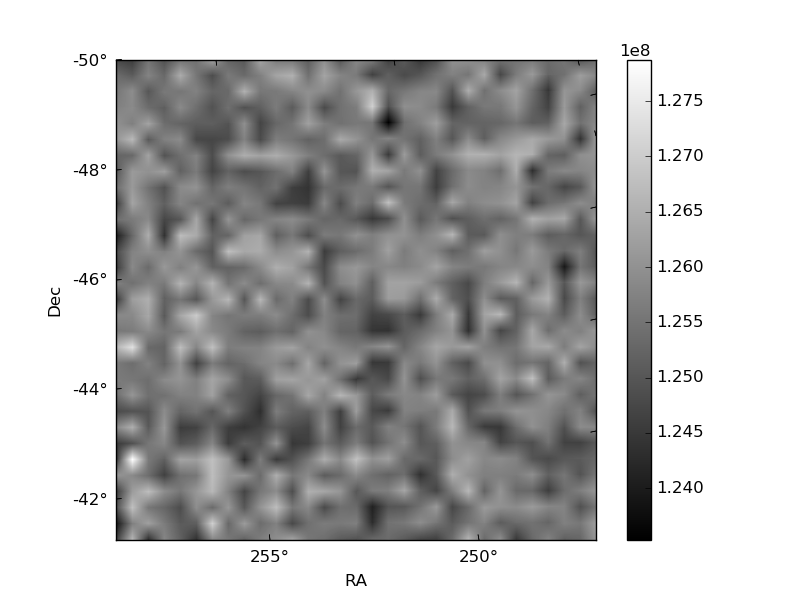
Quadrant B |
|---|---|---|---|
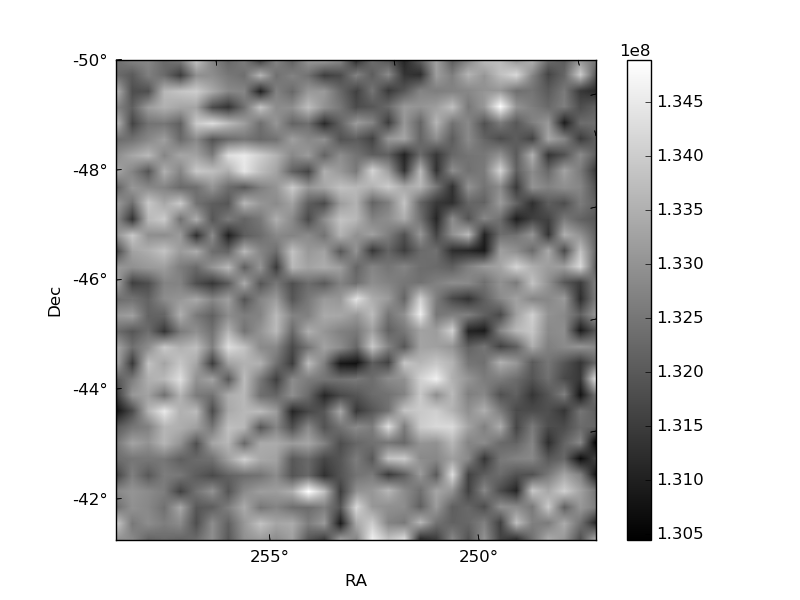
| Quadrant D | 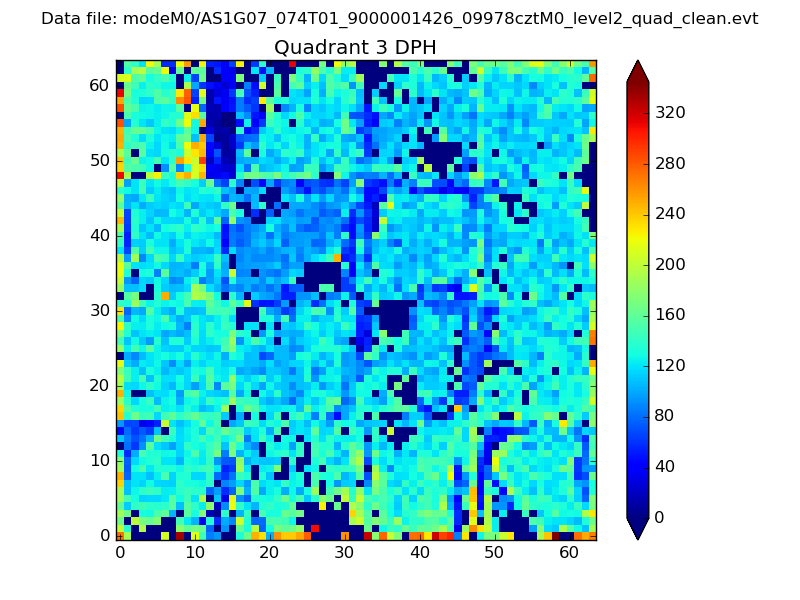 |
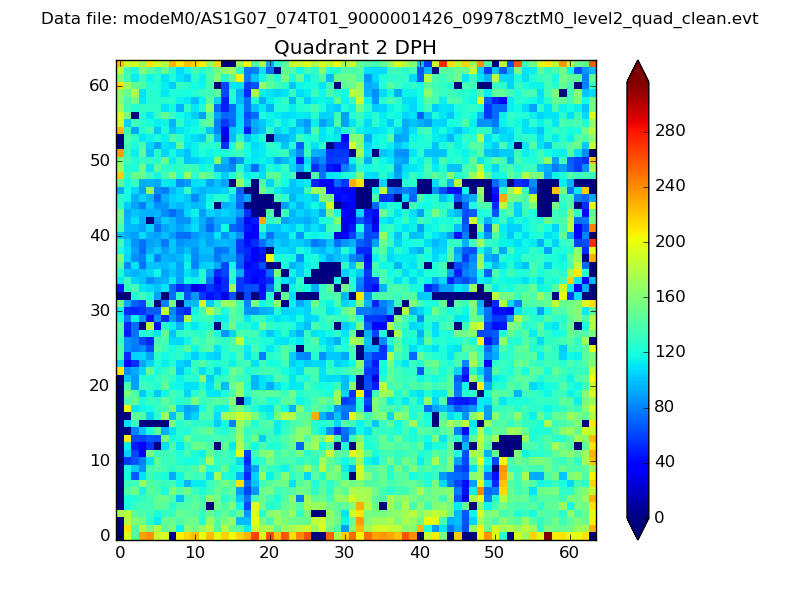 |
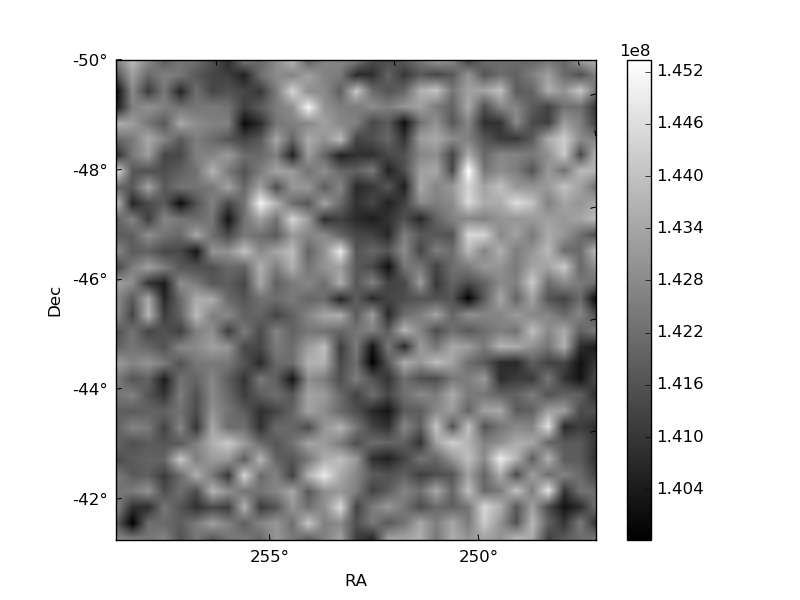
Quadrant C |
| Plot type | Count rate plots | Images |
|---|---|---|
| Comparison with Poisson distribution Blue bars denote a histogram of data divided into 1 sec bins. Red curve is a Poisson curve with rate = median count rate of data. |
 |
 |
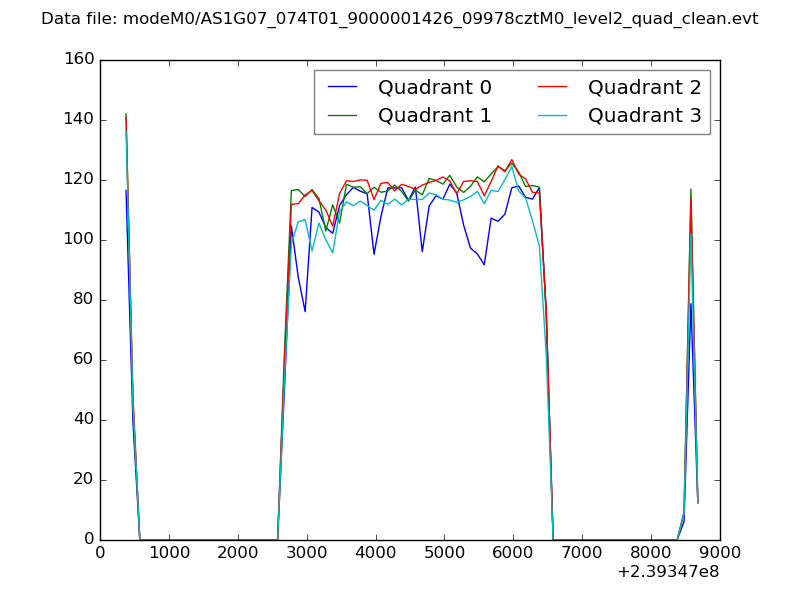
| Quadrant-wise count rates Data is divided into 100 sec bins |
 |
|
| Module-wise count rates for Quadrant A Data is divided into 100 sec bins |
 |
 |
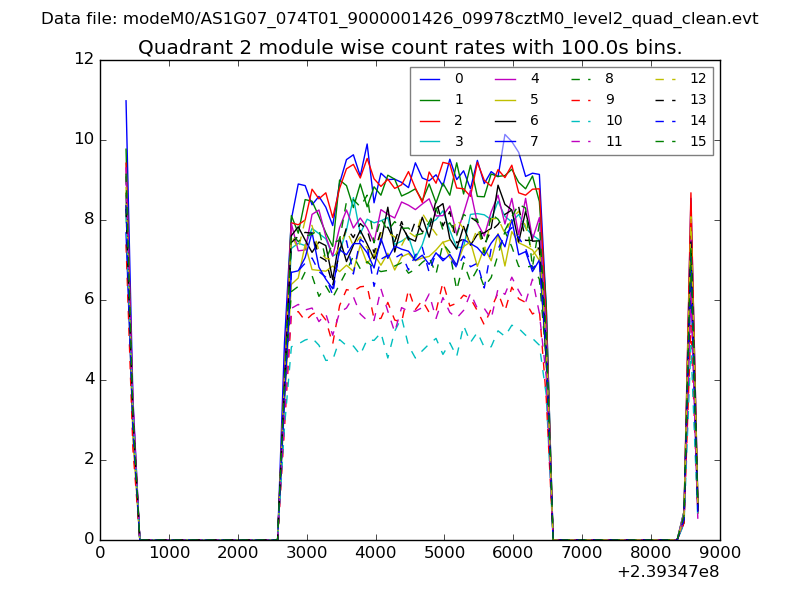
| Module-wise count rates for Quadrant B Data is divided into 100 sec bins |
 |
 |
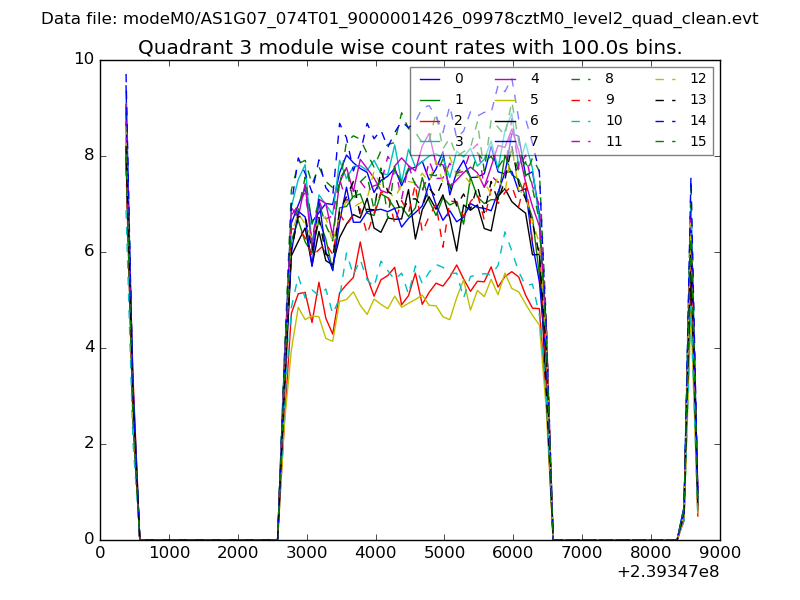
| Module-wise count rates for Quadrant C Data is divided into 100 sec bins |
 |
 |
| Module-wise count rates for Quadrant D Data is divided into 100 sec bins |
 |
 |
| Parameter | Plot |
|---|---|
| CZT HV Monitor | 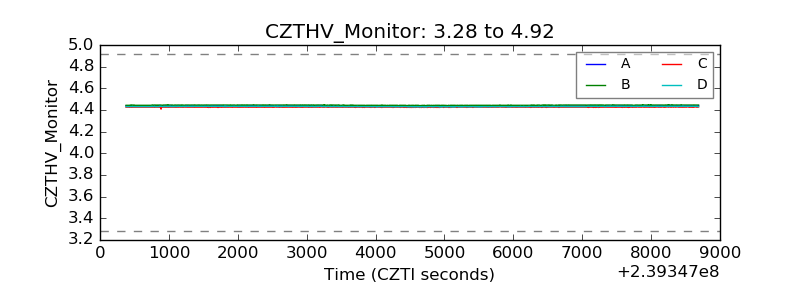 |
| D_VDD | 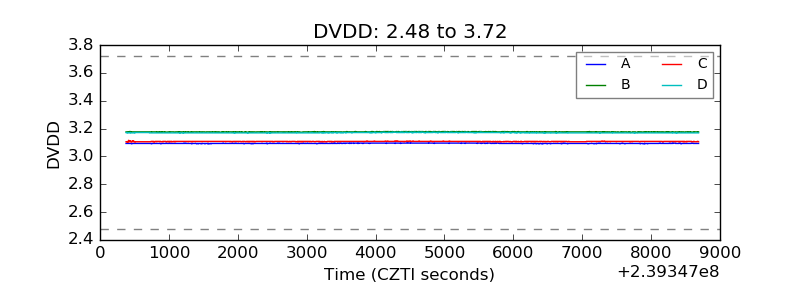 |
| Temperature 1 |  |
| Veto HV Monitor | 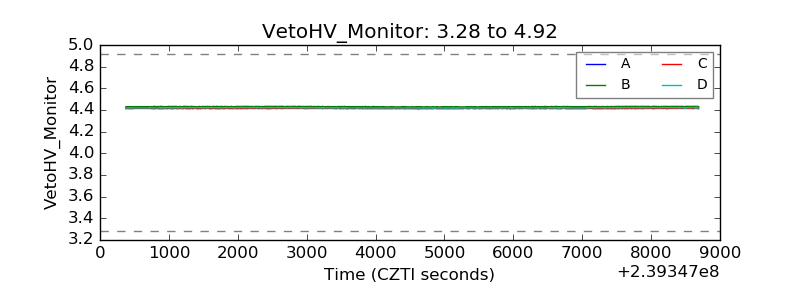 |
| Veto LLD |  |
| Alpha Counter | 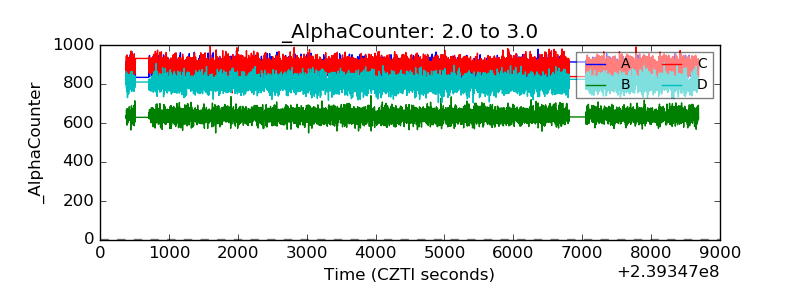 |
| _CPM_Rate | 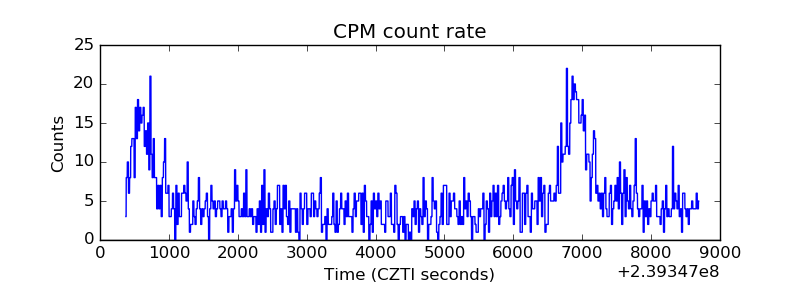 |
| CZT Counter | 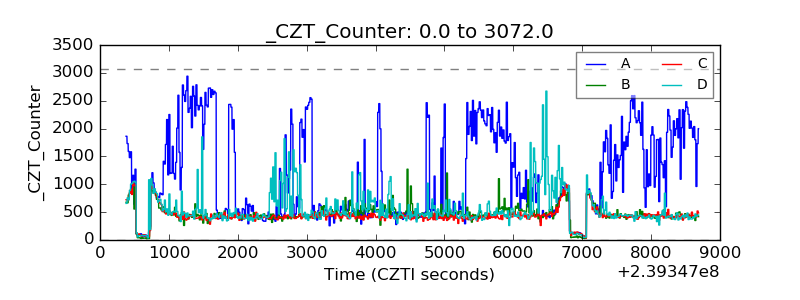 |
| +2.5 Volts monitor |  |
| +5 Volts monitor |  |
| _ROLL_ROT |  |
| _Roll_DEC | 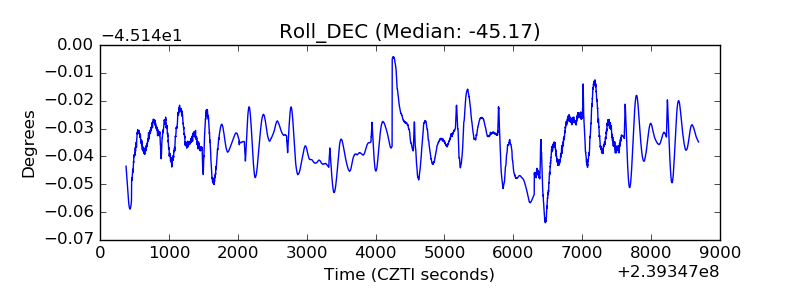 |
| _Roll_RA | 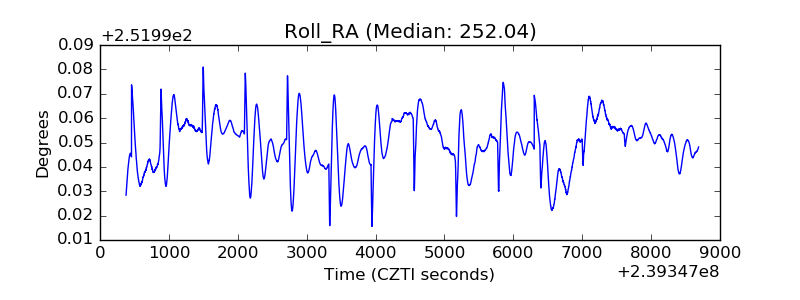 |
| Veto Counter | 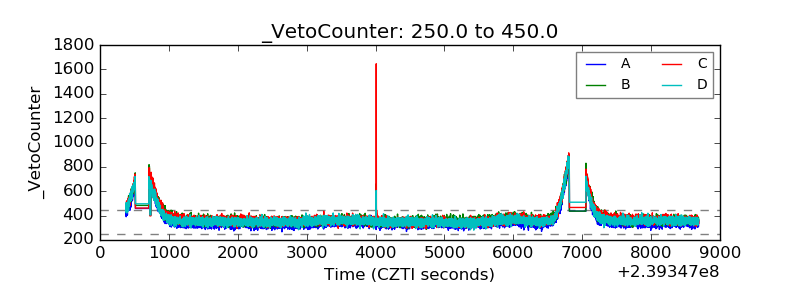 |