| Param | Original file | Final file |
|---|---|---|
| Filename | modeM0/AS1G07_074T01_9000001426_09982cztM0_level2.evt | modeM0/AS1G07_074T01_9000001426_09982cztM0_level2_quad_clean.evt |
| Size (bytes) | 509,022,720 | 87,560,640 |
| Size | 485.4 MB | 83.5 MB |
| Events in quadrant A | 4,173,040 | 556,232 |
| Events in quadrant B | 3,539,171 | 565,355 |
| Events in quadrant C | 2,637,172 | 570,107 |
| Events in quadrant D | 4,657,175 | 538,217 |
| Mode M9 | |||
|---|---|---|---|
| Quadrant | BADHDUFLAG | Total packets | Discarded packets |
| A | 0 | 10 | 0 |
| B | 0 | 10 | 0 |
| C | 0 | 10 | 0 |
| D | 0 | 10 | 0 |
| Mode M0 | |||
|---|---|---|---|
| Quadrant | BADHDUFLAG | Total packets | Discarded packets |
| A | 0 | 16613 | 59 |
| B | 0 | 14718 | 40 |
| C | 0 | 12281 | 15 |
| D | 0 | 18254 | 69 |
| Mode SS | |||
|---|---|---|---|
| Quadrant | BADHDUFLAG | Total packets | Discarded packets |
| A | 0 | 122 | 0 |
| B | 0 | 122 | 0 |
| C | 0 | 122 | 0 |
| D | 0 | 122 | 0 |
| Quadrant | Total seconds | Saturated seconds | Saturation percentage |
|---|---|---|---|
| A | 6032 | 342 | 5.669761% |
| B | 6036 | 162 | 2.683897% |
| C | 6042 | 28 | 0.463423% |
| D | 6030 | 185 | 3.067993% |
Noise dominated data is calculated using 1-second bins in cleaned event files. If a bin has >2000 counts, and if more than 50% of those come from <1% of pixels, then it is considered to be noise-dominated and hence unusable.
| Quadrant | # 1 sec bins | Bins with >0 counts | Bins with >2000 counts | High rate bins dominated by noise | Noise dominated (total time) | Noise dominated (detector-on time) | Marked lightcurve |
|---|---|---|---|---|---|---|---|
| A | 7044 | 6048 | 148 | 148 | 2.10% | 2.45% | 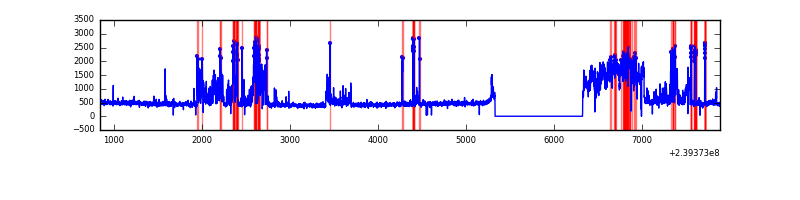 |
| B | 7044 | 6048 | 113 | 113 | 1.60% | 1.87% | 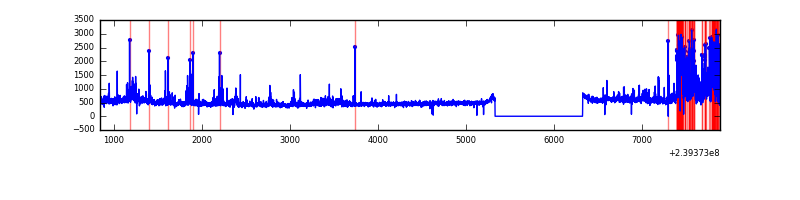 |
| C | 7044 | 6049 | 0 | 0 | 0.00% | 0.00% | 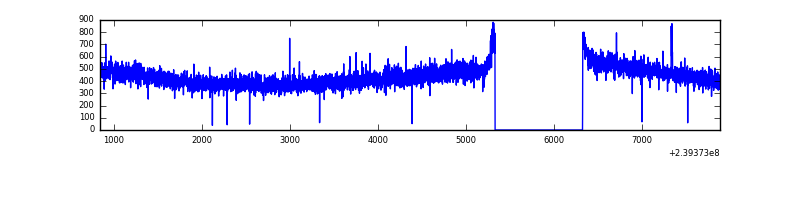 |
| D | 7044 | 6047 | 102 | 102 | 1.45% | 1.69% | 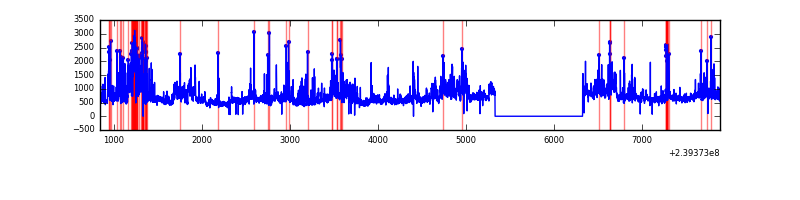 |
Top three noisy pixels from each quadrant. If the there are fewer than three noisy pixels in the level2.evt file, extra rows are filled as -1
| Pixel properties | Quadrant properties | ||||||
|---|---|---|---|---|---|---|---|
| Quadrant | DetID | PixID | Counts | Sigma | Mean | Median | Sigma |
| A | 13 | 251 | 1339323 | 9477.65 | 693 | 678 | 141.2 |
| A | 15 | 174 | 108651 | 764.45 | 693 | 678 | 141.2 |
| A | 8 | 15 | 48334 | 337.41 | 693 | 678 | 141.2 |
| B | 0 | 85 | 378537 | 2794.58 | 697 | 683 | 135.2 |
| B | 0 | 214 | 171983 | 1266.92 | 697 | 683 | 135.2 |
| B | 4 | 239 | 67634 | 495.16 | 697 | 683 | 135.2 |
| C | 13 | 61 | 4999 | 27.42 | 673 | 676 | 157.7 |
| C | 8 | 208 | 4913 | 26.87 | 673 | 676 | 157.7 |
| C | 8 | 222 | 3357 | 17.0 | 673 | 676 | 157.7 |
| D | 1 | 52 | 699863 | 3912.97 | 664 | 648 | 178.7 |
| D | 2 | 16 | 661514 | 3698.36 | 664 | 648 | 178.7 |
| D | 8 | 195 | 546039 | 3052.13 | 664 | 648 | 178.7 |
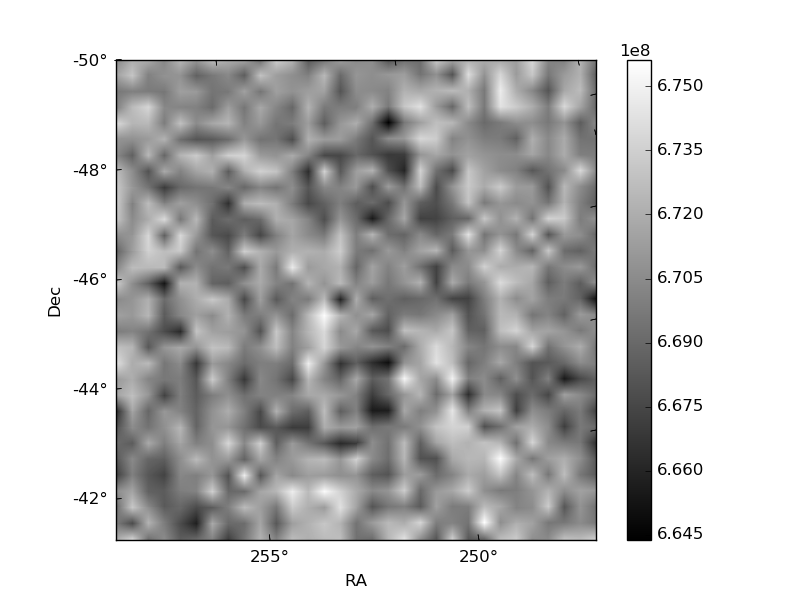
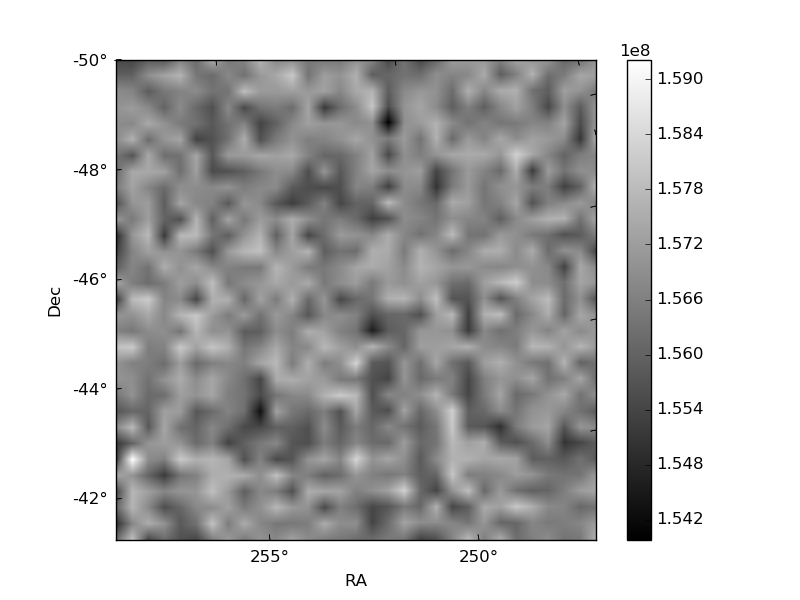
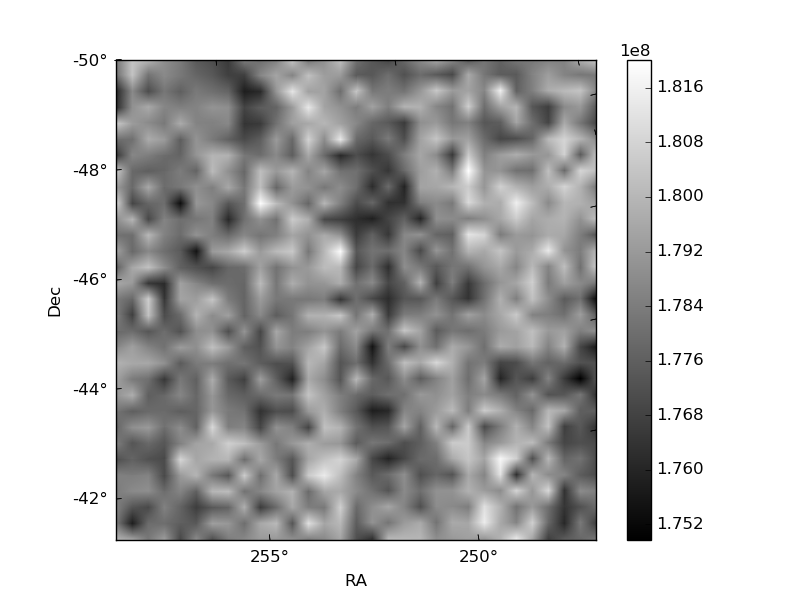
Histogram calculated using DETX and DETY for each event in the final _common_clean file
| Quadrant A | 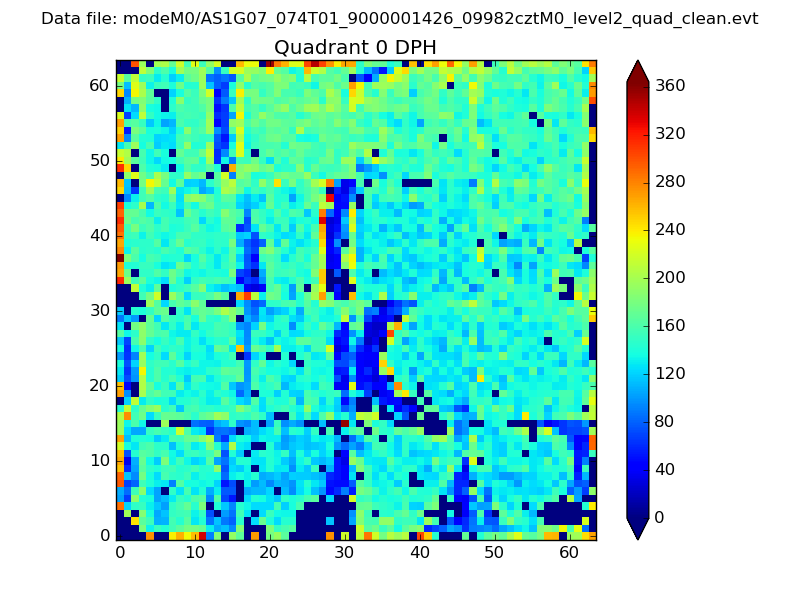 |
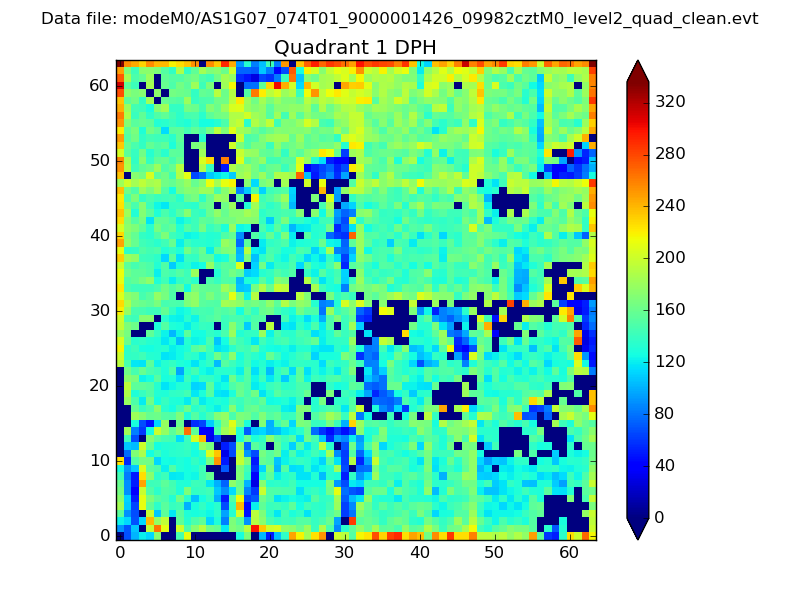 |
Quadrant B |
|---|---|---|---|
| Quadrant D | 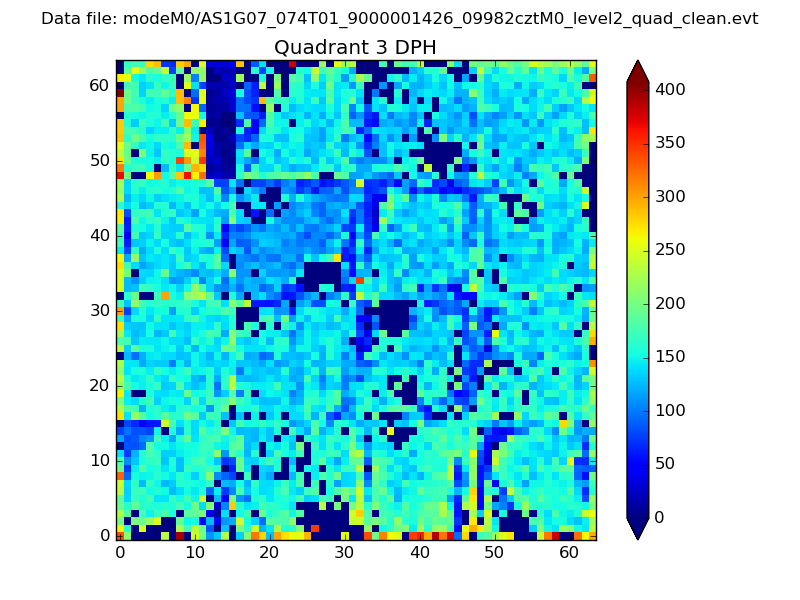 |
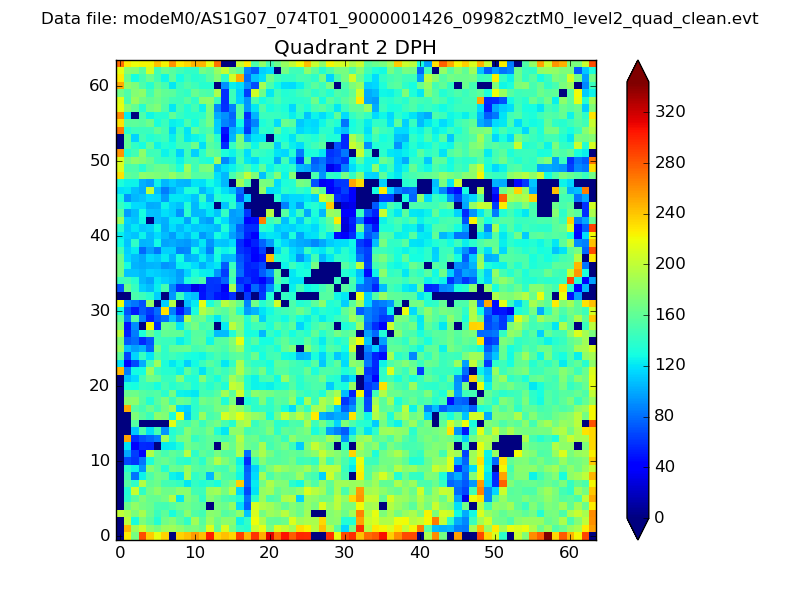 |
Quadrant C |
| Plot type | Count rate plots | Images |
|---|---|---|
| Comparison with Poisson distribution Blue bars denote a histogram of data divided into 1 sec bins. Red curve is a Poisson curve with rate = median count rate of data. |
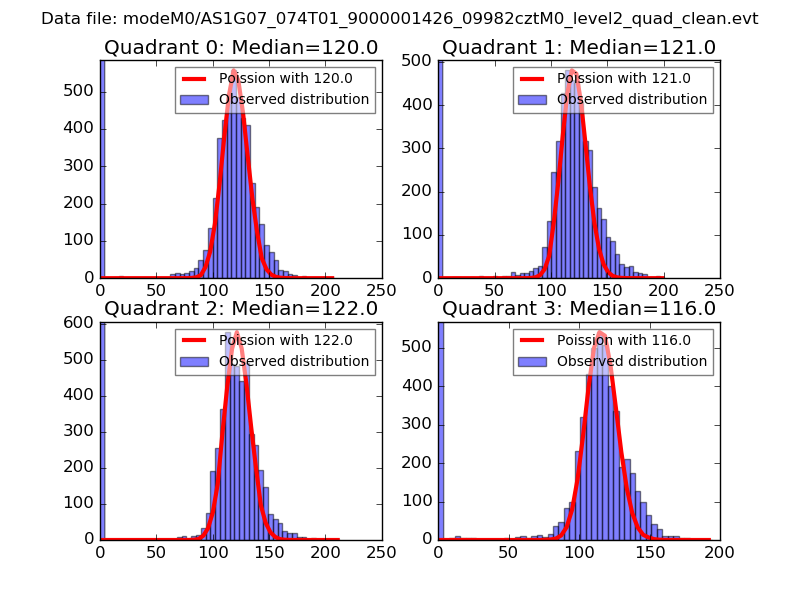 |
 |
| Quadrant-wise count rates Data is divided into 100 sec bins |
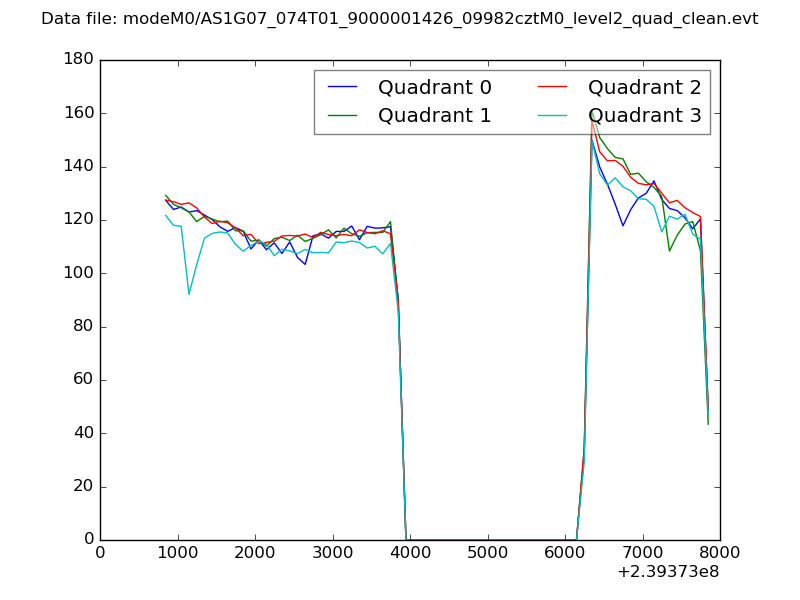 |
|
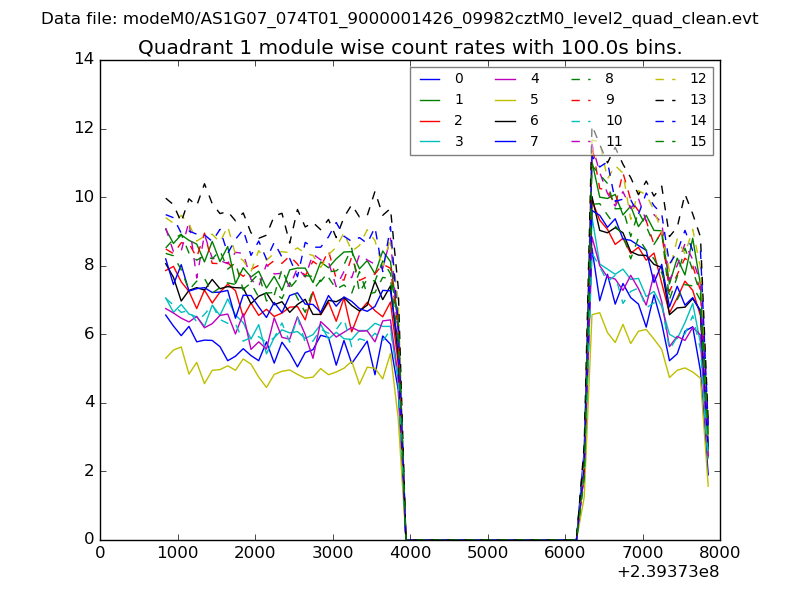
| Module-wise count rates for Quadrant A Data is divided into 100 sec bins |
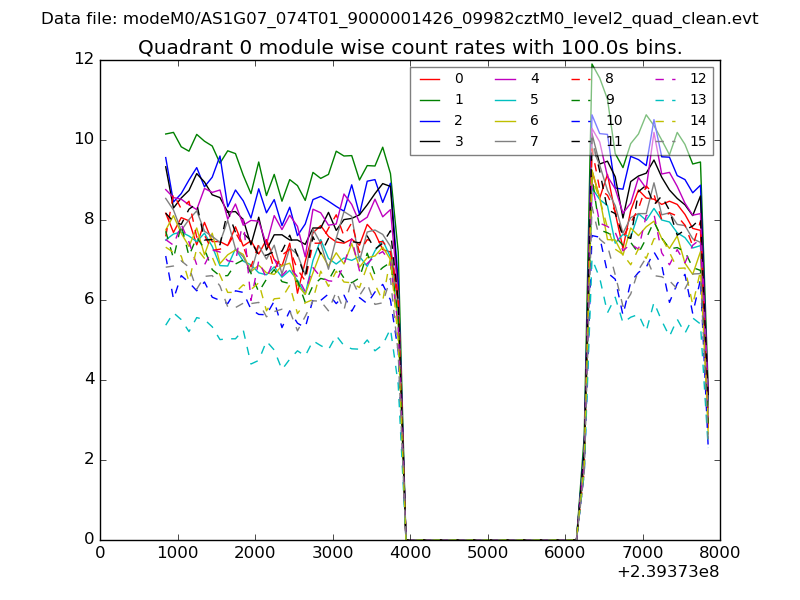 |
 |
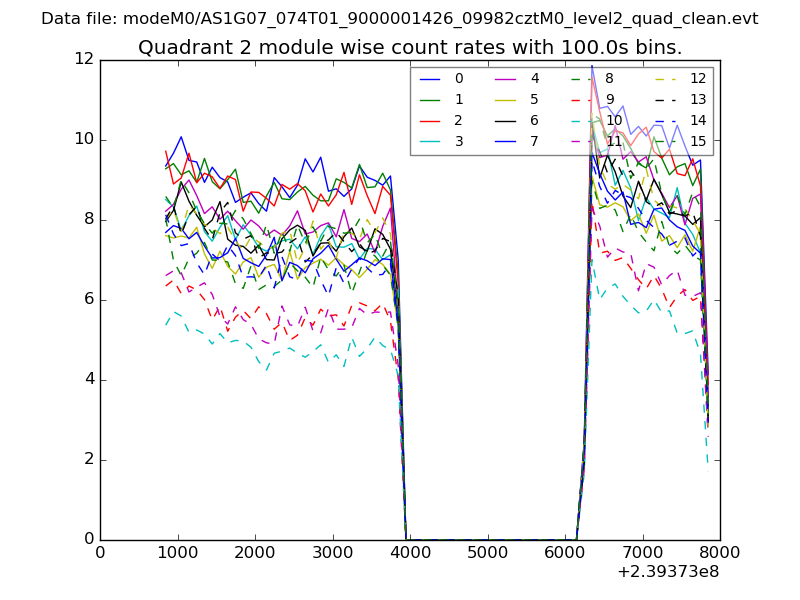
| Module-wise count rates for Quadrant B Data is divided into 100 sec bins |
 |
 |
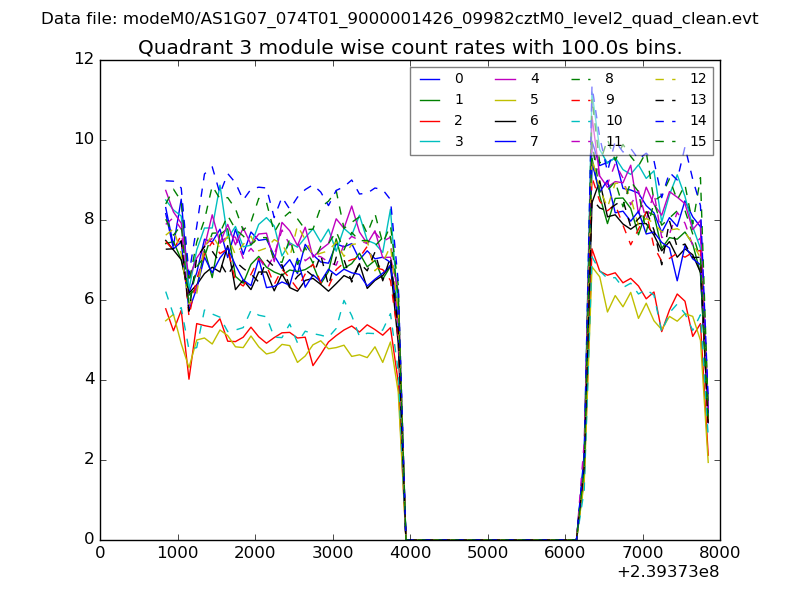
| Module-wise count rates for Quadrant C Data is divided into 100 sec bins |
 |
 |
| Module-wise count rates for Quadrant D Data is divided into 100 sec bins |
 |
 |
| Parameter | Plot |
|---|---|
| CZT HV Monitor | 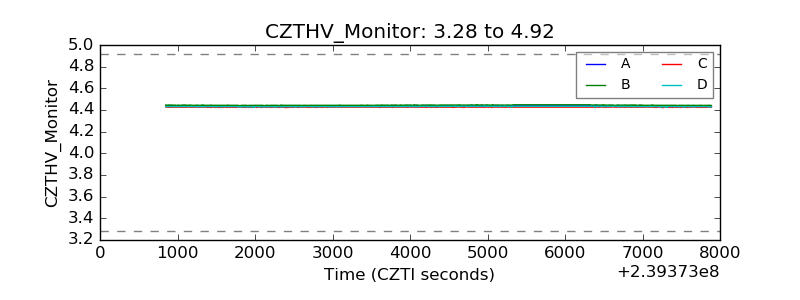 |
| D_VDD |  |
| Temperature 1 |  |
| Veto HV Monitor | 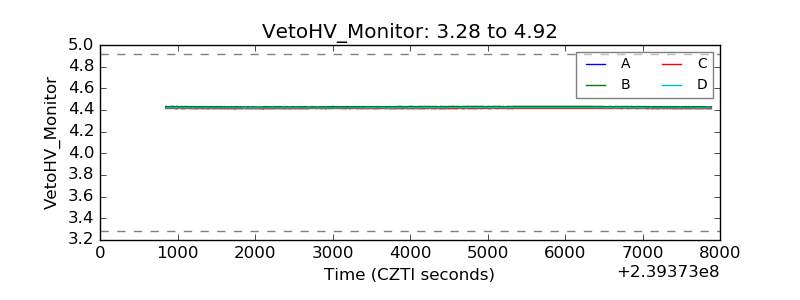 |
| Veto LLD |  |
| Alpha Counter | 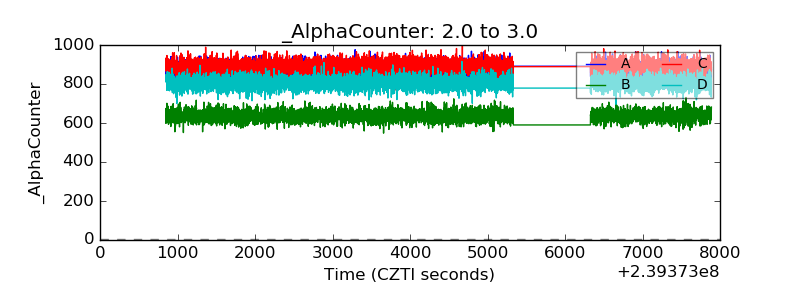 |
| _CPM_Rate | 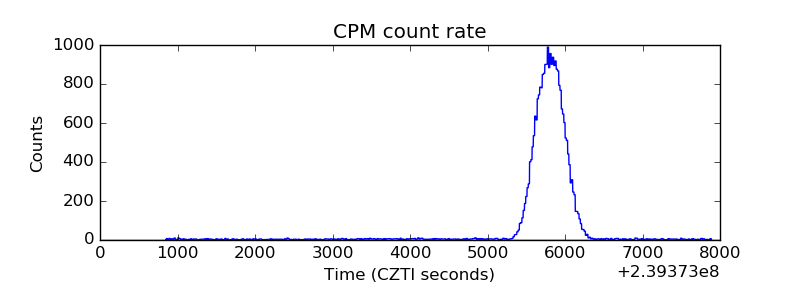 |
| CZT Counter | 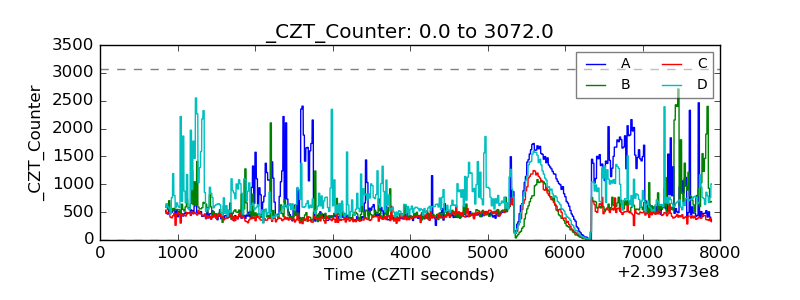 |
| +2.5 Volts monitor |  |
| +5 Volts monitor |  |
| _ROLL_ROT | 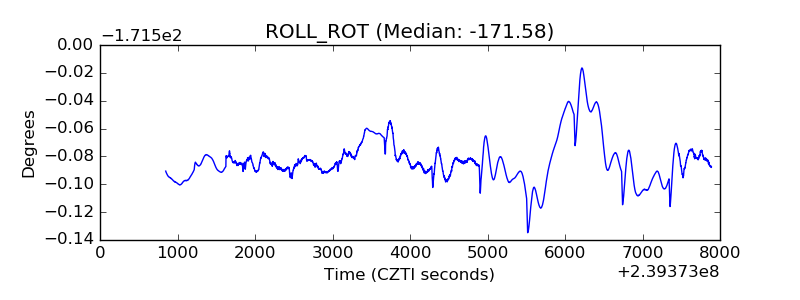 |
| _Roll_DEC | 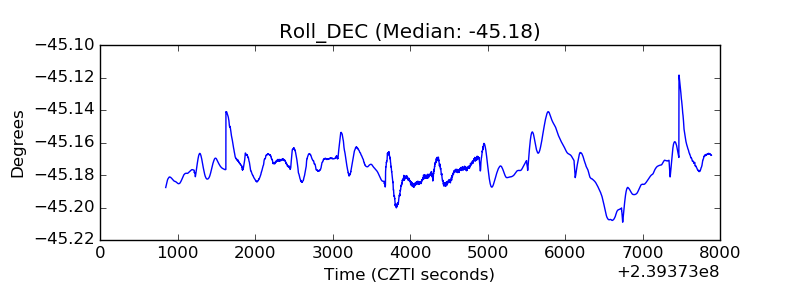 |
| _Roll_RA | 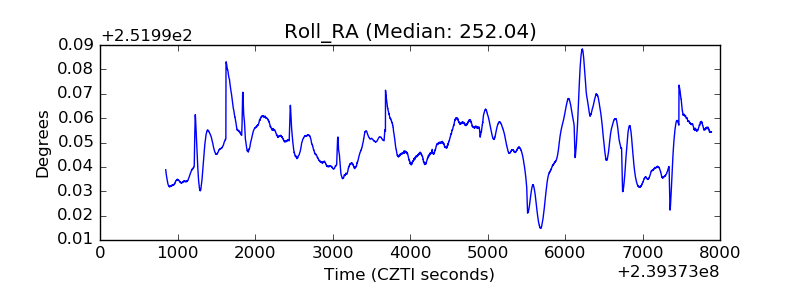 |
| Veto Counter | 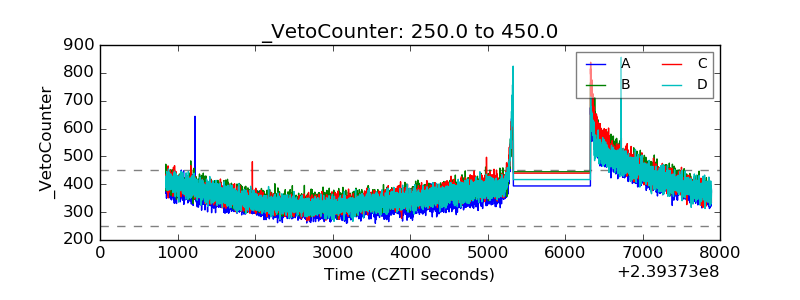 |