| Param | Original file | Final file |
|---|---|---|
| Filename | modeM0/AS1G07_074T01_9000001426_09984cztM0_level2.evt | modeM0/AS1G07_074T01_9000001426_09984cztM0_level2_quad_clean.evt |
| Size (bytes) | 554,250,240 | 88,171,200 |
| Size | 528.6 MB | 84.1 MB |
| Events in quadrant A | 4,666,707 | 549,488 |
| Events in quadrant B | 4,174,381 | 570,833 |
| Events in quadrant C | 2,781,021 | 573,602 |
| Events in quadrant D | 4,741,797 | 541,565 |
| Mode M9 | |||
|---|---|---|---|
| Quadrant | BADHDUFLAG | Total packets | Discarded packets |
| A | 0 | 11 | 0 |
| B | 0 | 11 | 0 |
| C | 0 | 11 | 0 |
| D | 0 | 11 | 0 |
| Mode M0 | |||
|---|---|---|---|
| Quadrant | BADHDUFLAG | Total packets | Discarded packets |
| A | 0 | 18071 | 2 |
| B | 0 | 16662 | 1 |
| C | 0 | 12724 | 1 |
| D | 0 | 18599 | 1 |
| Mode SS | |||
|---|---|---|---|
| Quadrant | BADHDUFLAG | Total packets | Discarded packets |
| A | 0 | 128 | 0 |
| B | 0 | 128 | 0 |
| C | 0 | 128 | 0 |
| D | 0 | 128 | 0 |
| Quadrant | Total seconds | Saturated seconds | Saturation percentage |
|---|---|---|---|
| A | 6215 | 680 | 10.941271% |
| B | 6215 | 234 | 3.765084% |
| C | 6215 | 44 | 0.707965% |
| D | 6215 | 223 | 3.588093% |
Noise dominated data is calculated using 1-second bins in cleaned event files. If a bin has >2000 counts, and if more than 50% of those come from <1% of pixels, then it is considered to be noise-dominated and hence unusable.
| Quadrant | # 1 sec bins | Bins with >0 counts | Bins with >2000 counts | High rate bins dominated by noise | Noise dominated (total time) | Noise dominated (detector-on time) | Marked lightcurve |
|---|---|---|---|---|---|---|---|
| A | 7330 | 6215 | 484 | 484 | 6.60% | 7.79% | 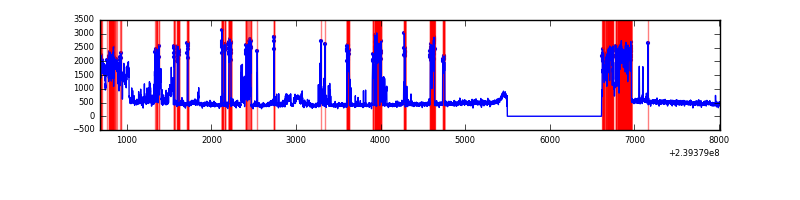 |
| B | 7330 | 6215 | 173 | 173 | 2.36% | 2.78% | 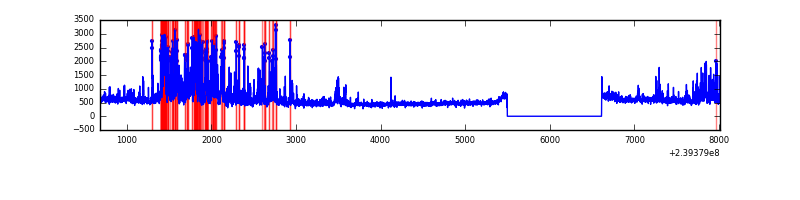 |
| C | 7330 | 6215 | 5 | 5 | 0.07% | 0.08% | 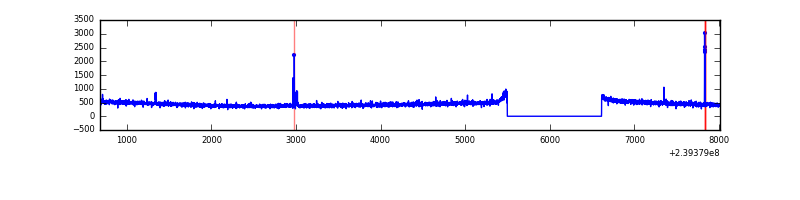 |
| D | 7330 | 6215 | 137 | 137 | 1.87% | 2.20% | 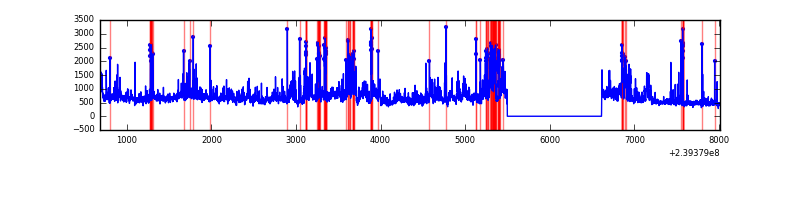 |
Top three noisy pixels from each quadrant. If the there are fewer than three noisy pixels in the level2.evt file, extra rows are filled as -1
| Pixel properties | Quadrant properties | ||||||
|---|---|---|---|---|---|---|---|
| Quadrant | DetID | PixID | Counts | Sigma | Mean | Median | Sigma |
| A | 13 | 251 | 1761457 | 12076.66 | 714 | 699 | 145.8 |
| A | 15 | 174 | 74976 | 509.45 | 714 | 699 | 145.8 |
| A | 14 | 111 | 61080 | 414.14 | 714 | 699 | 145.8 |
| B | 0 | 85 | 810723 | 5816.1 | 731 | 715 | 139.3 |
| B | 0 | 214 | 149314 | 1066.99 | 731 | 715 | 139.3 |
| B | 11 | 51 | 108385 | 773.1 | 731 | 715 | 139.3 |
| C | 8 | 208 | 17352 | 102.2 | 703 | 708 | 162.9 |
| C | 9 | 221 | 15197 | 88.97 | 703 | 708 | 162.9 |
| C | 13 | 61 | 5360 | 28.57 | 703 | 708 | 162.9 |
| D | 1 | 52 | 1021220 | 5395.79 | 695 | 679 | 189.1 |
| D | 8 | 195 | 701581 | 3705.8 | 695 | 679 | 189.1 |
| D | 2 | 16 | 102041 | 535.92 | 695 | 679 | 189.1 |
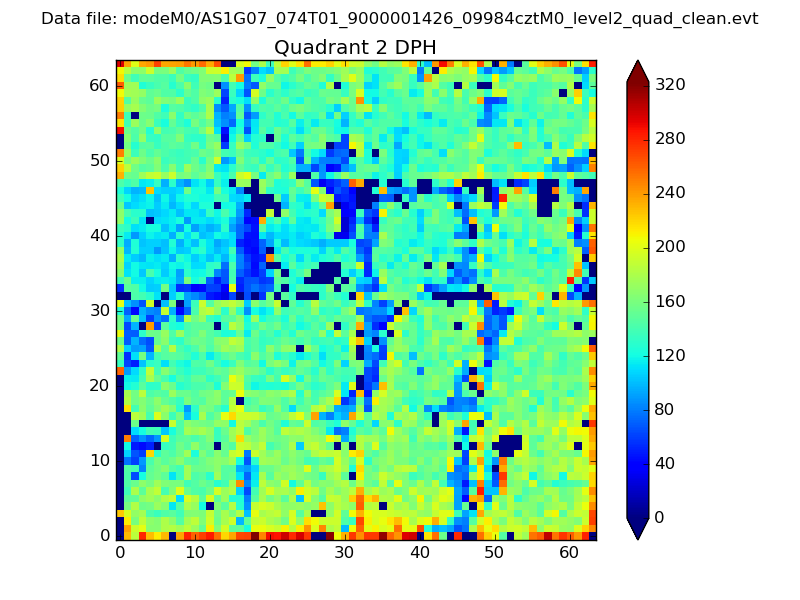
Histogram calculated using DETX and DETY for each event in the final _common_clean file
| Quadrant A | 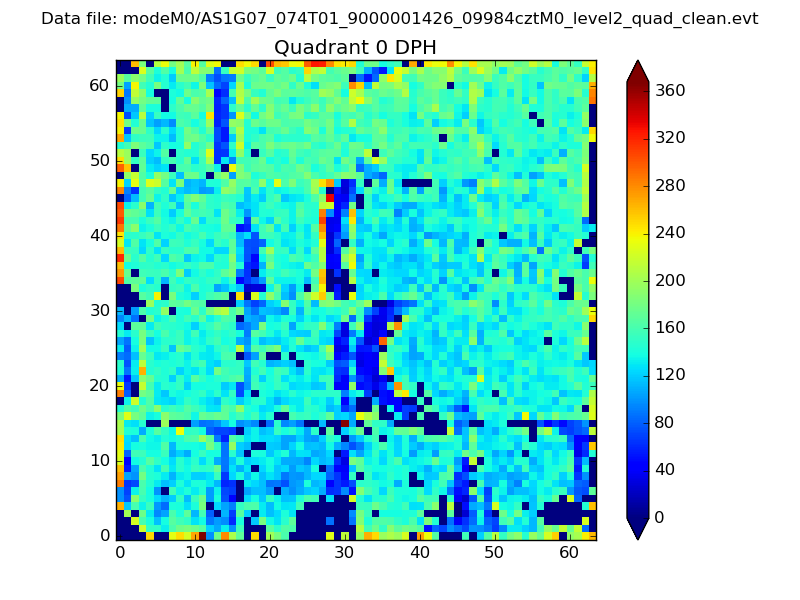 |
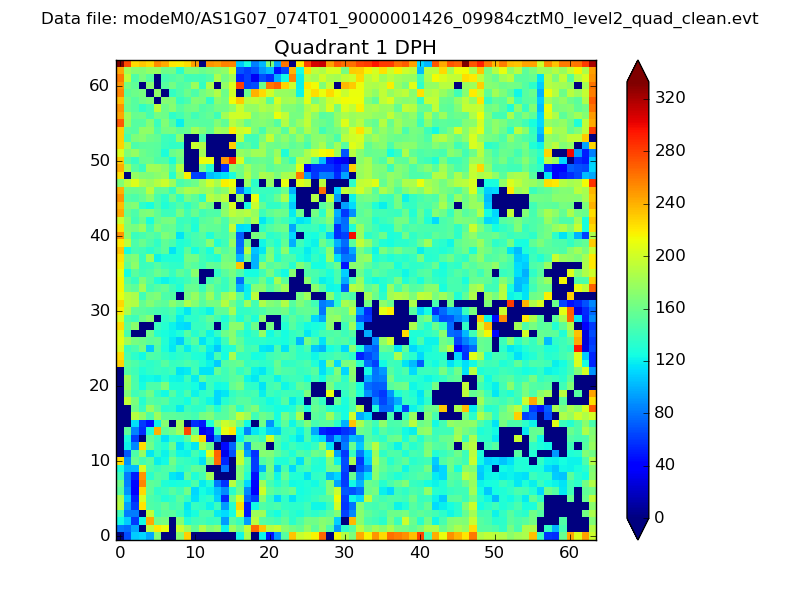 |
Quadrant B |
|---|---|---|---|
| Quadrant D | 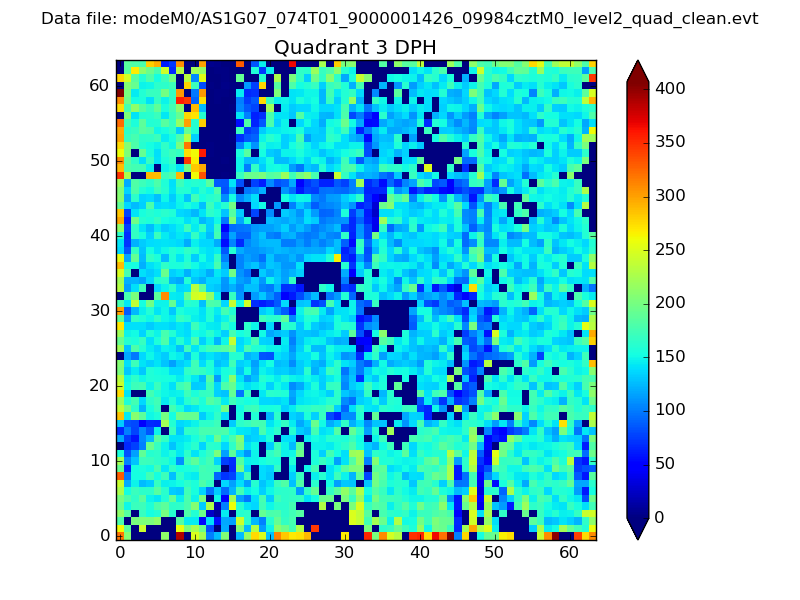 |
 |
Quadrant C |
| Plot type | Count rate plots | Images |
|---|---|---|
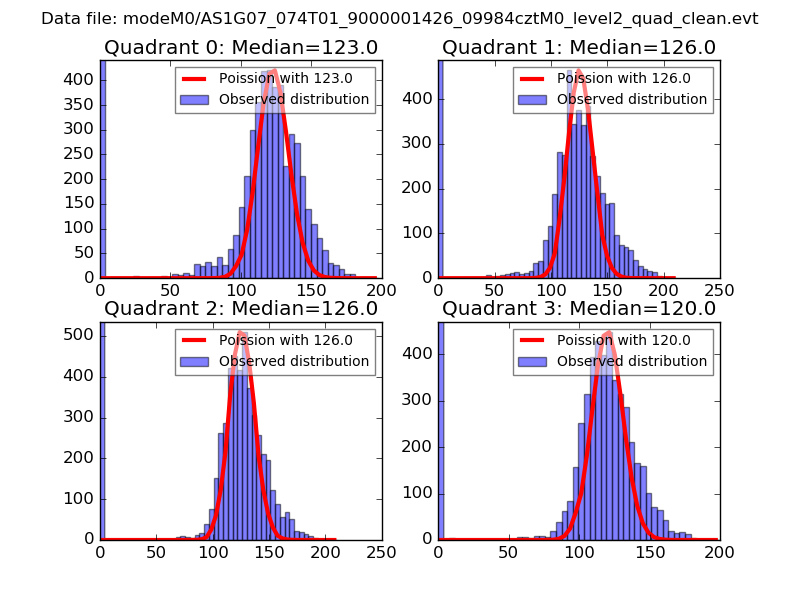
| Comparison with Poisson distribution Blue bars denote a histogram of data divided into 1 sec bins. Red curve is a Poisson curve with rate = median count rate of data. |
 |
 |
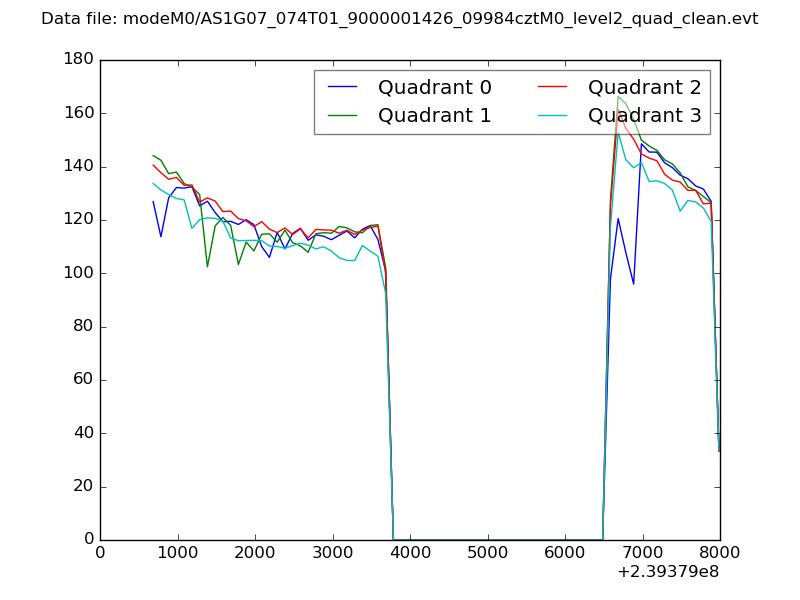
| Quadrant-wise count rates Data is divided into 100 sec bins |
 |
|
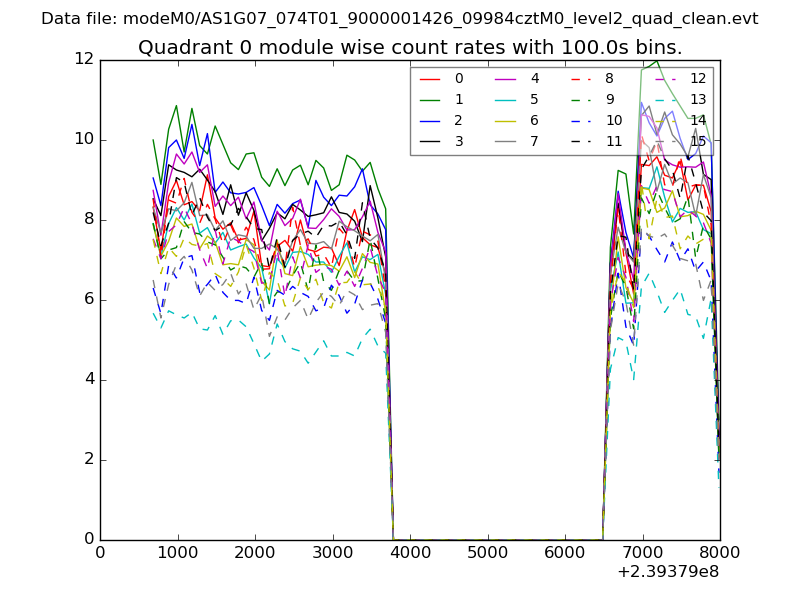
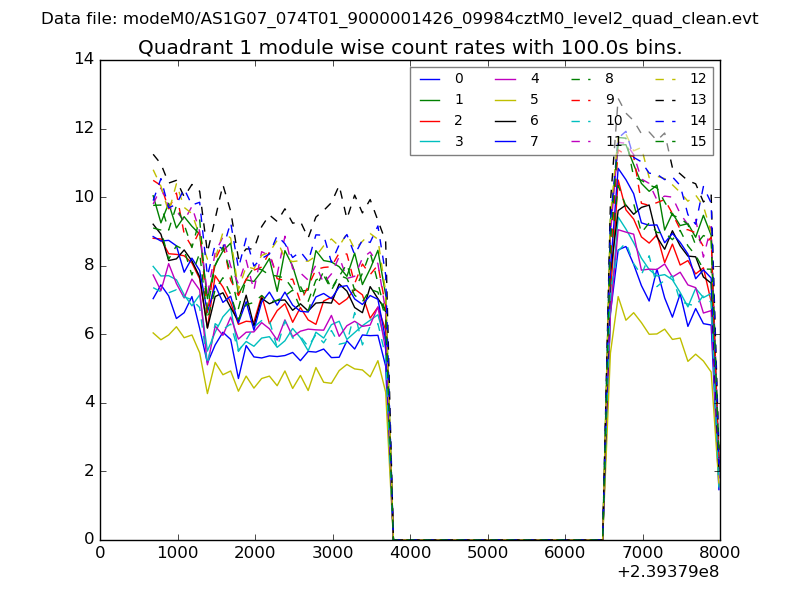
| Module-wise count rates for Quadrant A Data is divided into 100 sec bins |
 |
 |
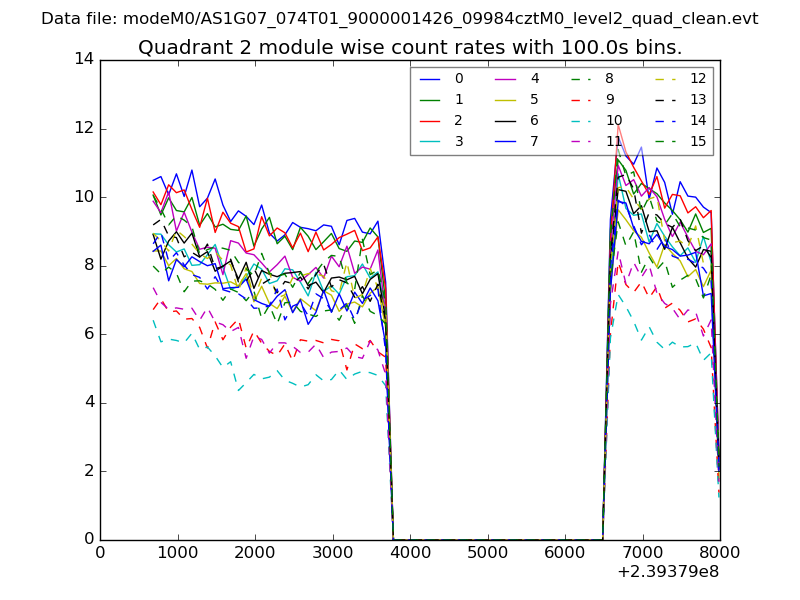
| Module-wise count rates for Quadrant B Data is divided into 100 sec bins |
 |
 |
| Module-wise count rates for Quadrant C Data is divided into 100 sec bins |
 |
 |
| Module-wise count rates for Quadrant D Data is divided into 100 sec bins |
 |
 |
| Parameter | Plot |
|---|---|
| CZT HV Monitor | 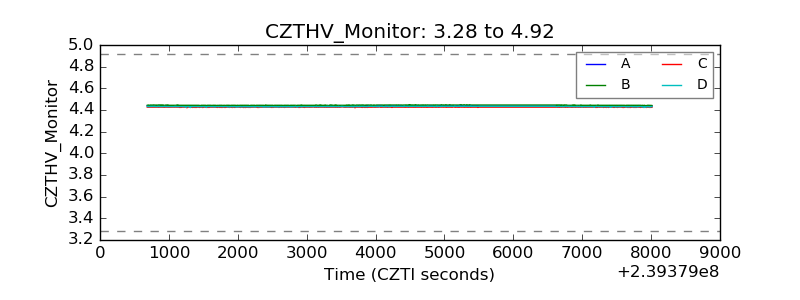 |
| D_VDD | 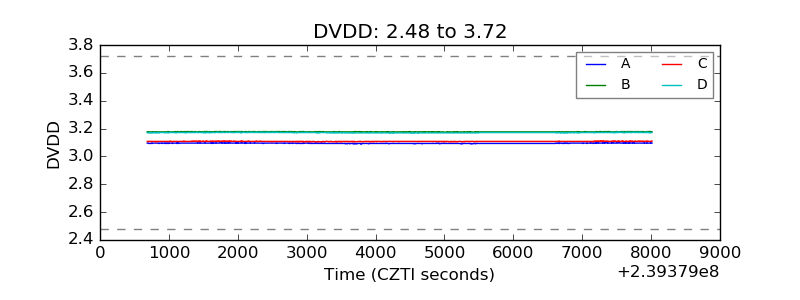 |
| Temperature 1 | 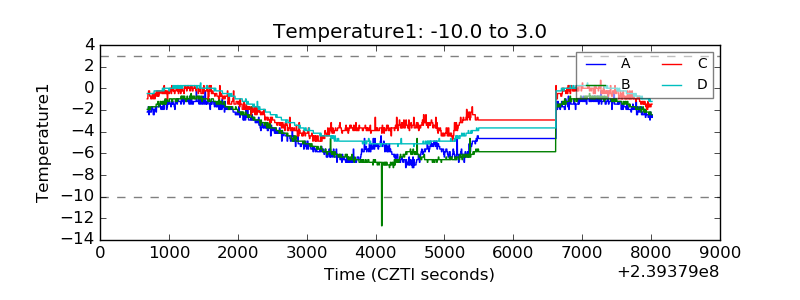 |
| Veto HV Monitor | 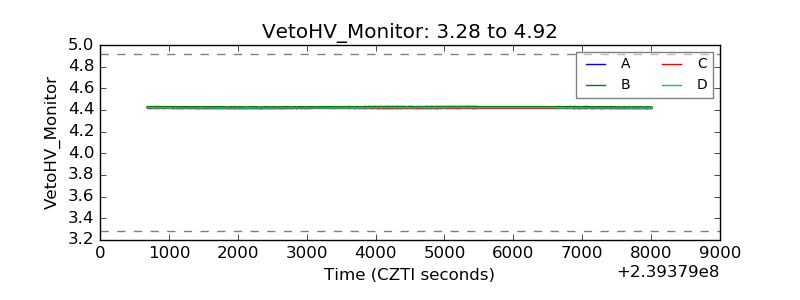 |
| Veto LLD | 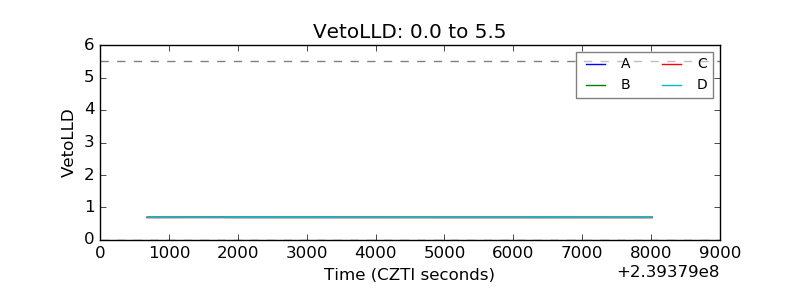 |
| Alpha Counter | 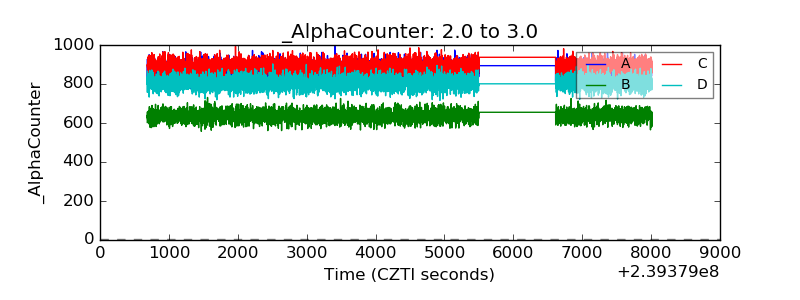 |
| _CPM_Rate | 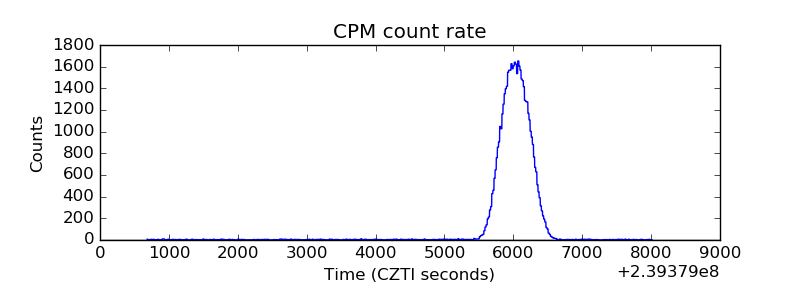 |
| CZT Counter | 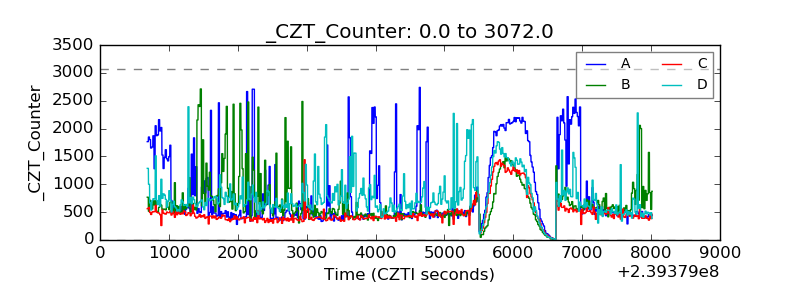 |
| +2.5 Volts monitor |  |
| +5 Volts monitor |  |
| _ROLL_ROT | 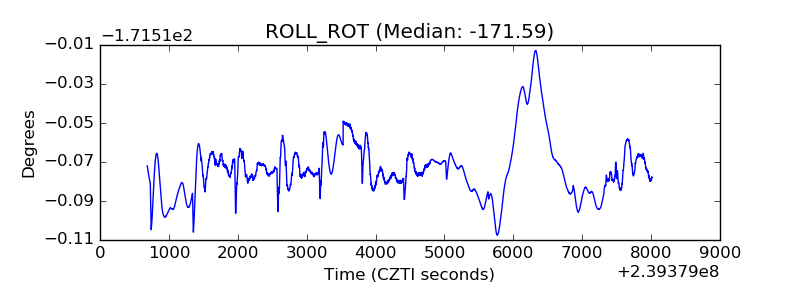 |
| _Roll_DEC | 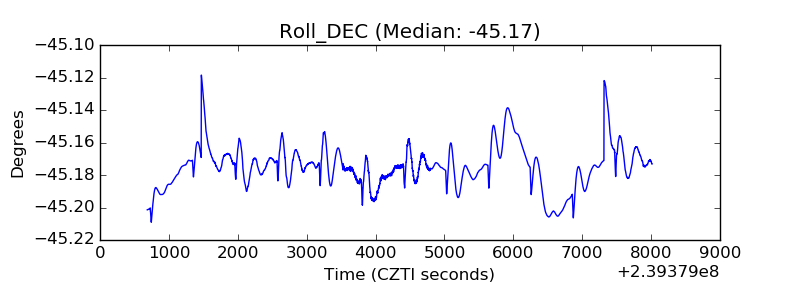 |
| _Roll_RA | 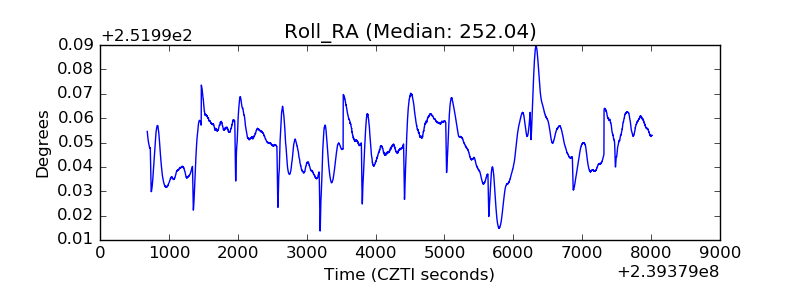 |
| Veto Counter |  |