| Param | Original file | Final file |
|---|---|---|
| Filename | modeM0/AS1G07_074T01_9000001426_09985cztM0_level2.evt | modeM0/AS1G07_074T01_9000001426_09985cztM0_level2_quad_clean.evt |
| Size (bytes) | 550,736,640 | 92,355,840 |
| Size | 525.2 MB | 88.1 MB |
| Events in quadrant A | 5,327,884 | 577,823 |
| Events in quadrant B | 4,257,545 | 601,073 |
| Events in quadrant C | 2,938,759 | 598,417 |
| Events in quadrant D | 3,717,421 | 569,117 |
| Mode M9 | |||
|---|---|---|---|
| Quadrant | BADHDUFLAG | Total packets | Discarded packets |
| A | 0 | 13 | 0 |
| B | 0 | 13 | 0 |
| C | 0 | 13 | 0 |
| D | 0 | 14 | 0 |
| Mode M0 | |||
|---|---|---|---|
| Quadrant | BADHDUFLAG | Total packets | Discarded packets |
| A | 0 | 20172 | 3 |
| B | 0 | 17094 | 2 |
| C | 0 | 13259 | 2 |
| D | 0 | 15557 | 2 |
| Mode SS | |||
|---|---|---|---|
| Quadrant | BADHDUFLAG | Total packets | Discarded packets |
| A | 0 | 132 | 0 |
| B | 0 | 132 | 0 |
| C | 0 | 132 | 0 |
| D | 0 | 132 | 0 |
| Quadrant | Total seconds | Saturated seconds | Saturation percentage |
|---|---|---|---|
| A | 6449 | 779 | 12.079392% |
| B | 6449 | 202 | 3.132269% |
| C | 6449 | 15 | 0.232594% |
| D | 6449 | 61 | 0.945883% |
Noise dominated data is calculated using 1-second bins in cleaned event files. If a bin has >2000 counts, and if more than 50% of those come from <1% of pixels, then it is considered to be noise-dominated and hence unusable.
| Quadrant | # 1 sec bins | Bins with >0 counts | Bins with >2000 counts | High rate bins dominated by noise | Noise dominated (total time) | Noise dominated (detector-on time) | Marked lightcurve |
|---|---|---|---|---|---|---|---|
| A | 7689 | 6449 | 683 | 683 | 8.88% | 10.59% |  |
| B | 7689 | 6449 | 159 | 159 | 2.07% | 2.47% | 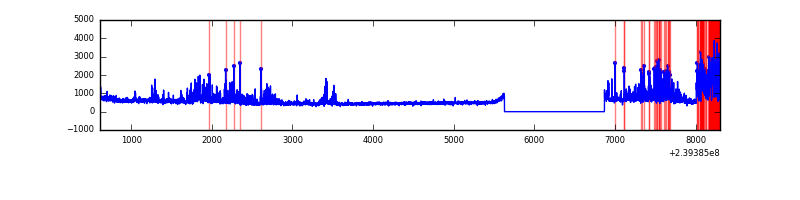 |
| C | 7689 | 6450 | 4 | 4 | 0.05% | 0.06% | 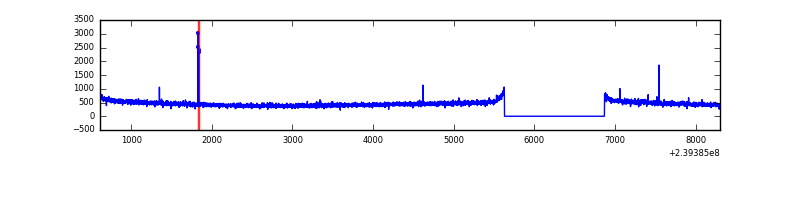 |
| D | 7689 | 6450 | 34 | 34 | 0.44% | 0.53% | 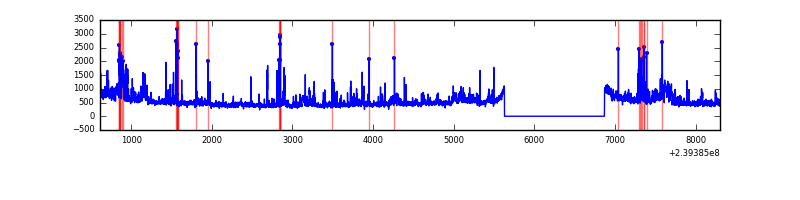 |
Top three noisy pixels from each quadrant. If the there are fewer than three noisy pixels in the level2.evt file, extra rows are filled as -1
| Pixel properties | Quadrant properties | ||||||
|---|---|---|---|---|---|---|---|
| Quadrant | DetID | PixID | Counts | Sigma | Mean | Median | Sigma |
| A | 13 | 251 | 2296860 | 14963.2 | 758 | 743 | 153.5 |
| A | 15 | 174 | 105267 | 681.16 | 758 | 743 | 153.5 |
| A | 0 | 226 | 7174 | 41.91 | 758 | 743 | 153.5 |
| B | 0 | 85 | 634265 | 4287.34 | 781 | 766 | 147.8 |
| B | 4 | 239 | 201301 | 1357.16 | 781 | 766 | 147.8 |
| B | 4 | 81 | 69003 | 461.81 | 781 | 766 | 147.8 |
| C | 8 | 208 | 13098 | 71.76 | 746 | 749 | 172.1 |
| C | 13 | 61 | 5731 | 28.95 | 746 | 749 | 172.1 |
| C | 14 | 67 | 5207 | 25.9 | 746 | 749 | 172.1 |
| D | 1 | 52 | 379587 | 1877.3 | 743 | 724 | 201.8 |
| D | 2 | 16 | 135153 | 666.11 | 743 | 724 | 201.8 |
| D | 7 | 71 | 93046 | 457.46 | 743 | 724 | 201.8 |
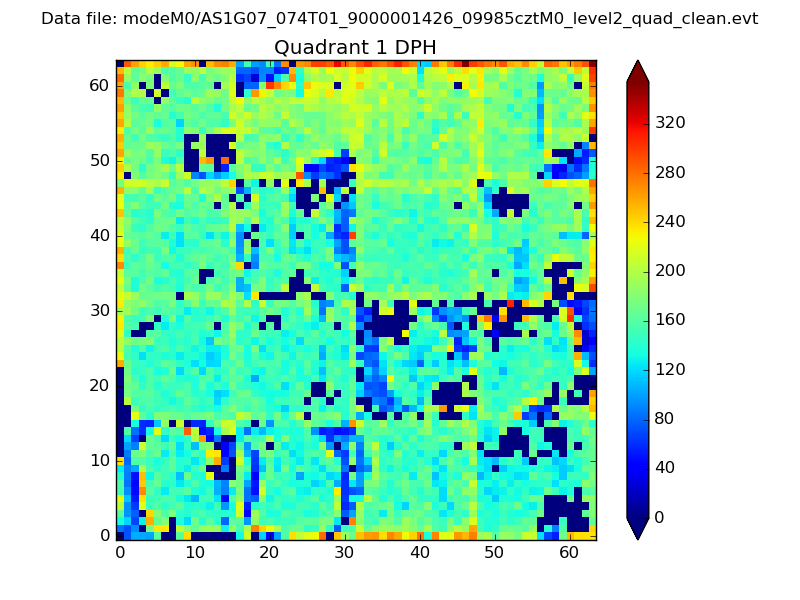
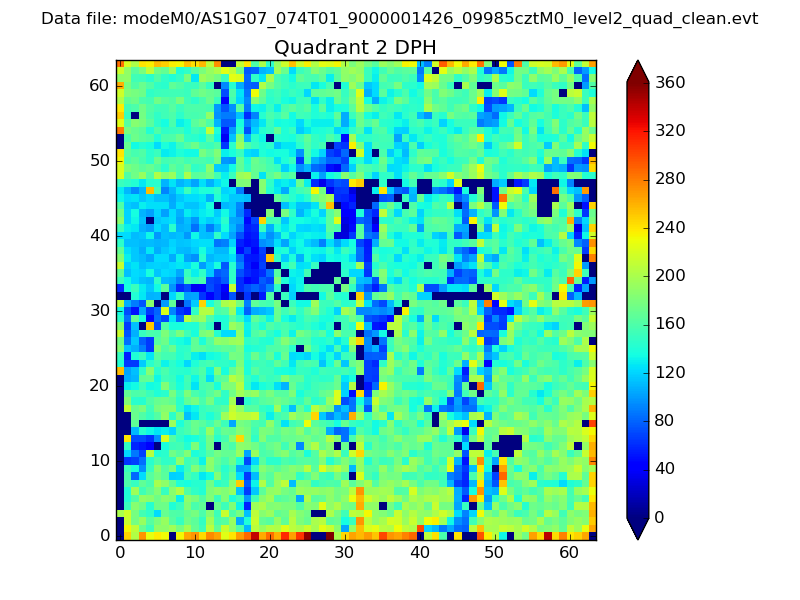
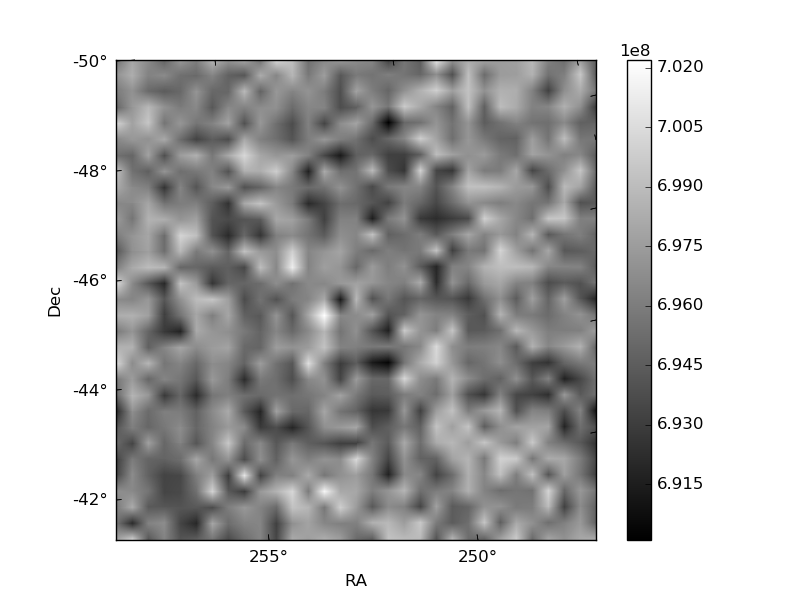
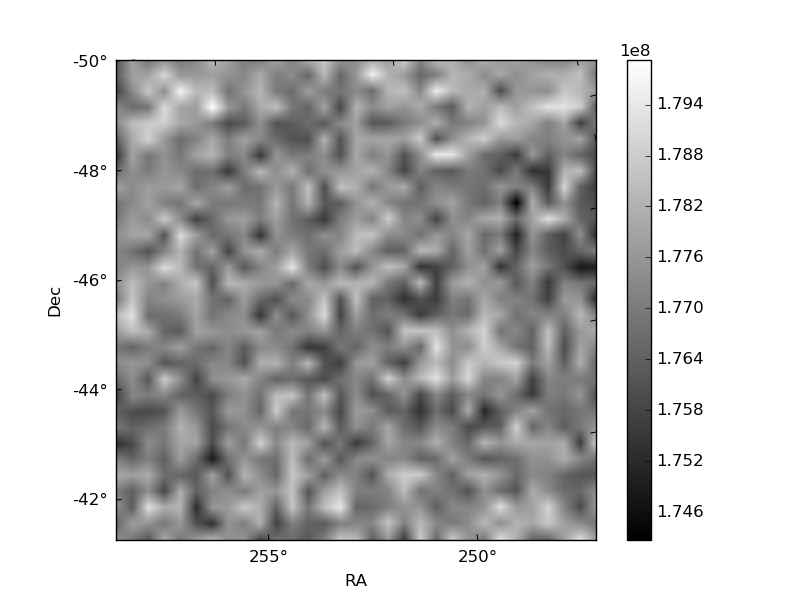
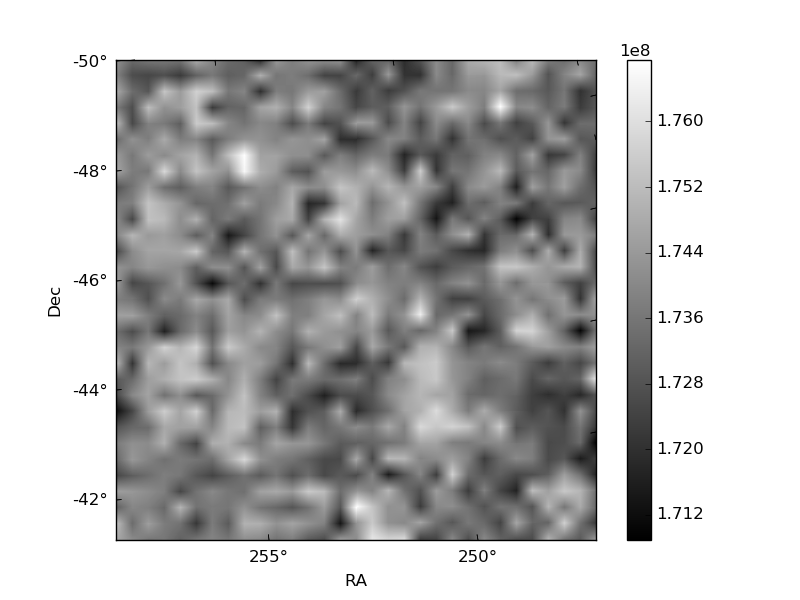
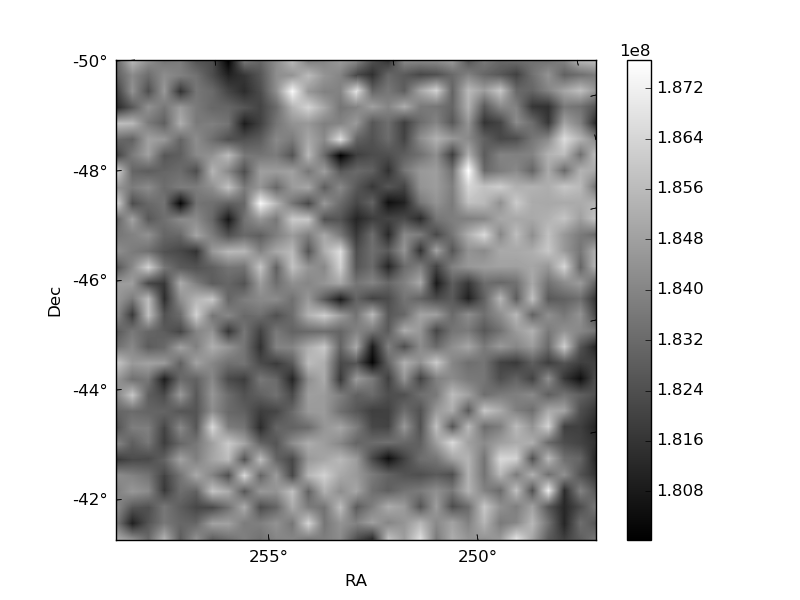
Histogram calculated using DETX and DETY for each event in the final _common_clean file
| Quadrant A | 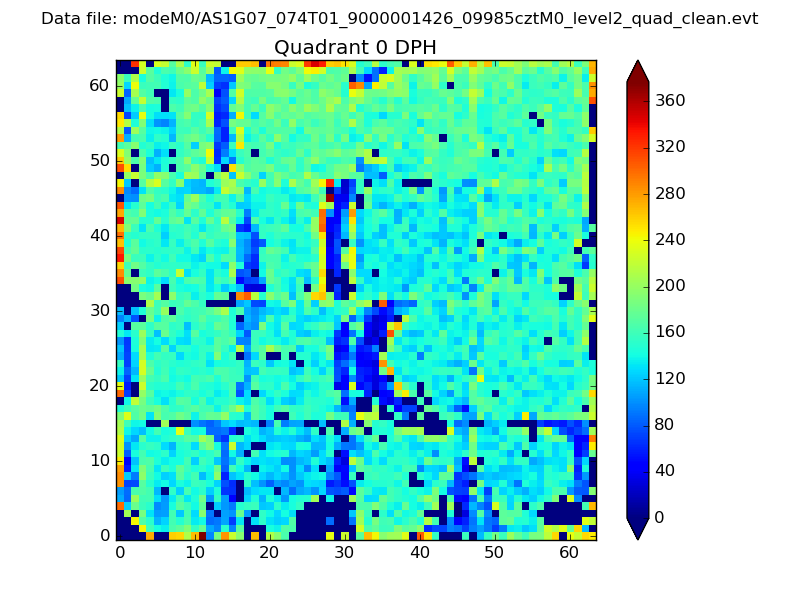 |
 |
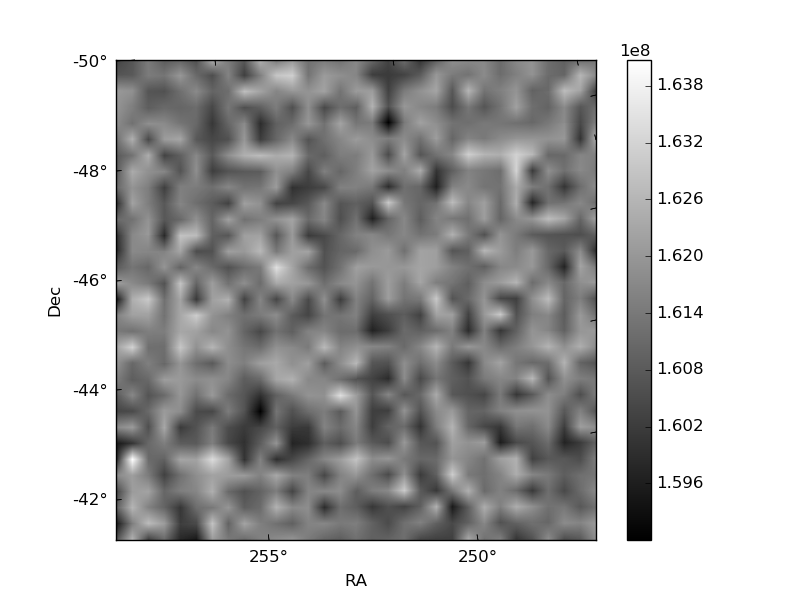
Quadrant B |
|---|---|---|---|
| Quadrant D | 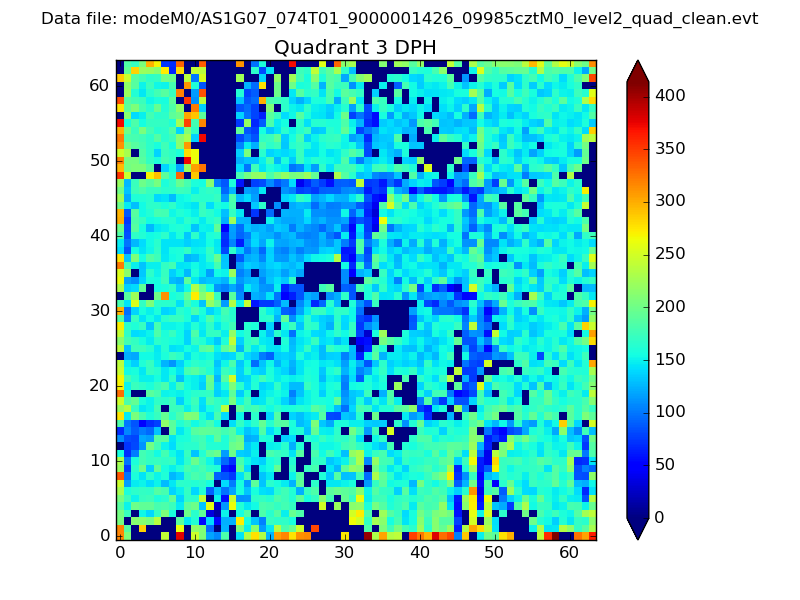 |
 |
Quadrant C |
| Plot type | Count rate plots | Images |
|---|---|---|
| Comparison with Poisson distribution Blue bars denote a histogram of data divided into 1 sec bins. Red curve is a Poisson curve with rate = median count rate of data. |
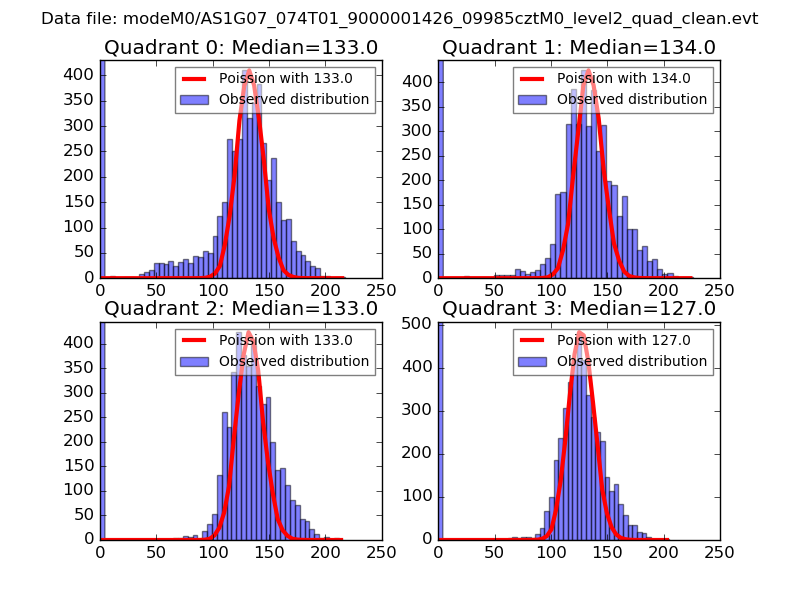 |
 |
| Quadrant-wise count rates Data is divided into 100 sec bins |
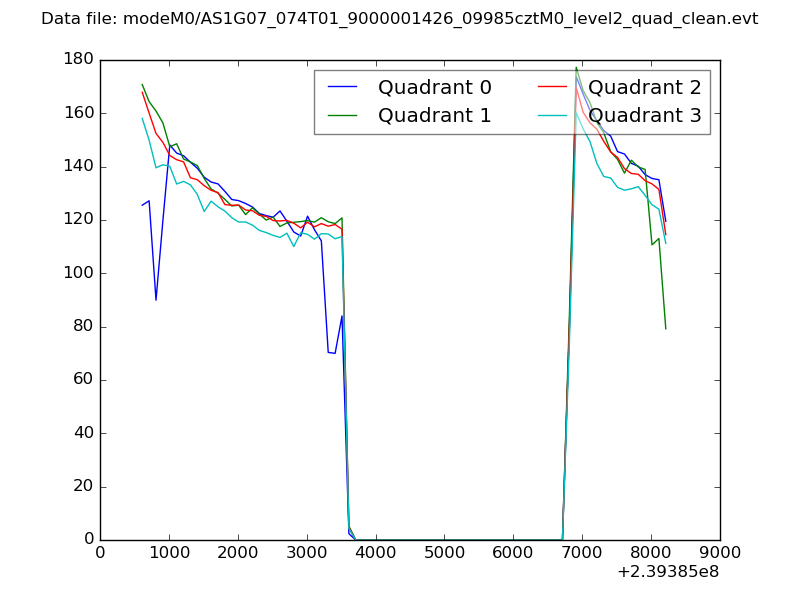 |
|
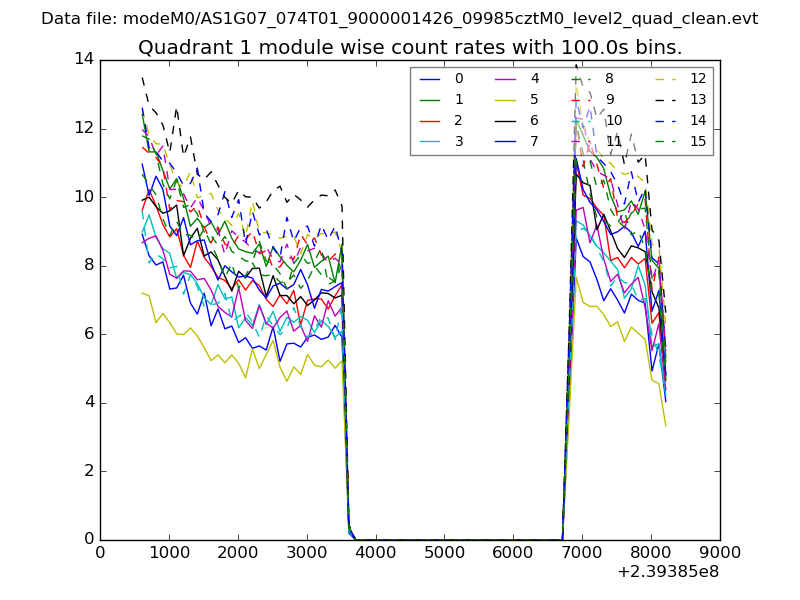
| Module-wise count rates for Quadrant A Data is divided into 100 sec bins |
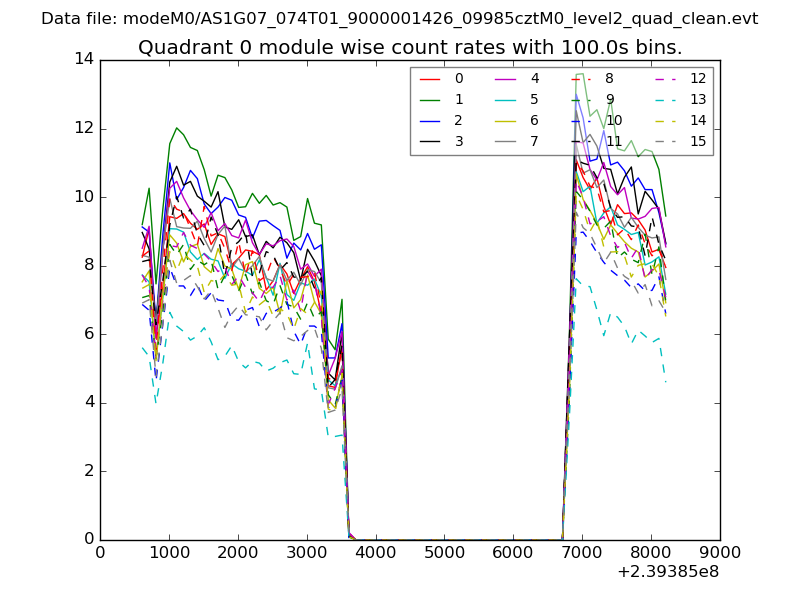 |
 |
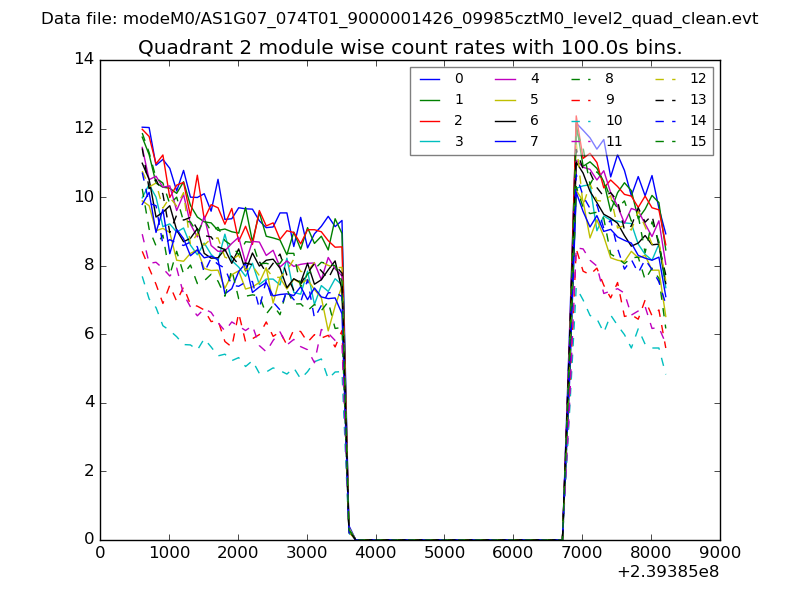
| Module-wise count rates for Quadrant B Data is divided into 100 sec bins |
 |
 |
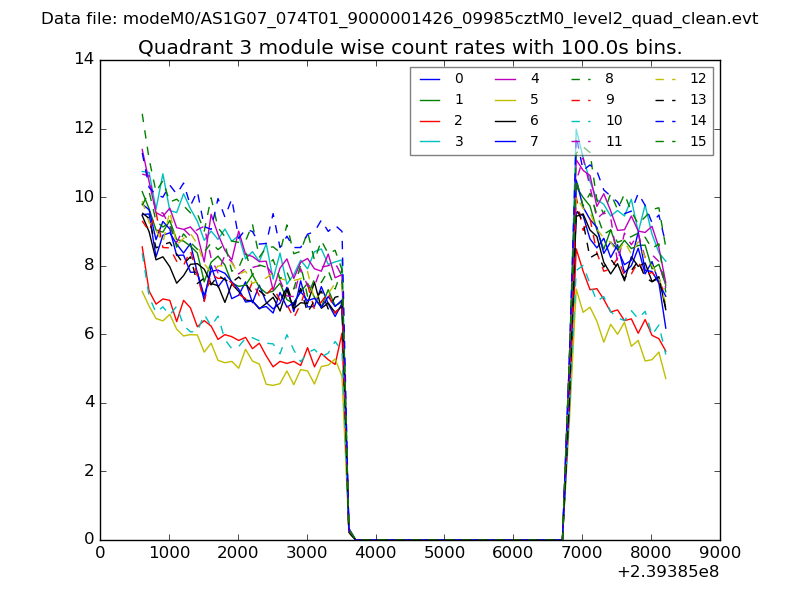
| Module-wise count rates for Quadrant C Data is divided into 100 sec bins |
 |
 |
| Module-wise count rates for Quadrant D Data is divided into 100 sec bins |
 |
 |
| Parameter | Plot |
|---|---|
| CZT HV Monitor | 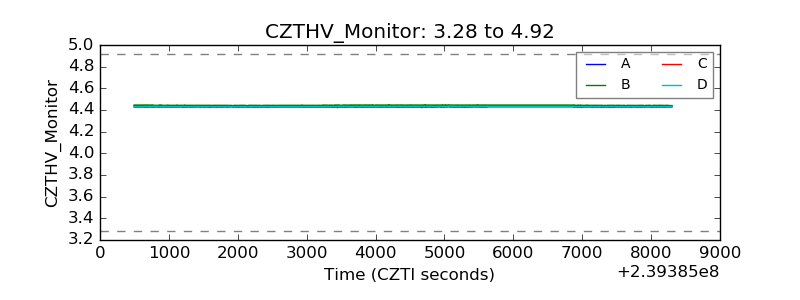 |
| D_VDD |  |
| Temperature 1 | 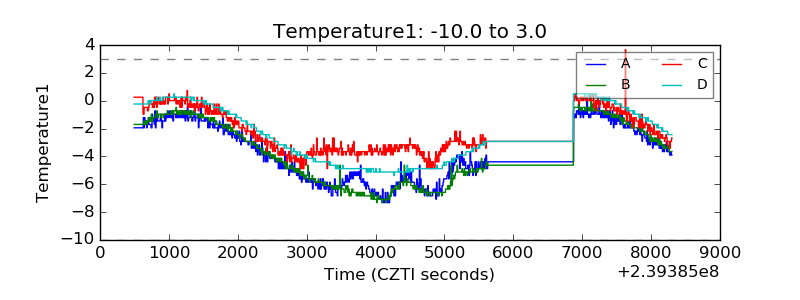 |
| Veto HV Monitor | 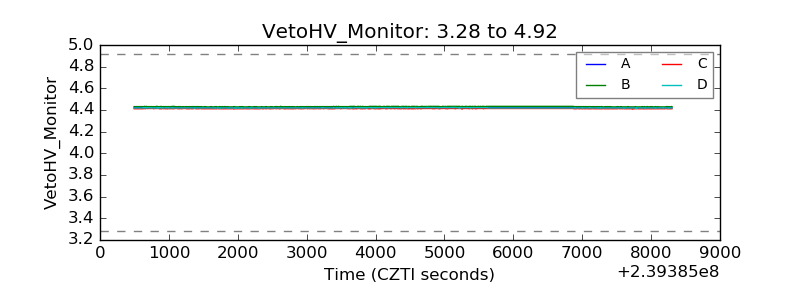 |
| Veto LLD | 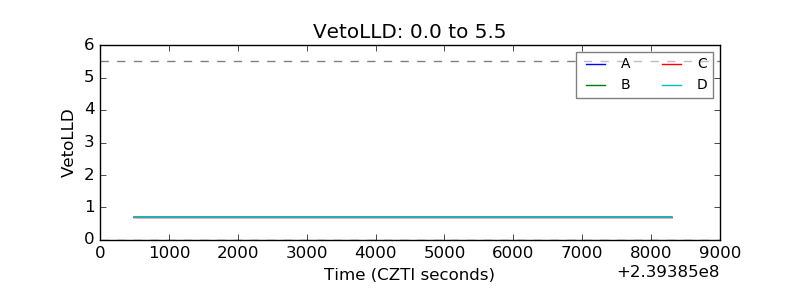 |
| Alpha Counter | 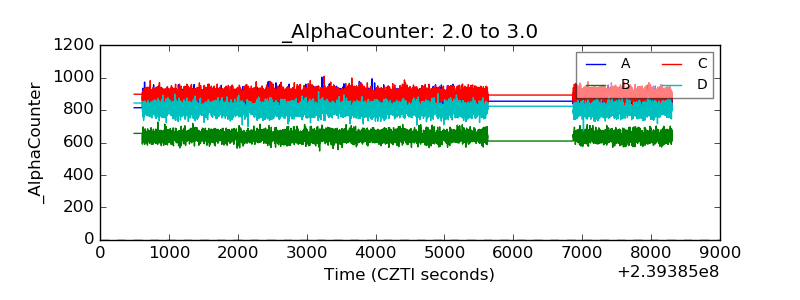 |
| _CPM_Rate | 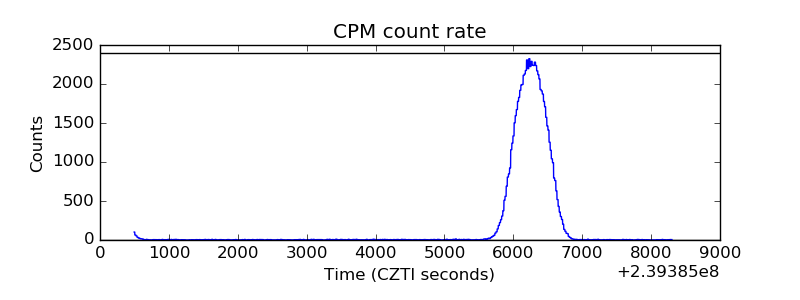 |
| CZT Counter | 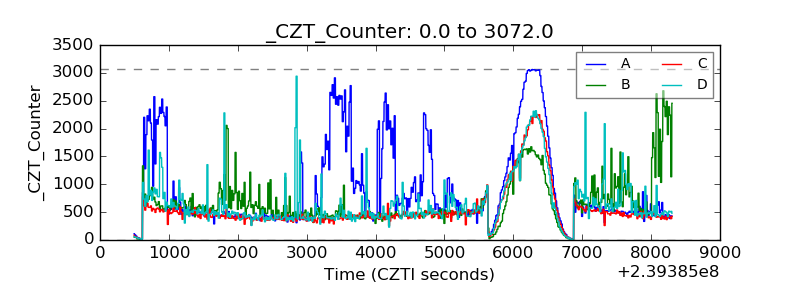 |
| +2.5 Volts monitor |  |
| +5 Volts monitor |  |
| _ROLL_ROT | 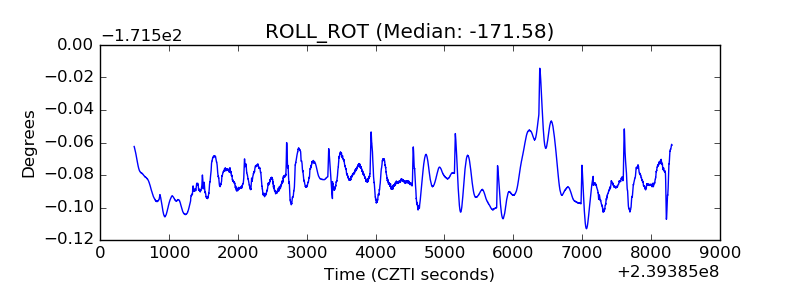 |
| _Roll_DEC | 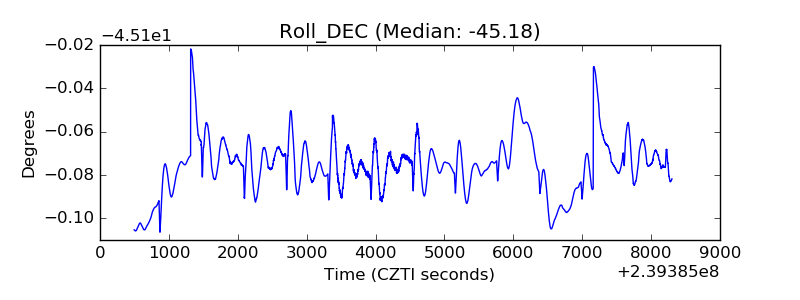 |
| _Roll_RA | 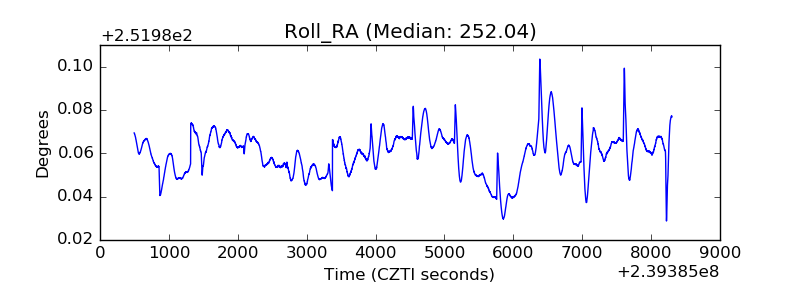 |
| Veto Counter | 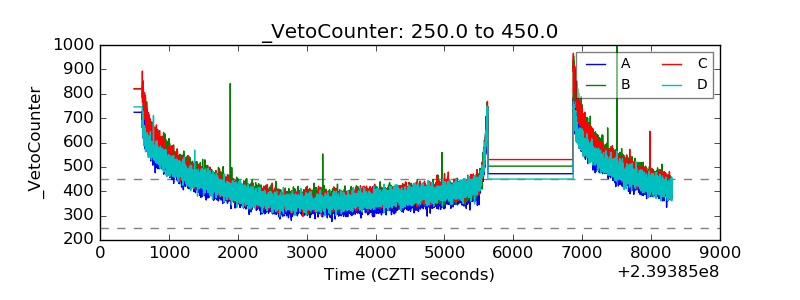 |