| Param | Original file | Final file |
|---|---|---|
| Filename | modeM0/AS1G07_074T01_9000001426_09986cztM0_level2.evt | modeM0/AS1G07_074T01_9000001426_09986cztM0_level2_quad_clean.evt |
| Size (bytes) | 477,800,640 | 78,514,560 |
| Size | 455.7 MB | 74.9 MB |
| Events in quadrant A | 2,772,904 | 520,757 |
| Events in quadrant B | 3,963,971 | 493,592 |
| Events in quadrant C | 2,578,991 | 512,935 |
| Events in quadrant D | 4,776,357 | 461,118 |
| Mode M9 | |||
|---|---|---|---|
| Quadrant | BADHDUFLAG | Total packets | Discarded packets |
| A | 0 | 18 | 1 |
| B | 0 | 18 | 1 |
| C | 0 | 18 | 1 |
| D | 0 | 19 | 1 |
| Mode M0 | |||
|---|---|---|---|
| Quadrant | BADHDUFLAG | Total packets | Discarded packets |
| A | 0 | 12954 | 1012 |
| B | 0 | 17363 | 1845 |
| C | 0 | 12488 | 979 |
| D | 0 | 19774 | 1800 |
| Mode SS | |||
|---|---|---|---|
| Quadrant | BADHDUFLAG | Total packets | Discarded packets |
| A | 0 | 122 | 4 |
| B | 0 | 122 | 4 |
| C | 0 | 122 | 6 |
| D | 0 | 122 | 18 |
| Quadrant | Total seconds | Saturated seconds | Saturation percentage |
|---|---|---|---|
| A | 5608 | 23 | 0.410128% |
| B | 5481 | 257 | 4.688925% |
| C | 5598 | 11 | 0.196499% |
| D | 5511 | 733 | 13.300671% |
Noise dominated data is calculated using 1-second bins in cleaned event files. If a bin has >2000 counts, and if more than 50% of those come from <1% of pixels, then it is considered to be noise-dominated and hence unusable.
| Quadrant | # 1 sec bins | Bins with >0 counts | Bins with >2000 counts | High rate bins dominated by noise | Noise dominated (total time) | Noise dominated (detector-on time) | Marked lightcurve |
|---|---|---|---|---|---|---|---|
| A | 7402 | 5956 | 0 | 0 | 0.00% | 0.00% | 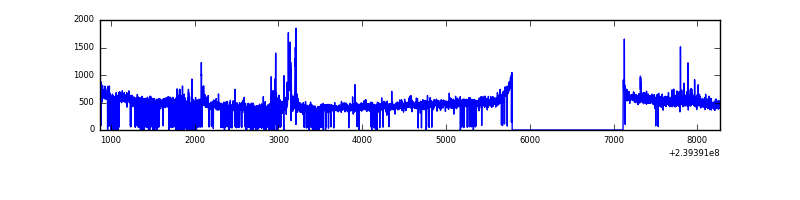 |
| B | 7402 | 5877 | 212 | 212 | 2.86% | 3.61% | 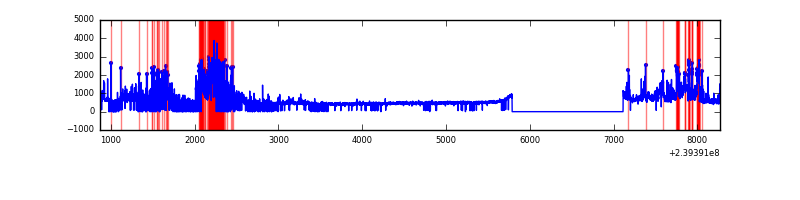 |
| C | 7402 | 5937 | 0 | 0 | 0.00% | 0.00% | 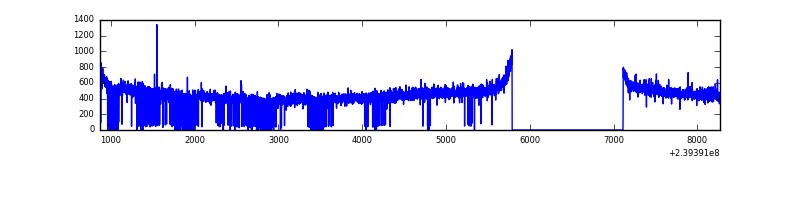 |
| D | 7402 | 5863 | 692 | 692 | 9.35% | 11.80% | 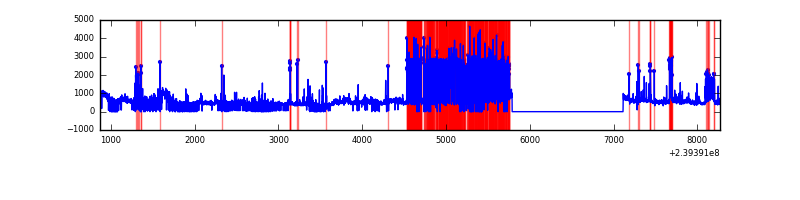 |
Top three noisy pixels from each quadrant. If the there are fewer than three noisy pixels in the level2.evt file, extra rows are filled as -1
| Pixel properties | Quadrant properties | ||||||
|---|---|---|---|---|---|---|---|
| Quadrant | DetID | PixID | Counts | Sigma | Mean | Median | Sigma |
| A | 13 | 251 | 61719 | 433.43 | 689 | 676 | 140.8 |
| A | 15 | 174 | 31015 | 215.42 | 689 | 676 | 140.8 |
| A | 14 | 111 | 24407 | 168.5 | 689 | 676 | 140.8 |
| B | 0 | 85 | 904951 | 7081.96 | 672 | 658 | 127.7 |
| B | 4 | 239 | 200269 | 1563.25 | 672 | 658 | 127.7 |
| B | 11 | 51 | 94926 | 738.26 | 672 | 658 | 127.7 |
| C | 13 | 61 | 5092 | 28.92 | 659 | 662 | 153.2 |
| C | 14 | 67 | 4249 | 23.41 | 659 | 662 | 153.2 |
| C | 8 | 222 | 2285 | 10.59 | 659 | 662 | 153.2 |
| D | 1 | 52 | 1956283 | 12391.33 | 583 | 569 | 157.8 |
| D | 2 | 16 | 204300 | 1290.83 | 583 | 569 | 157.8 |
| D | 2 | 152 | 103268 | 650.7 | 583 | 569 | 157.8 |
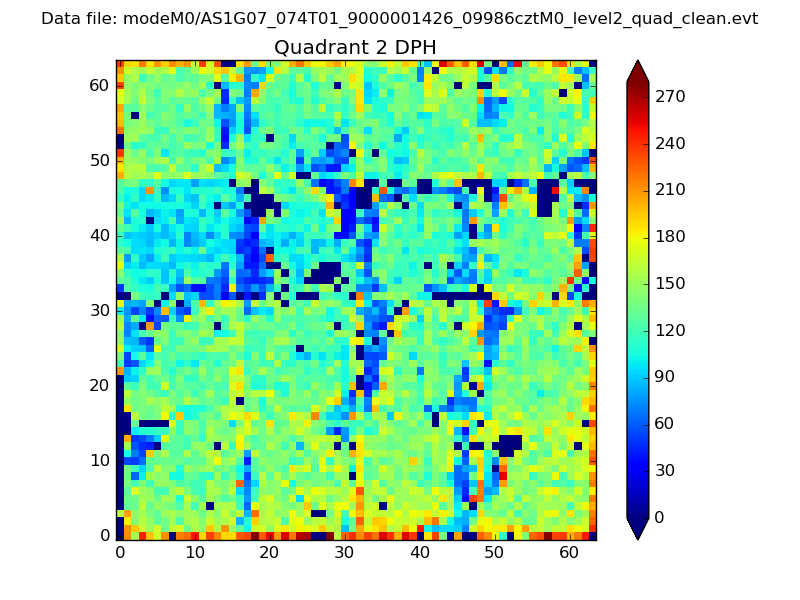
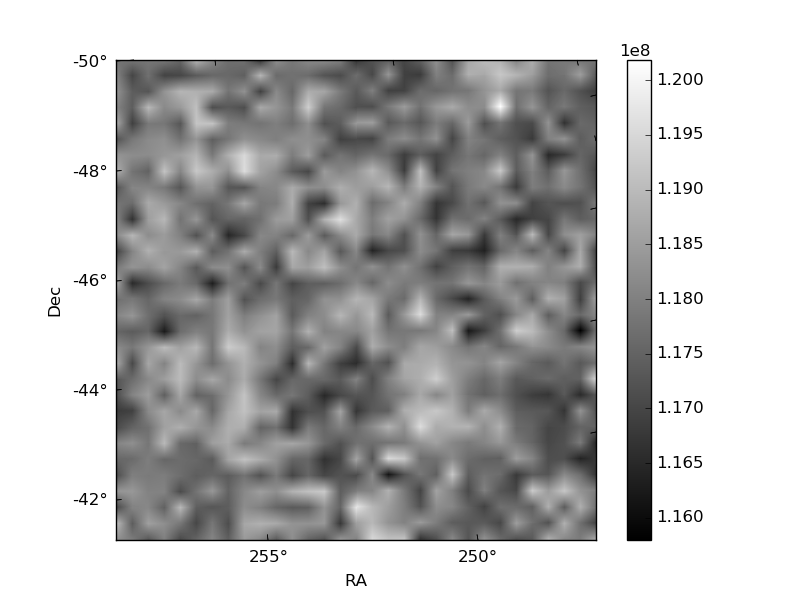
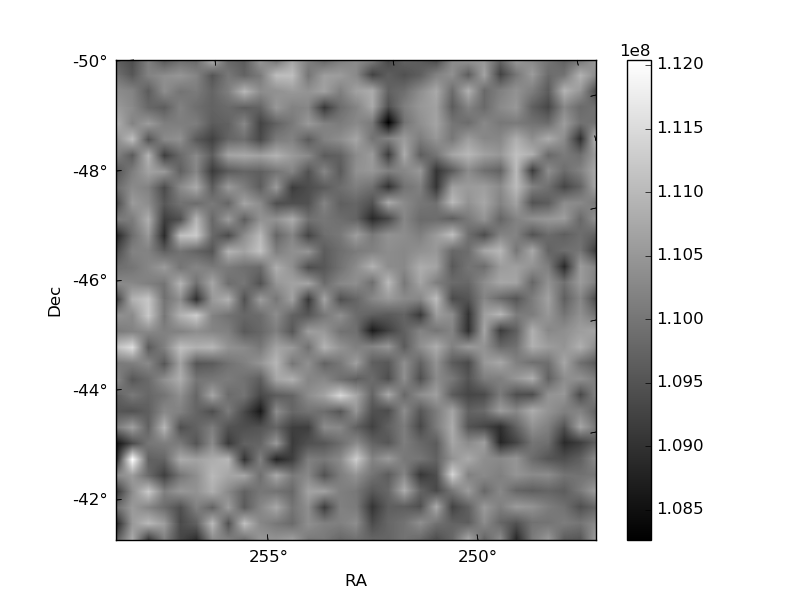
Histogram calculated using DETX and DETY for each event in the final _common_clean file
| Quadrant A | 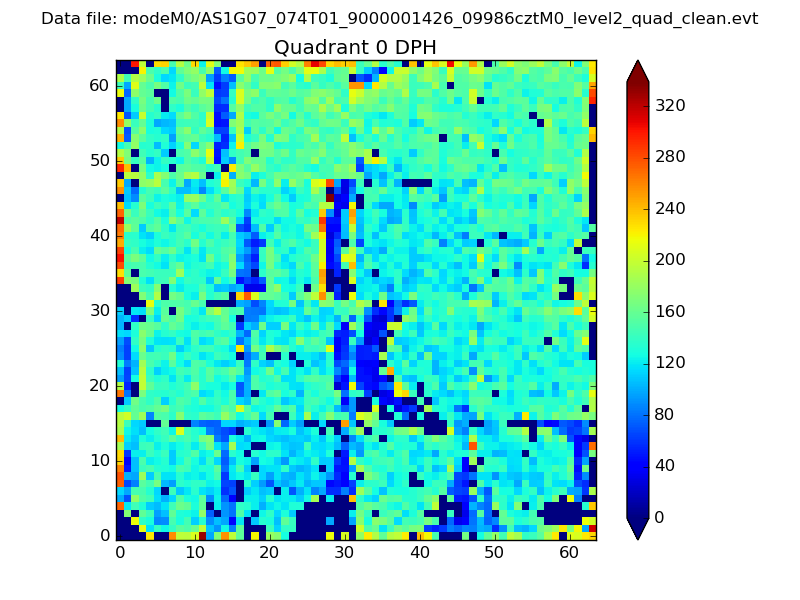 |
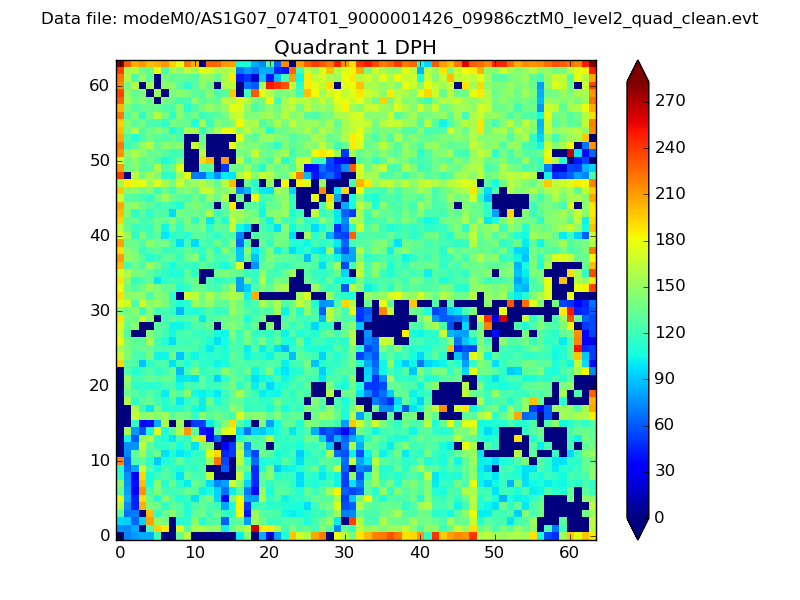 |
Quadrant B |
|---|---|---|---|
| Quadrant D | 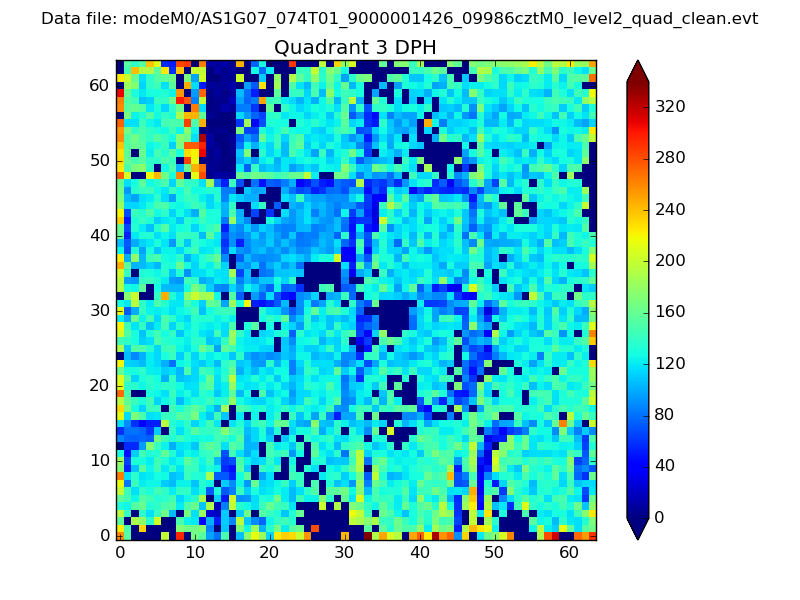 |
 |
Quadrant C |
| Plot type | Count rate plots | Images |
|---|---|---|
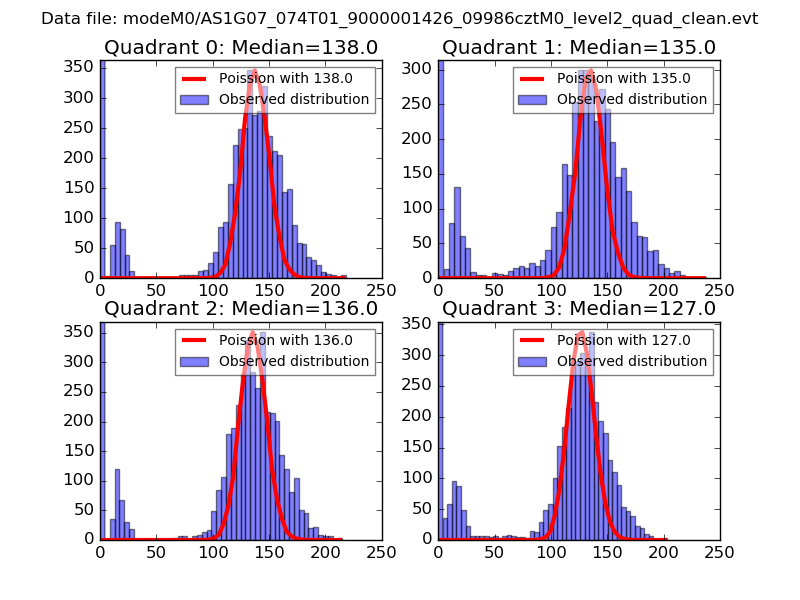
| Comparison with Poisson distribution Blue bars denote a histogram of data divided into 1 sec bins. Red curve is a Poisson curve with rate = median count rate of data. |
 |
 |
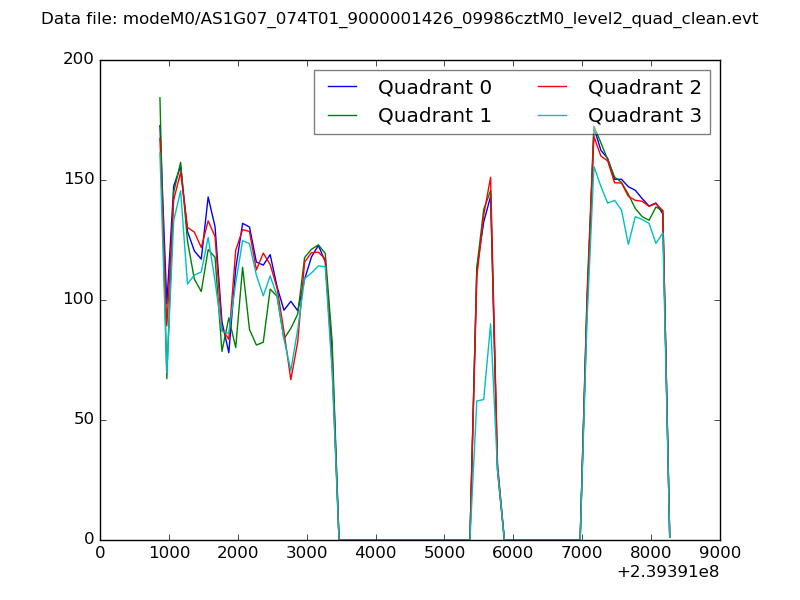
| Quadrant-wise count rates Data is divided into 100 sec bins |
 |
|
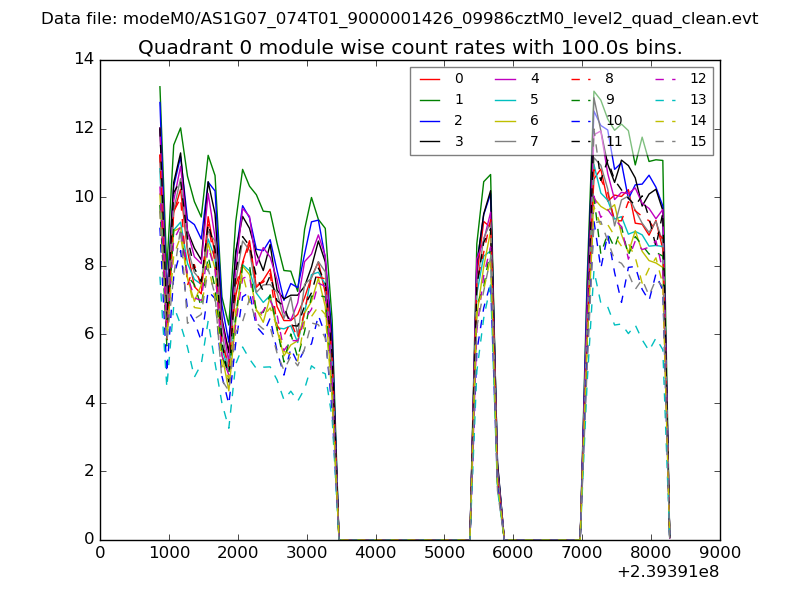
| Module-wise count rates for Quadrant A Data is divided into 100 sec bins |
 |
 |
| Module-wise count rates for Quadrant B Data is divided into 100 sec bins |
 |
 |
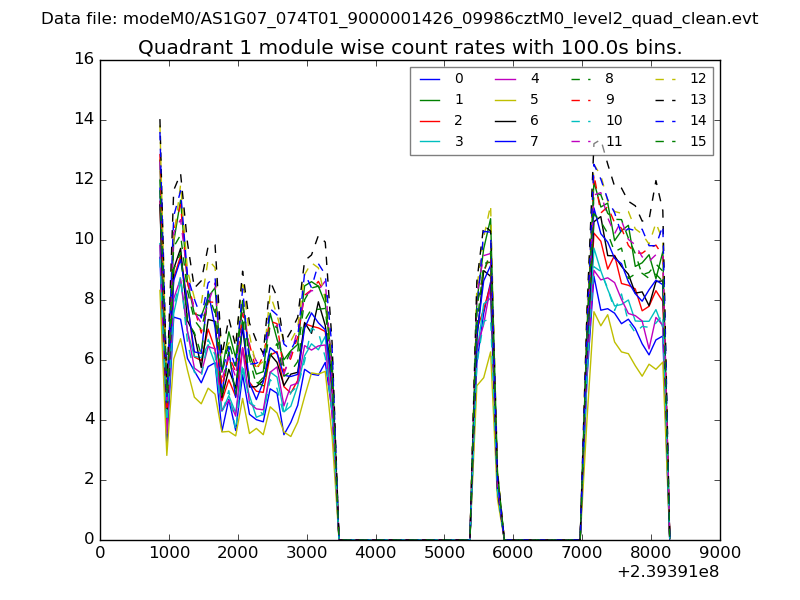
| Module-wise count rates for Quadrant C Data is divided into 100 sec bins |
 |
 |
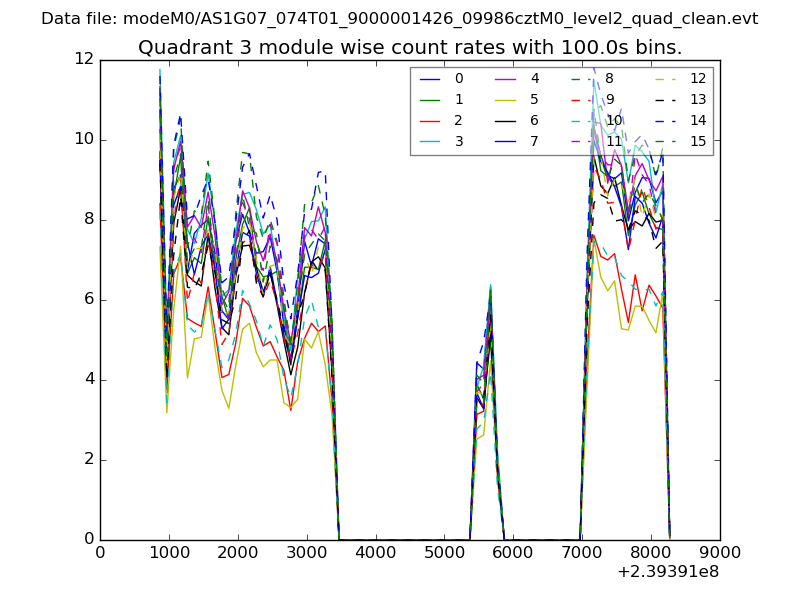
| Module-wise count rates for Quadrant D Data is divided into 100 sec bins |
 |
 |
| Parameter | Plot |
|---|---|
| CZT HV Monitor | 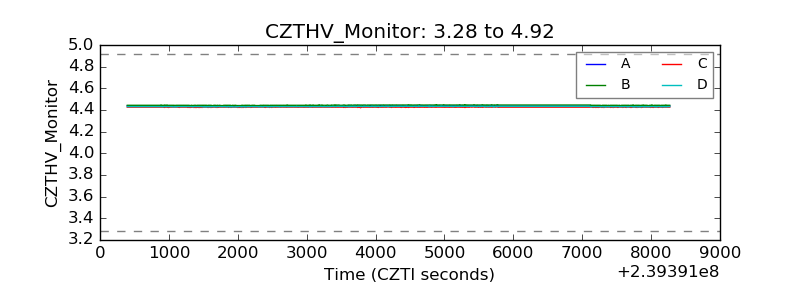 |
| D_VDD |  |
| Temperature 1 | 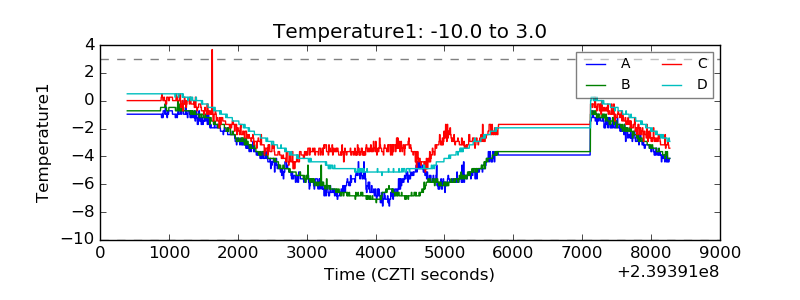 |
| Veto HV Monitor |  |
| Veto LLD | 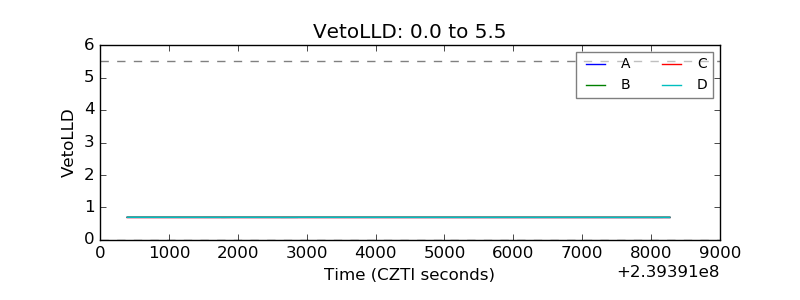 |
| Alpha Counter | 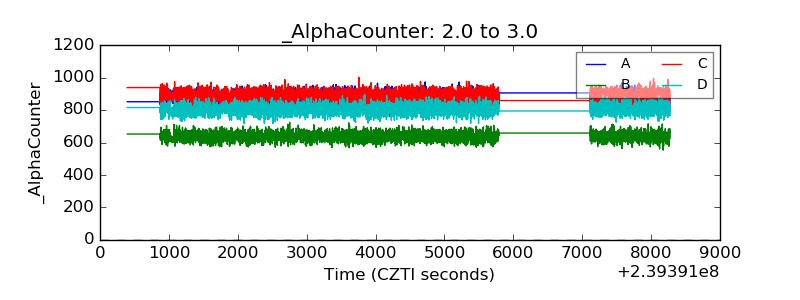 |
| _CPM_Rate | 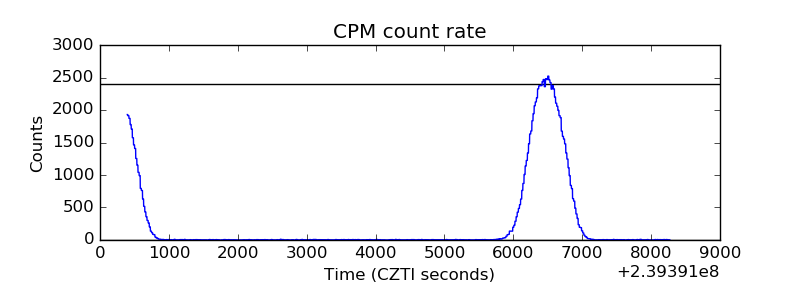 |
| CZT Counter | 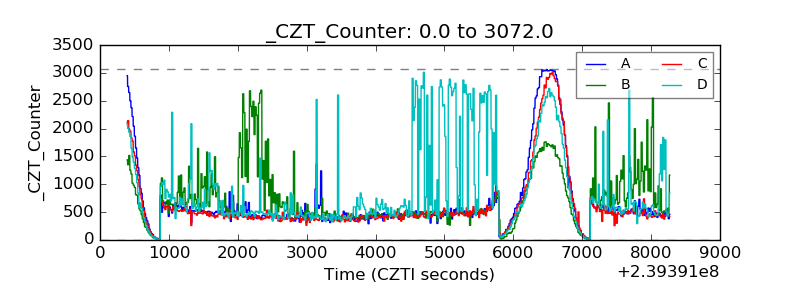 |
| +2.5 Volts monitor |  |
| +5 Volts monitor |  |
| _ROLL_ROT | 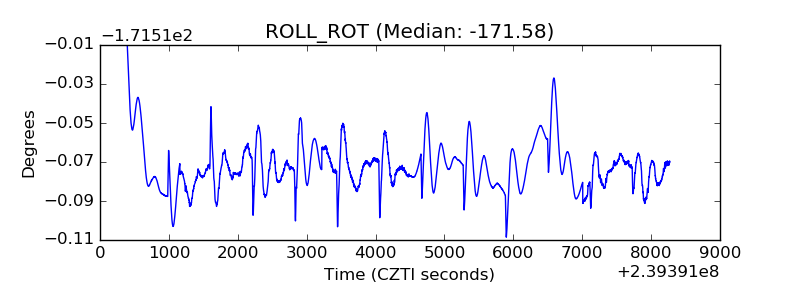 |
| _Roll_DEC | 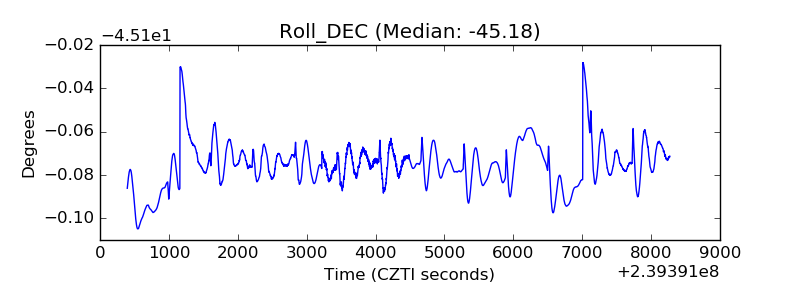 |
| _Roll_RA |  |
| Veto Counter | 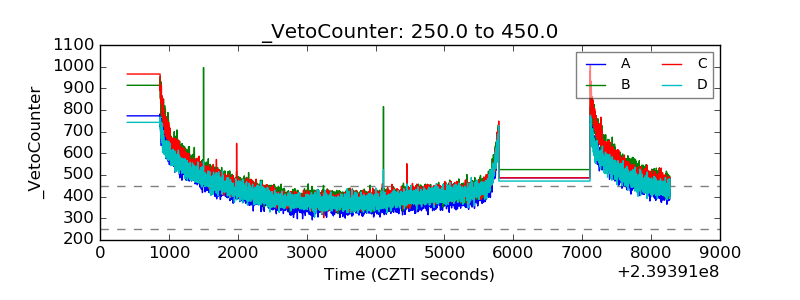 |