| Param | Original file | Final file |
|---|---|---|
| Filename | modeM0/AS1G07_074T01_9000001426_09987cztM0_level2.evt | modeM0/AS1G07_074T01_9000001426_09987cztM0_level2_quad_clean.evt |
| Size (bytes) | 592,657,920 | 85,717,440 |
| Size | 565.2 MB | 81.7 MB |
| Events in quadrant A | 4,071,687 | 516,993 |
| Events in quadrant B | 3,776,412 | 583,188 |
| Events in quadrant C | 2,820,715 | 576,492 |
| Events in quadrant D | 6,862,800 | 488,936 |
| Mode M9 | |||
|---|---|---|---|
| Quadrant | BADHDUFLAG | Total packets | Discarded packets |
| A | 0 | 21 | 0 |
| B | 0 | 21 | 0 |
| C | 0 | 21 | 0 |
| D | 0 | 22 | 0 |
| Mode M0 | |||
|---|---|---|---|
| Quadrant | BADHDUFLAG | Total packets | Discarded packets |
| A | 0 | 16193 | 3 |
| B | 0 | 15349 | 9 |
| C | 0 | 12613 | 6 |
| D | 0 | 24660 | 2 |
| Mode SS | |||
|---|---|---|---|
| Quadrant | BADHDUFLAG | Total packets | Discarded packets |
| A | 0 | 124 | 0 |
| B | 0 | 124 | 0 |
| C | 0 | 124 | 0 |
| D | 0 | 124 | 0 |
| Quadrant | Total seconds | Saturated seconds | Saturation percentage |
|---|---|---|---|
| A | 6149 | 804 | 13.075297% |
| B | 6148 | 129 | 2.098243% |
| C | 6147 | 7 | 0.113877% |
| D | 6149 | 1130 | 18.376972% |
Noise dominated data is calculated using 1-second bins in cleaned event files. If a bin has >2000 counts, and if more than 50% of those come from <1% of pixels, then it is considered to be noise-dominated and hence unusable.
| Quadrant | # 1 sec bins | Bins with >0 counts | Bins with >2000 counts | High rate bins dominated by noise | Noise dominated (total time) | Noise dominated (detector-on time) | Marked lightcurve |
|---|---|---|---|---|---|---|---|
| A | 7529 | 6149 | 272 | 272 | 3.61% | 4.42% | 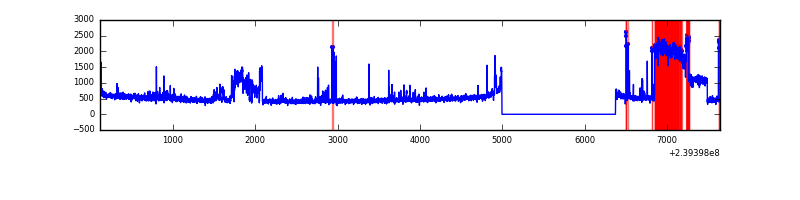 |
| B | 7529 | 6150 | 69 | 69 | 0.92% | 1.12% | 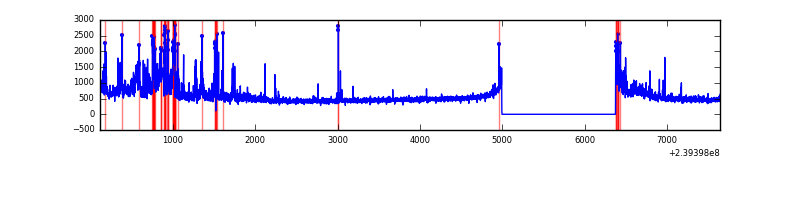 |
| C | 7529 | 6150 | 0 | 0 | 0.00% | 0.00% | 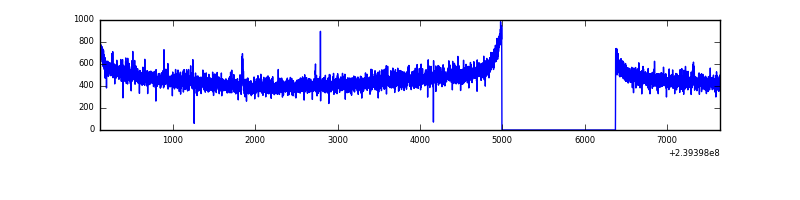 |
| D | 7529 | 6150 | 1210 | 1210 | 16.07% | 19.67% | 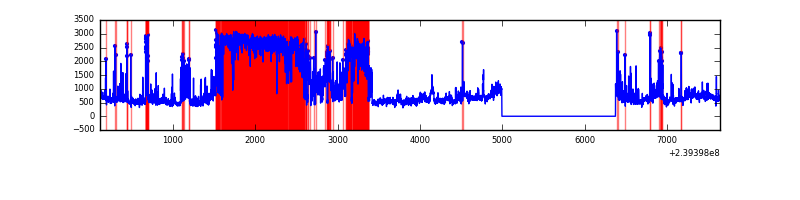 |
Top three noisy pixels from each quadrant. If the there are fewer than three noisy pixels in the level2.evt file, extra rows are filled as -1
| Pixel properties | Quadrant properties | ||||||
|---|---|---|---|---|---|---|---|
| Quadrant | DetID | PixID | Counts | Sigma | Mean | Median | Sigma |
| A | 14 | 111 | 1364783 | 9725.68 | 695 | 684 | 140.3 |
| A | 15 | 174 | 16988 | 116.24 | 695 | 684 | 140.3 |
| A | 8 | 15 | 11013 | 73.64 | 695 | 684 | 140.3 |
| B | 0 | 85 | 407176 | 2855.93 | 751 | 736 | 142.3 |
| B | 4 | 239 | 138048 | 964.85 | 751 | 736 | 142.3 |
| B | 11 | 51 | 105105 | 733.37 | 751 | 736 | 142.3 |
| C | 9 | 221 | 6247 | 33.31 | 720 | 725 | 165.8 |
| C | 13 | 61 | 5535 | 29.01 | 720 | 725 | 165.8 |
| C | 12 | 4 | 4254 | 21.29 | 720 | 725 | 165.8 |
| D | 1 | 52 | 3496570 | 19432.26 | 660 | 644 | 179.9 |
| D | 8 | 195 | 256411 | 1421.69 | 660 | 644 | 179.9 |
| D | 2 | 16 | 197727 | 1095.49 | 660 | 644 | 179.9 |
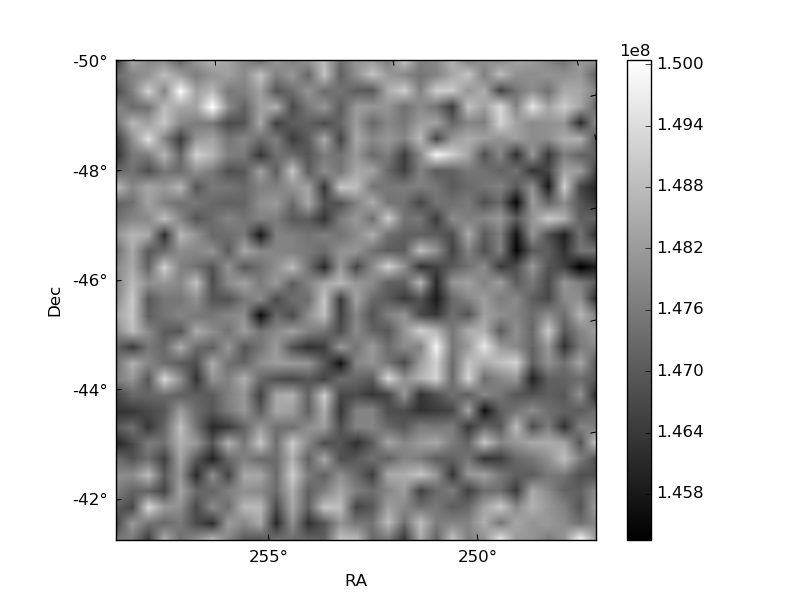
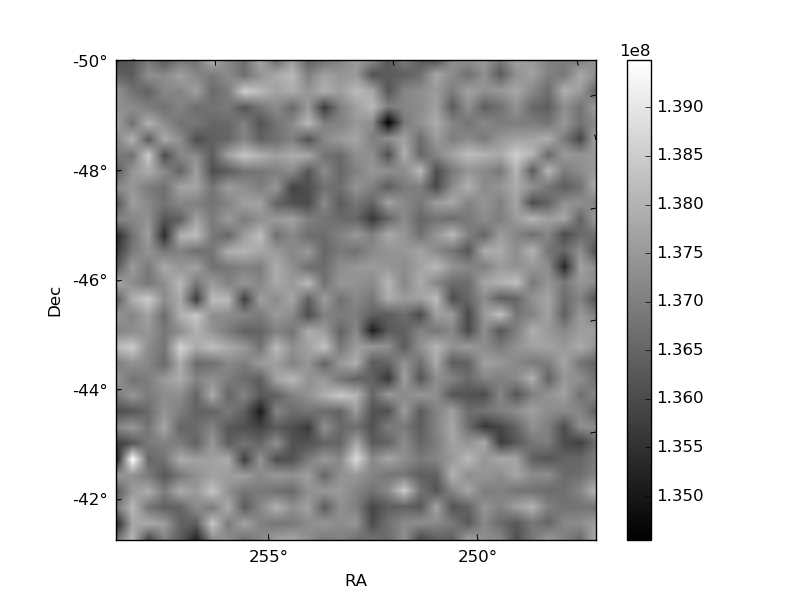
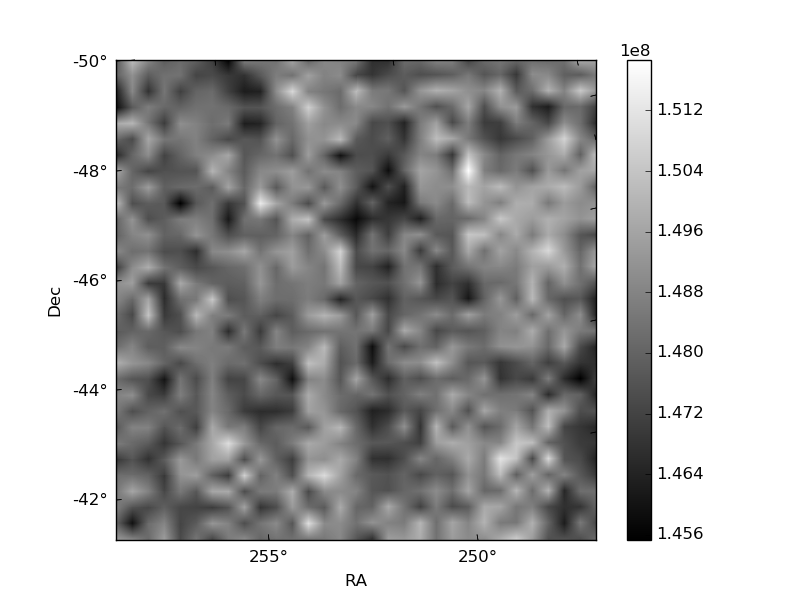
Histogram calculated using DETX and DETY for each event in the final _common_clean file
| Quadrant A | 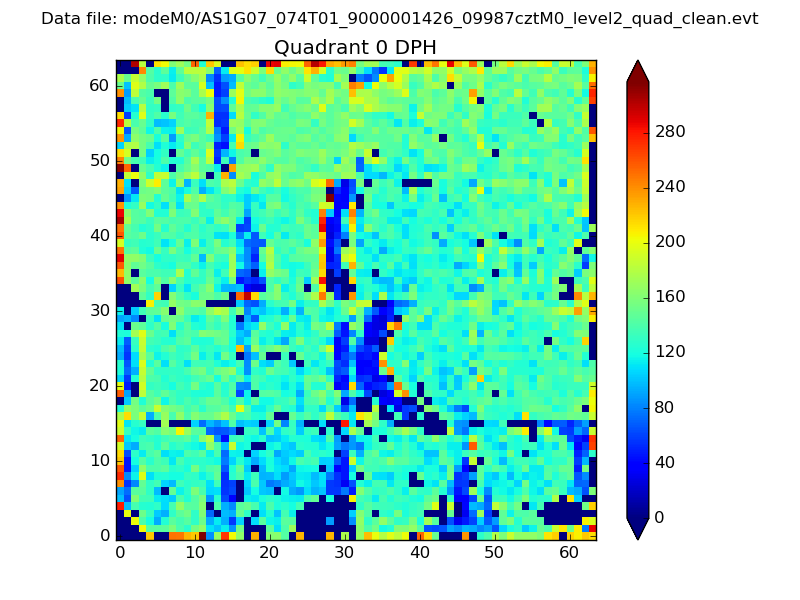 |
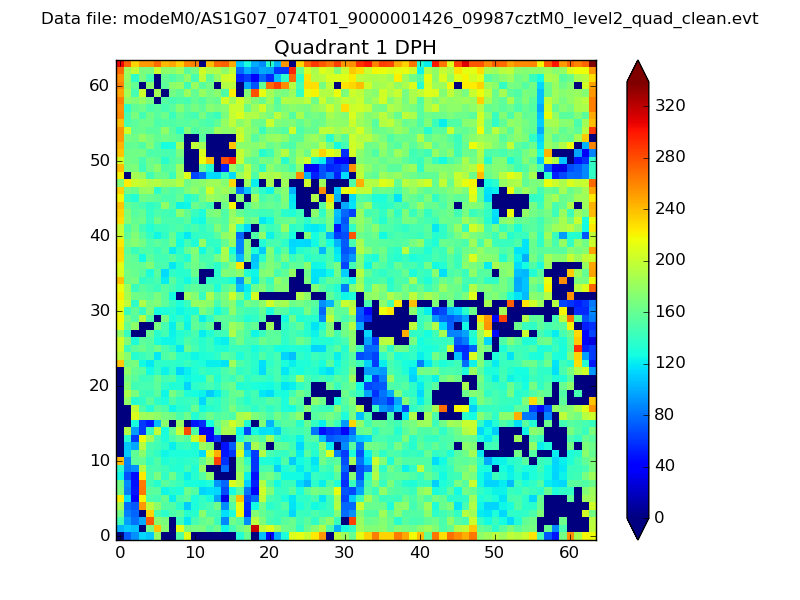 |
Quadrant B |
|---|---|---|---|
| Quadrant D |  |
 |
Quadrant C |
| Plot type | Count rate plots | Images |
|---|---|---|
| Comparison with Poisson distribution Blue bars denote a histogram of data divided into 1 sec bins. Red curve is a Poisson curve with rate = median count rate of data. |
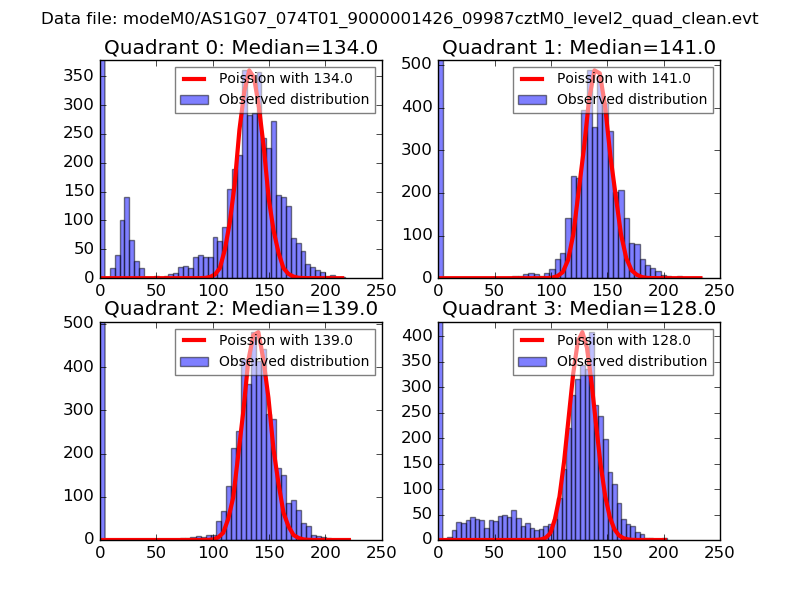 |
 |
| Quadrant-wise count rates Data is divided into 100 sec bins |
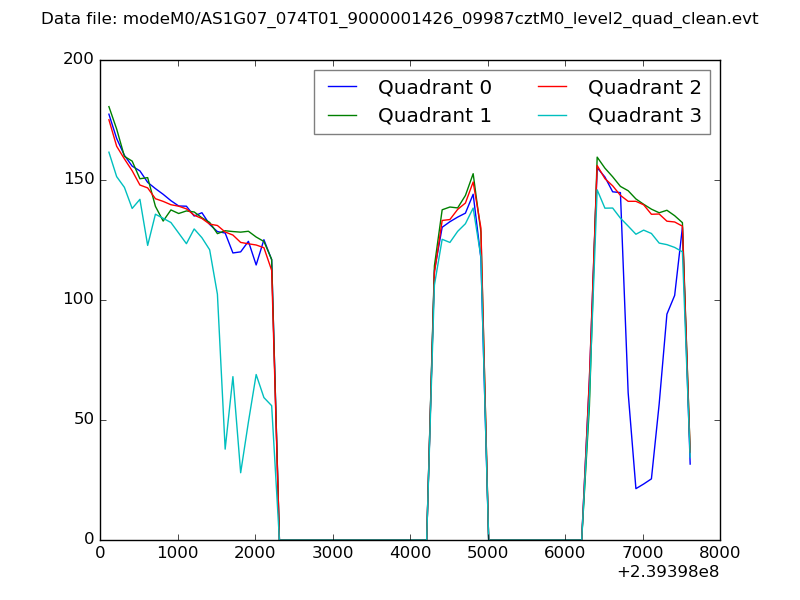 |
|
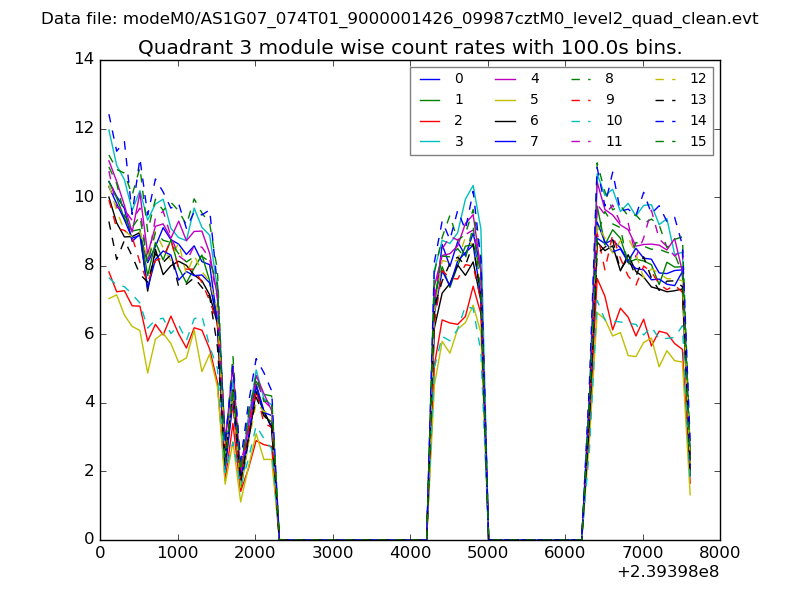
| Module-wise count rates for Quadrant A Data is divided into 100 sec bins |
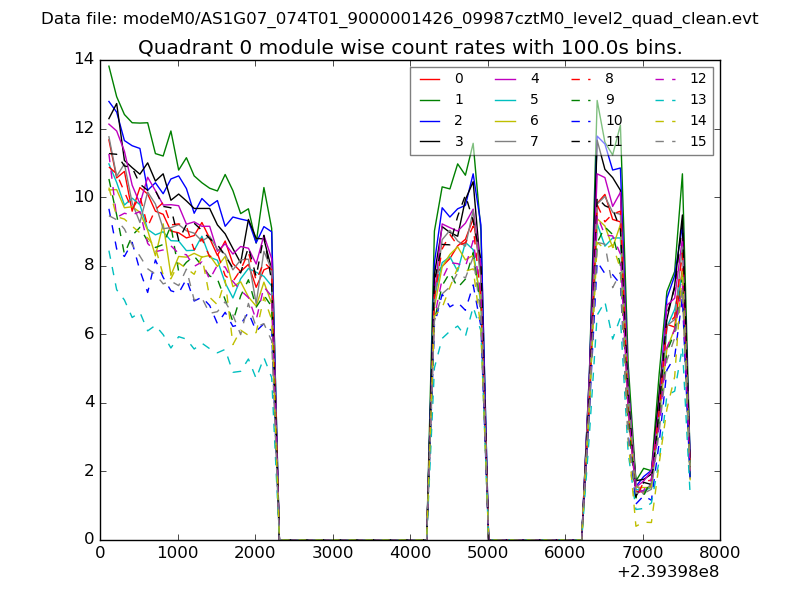 |
 |
| Module-wise count rates for Quadrant B Data is divided into 100 sec bins |
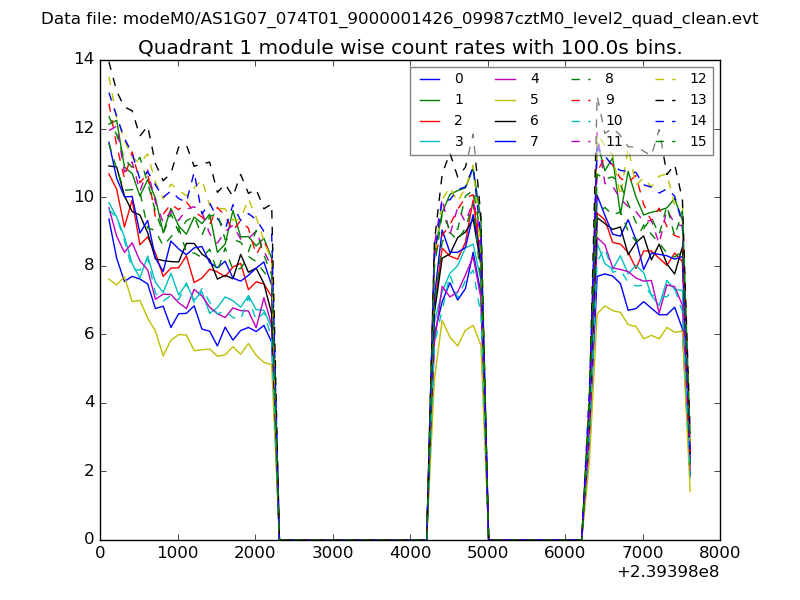 |
 |
| Module-wise count rates for Quadrant C Data is divided into 100 sec bins |
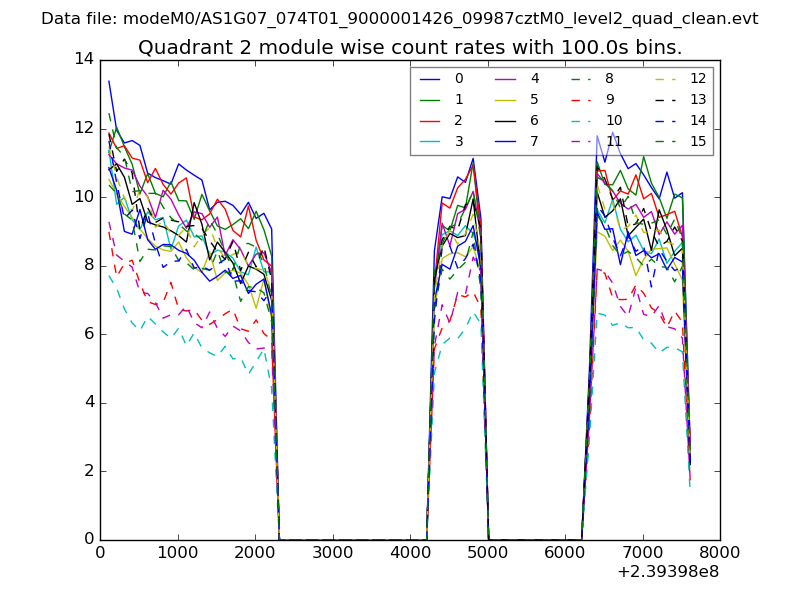 |
 |
| Module-wise count rates for Quadrant D Data is divided into 100 sec bins |
 |
 |
| Parameter | Plot |
|---|---|
| CZT HV Monitor | 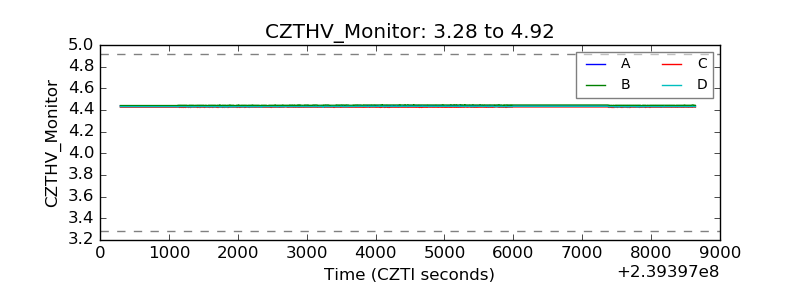 |
| D_VDD | 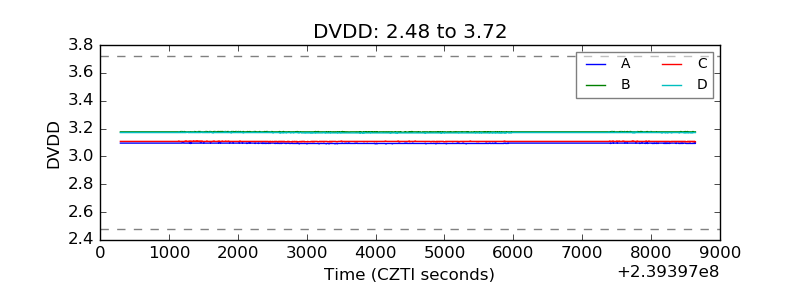 |
| Temperature 1 | 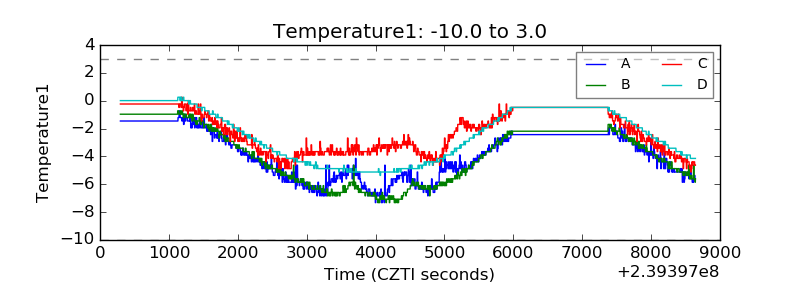 |
| Veto HV Monitor | 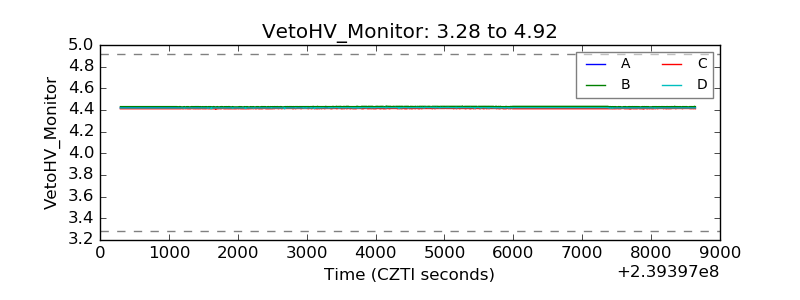 |
| Veto LLD | 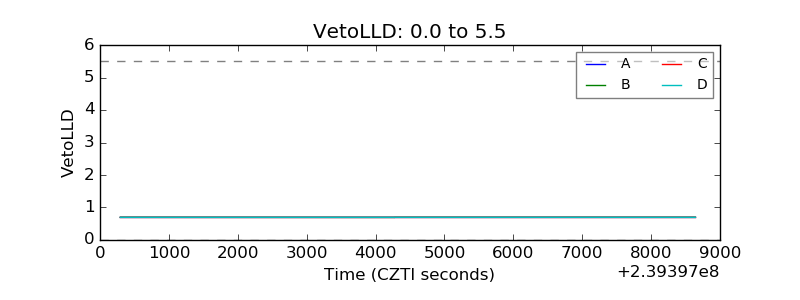 |
| Alpha Counter | 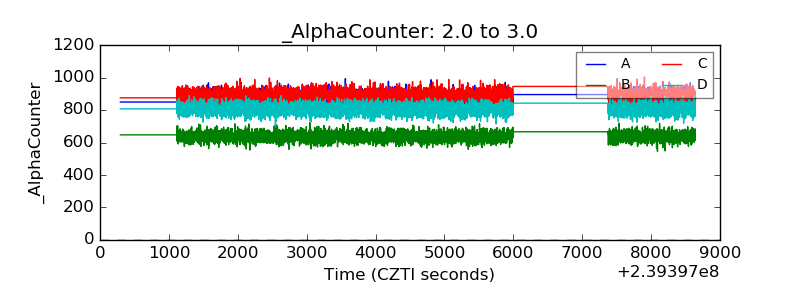 |
| _CPM_Rate | 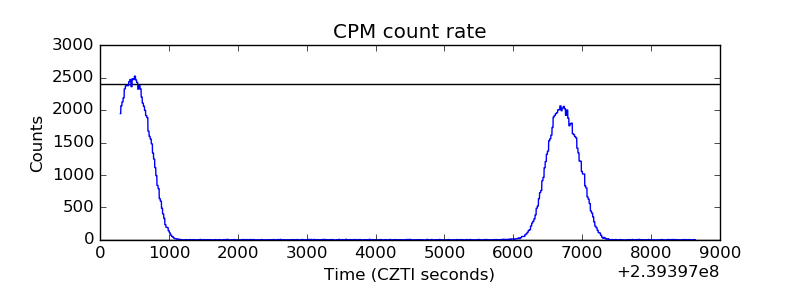 |
| CZT Counter |  |
| +2.5 Volts monitor | 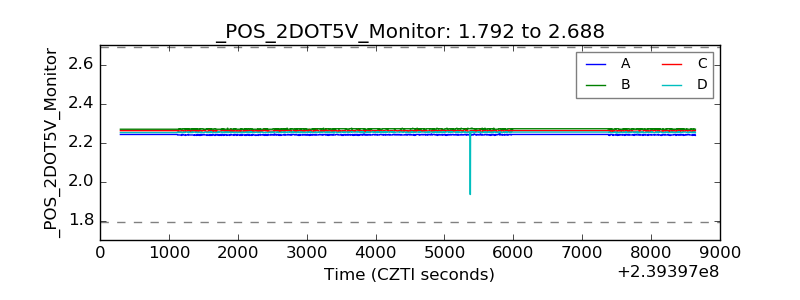 |
| +5 Volts monitor |  |
| _ROLL_ROT | 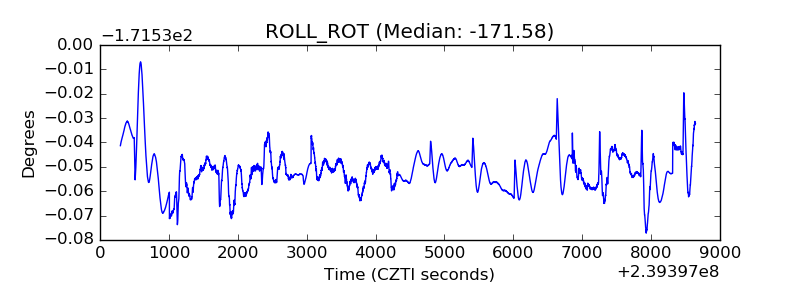 |
| _Roll_DEC | 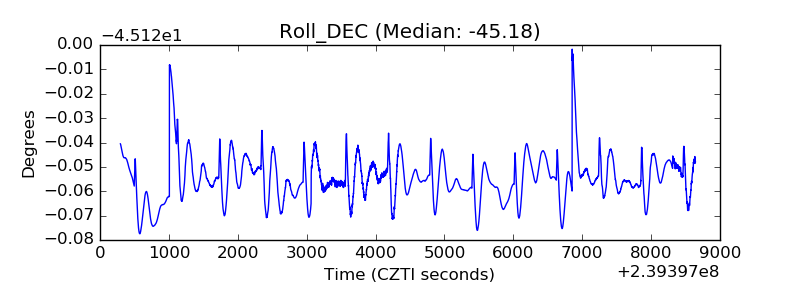 |
| _Roll_RA |  |
| Veto Counter | 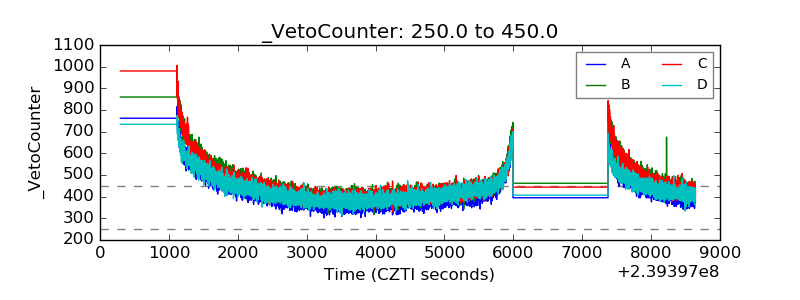 |