| Param | Original file | Final file |
|---|---|---|
| Filename | modeM0/AS1G07_074T01_9000001426_09988cztM0_level2.evt | modeM0/AS1G07_074T01_9000001426_09988cztM0_level2_quad_clean.evt |
| Size (bytes) | 515,689,920 | 83,252,160 |
| Size | 491.8 MB | 79.4 MB |
| Events in quadrant A | 4,055,512 | 479,103 |
| Events in quadrant B | 3,232,966 | 555,721 |
| Events in quadrant C | 2,764,991 | 552,910 |
| Events in quadrant D | 5,152,440 | 509,709 |
| Mode M9 | |||
|---|---|---|---|
| Quadrant | BADHDUFLAG | Total packets | Discarded packets |
| A | 0 | 15 | 0 |
| B | 0 | 15 | 0 |
| C | 0 | 15 | 0 |
| D | 0 | 16 | 0 |
| Mode M0 | |||
|---|---|---|---|
| Quadrant | BADHDUFLAG | Total packets | Discarded packets |
| A | 0 | 16243 | 205 |
| B | 0 | 13889 | 154 |
| C | 0 | 12570 | 75 |
| D | 0 | 19709 | 268 |
| Mode SS | |||
|---|---|---|---|
| Quadrant | BADHDUFLAG | Total packets | Discarded packets |
| A | 0 | 124 | 2 |
| B | 0 | 124 | 0 |
| C | 0 | 124 | 0 |
| D | 0 | 124 | 0 |
| Quadrant | Total seconds | Saturated seconds | Saturation percentage |
|---|---|---|---|
| A | 6057 | 872 | 14.396566% |
| B | 6056 | 83 | 1.370542% |
| C | 6076 | 10 | 0.164582% |
| D | 6049 | 498 | 8.232766% |
Noise dominated data is calculated using 1-second bins in cleaned event files. If a bin has >2000 counts, and if more than 50% of those come from <1% of pixels, then it is considered to be noise-dominated and hence unusable.
| Quadrant | # 1 sec bins | Bins with >0 counts | Bins with >2000 counts | High rate bins dominated by noise | Noise dominated (total time) | Noise dominated (detector-on time) | Marked lightcurve |
|---|---|---|---|---|---|---|---|
| A | 7416 | 6091 | 290 | 290 | 3.91% | 4.76% | 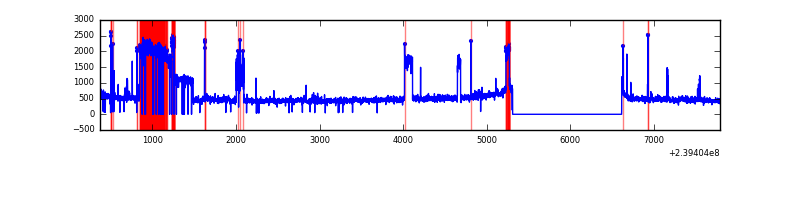 |
| B | 7416 | 6104 | 31 | 31 | 0.42% | 0.51% | 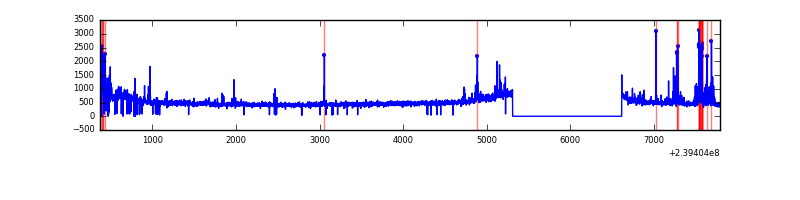 |
| C | 7416 | 6112 | 0 | 0 | 0.00% | 0.00% | 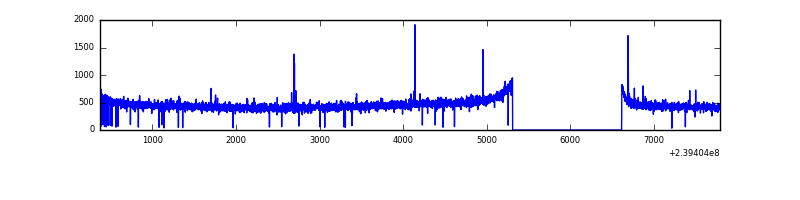 |
| D | 7416 | 6098 | 477 | 477 | 6.43% | 7.82% | 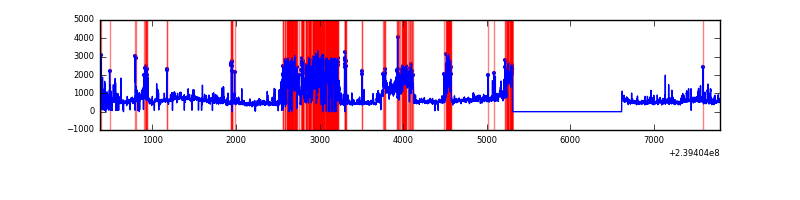 |
Top three noisy pixels from each quadrant. If the there are fewer than three noisy pixels in the level2.evt file, extra rows are filled as -1
| Pixel properties | Quadrant properties | ||||||
|---|---|---|---|---|---|---|---|
| Quadrant | DetID | PixID | Counts | Sigma | Mean | Median | Sigma |
| A | 14 | 111 | 1450687 | 10736.99 | 659 | 646 | 135.1 |
| A | 8 | 15 | 37134 | 270.18 | 659 | 646 | 135.1 |
| A | 15 | 174 | 34397 | 249.91 | 659 | 646 | 135.1 |
| B | 4 | 81 | 146405 | 1052.62 | 728 | 711 | 138.4 |
| B | 4 | 239 | 78341 | 560.87 | 728 | 711 | 138.4 |
| B | 0 | 219 | 50589 | 360.36 | 728 | 711 | 138.4 |
| C | 14 | 234 | 8752 | 49.63 | 703 | 708 | 162.1 |
| C | 8 | 208 | 6683 | 36.87 | 703 | 708 | 162.1 |
| C | 13 | 61 | 5384 | 28.85 | 703 | 708 | 162.1 |
| D | 1 | 52 | 2008764 | 11405.61 | 666 | 648 | 176.1 |
| D | 8 | 195 | 274807 | 1557.16 | 666 | 648 | 176.1 |
| D | 2 | 16 | 170534 | 964.91 | 666 | 648 | 176.1 |
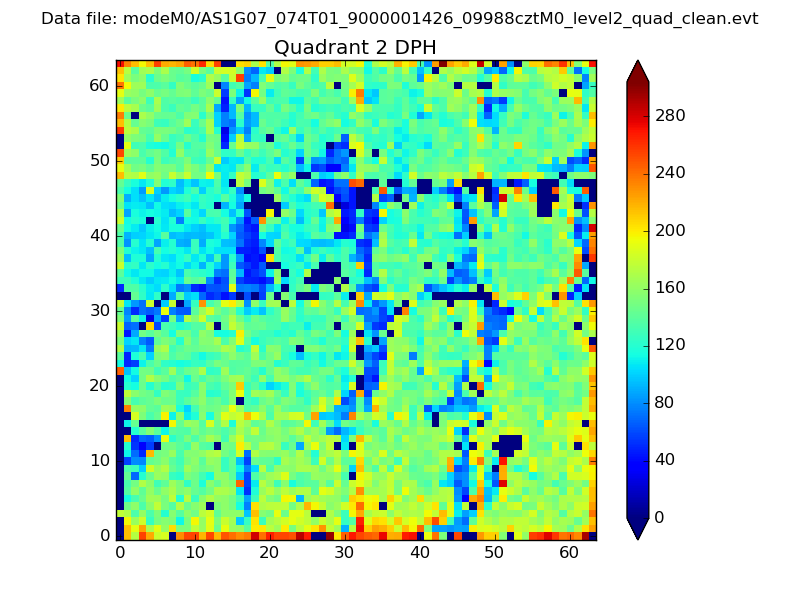
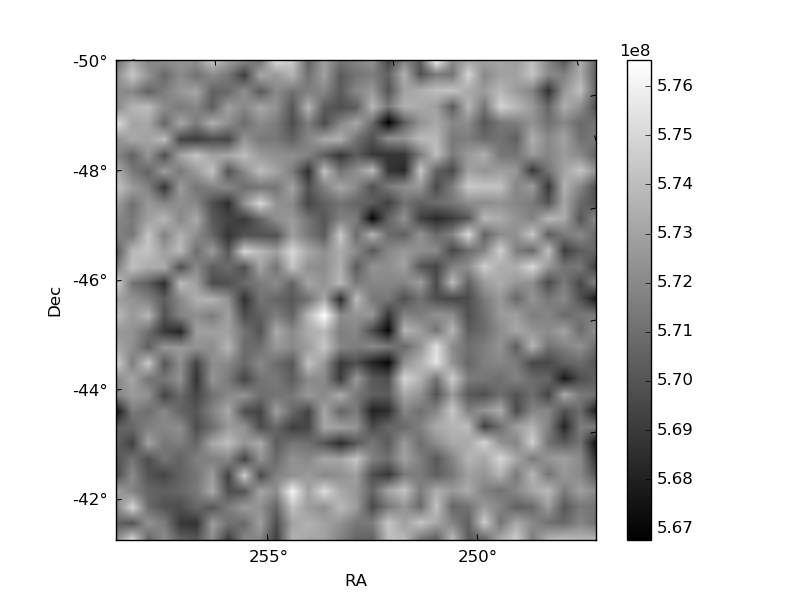
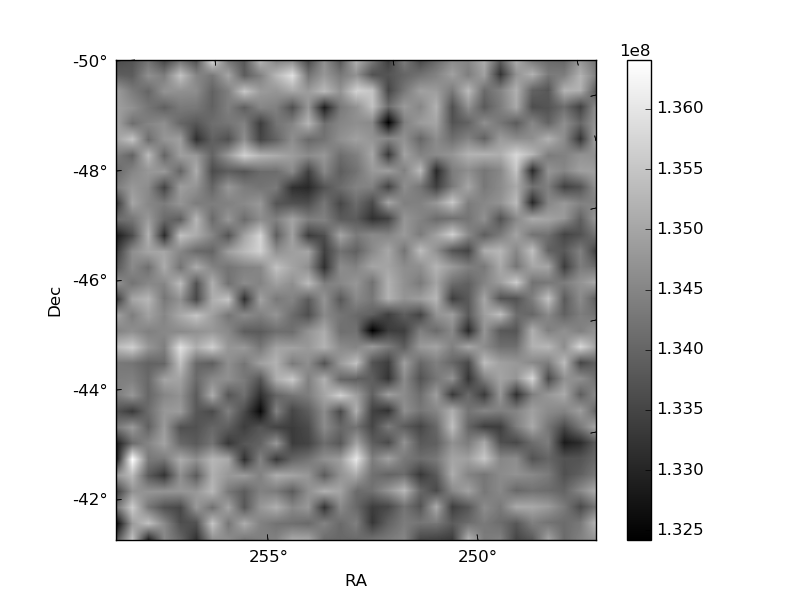
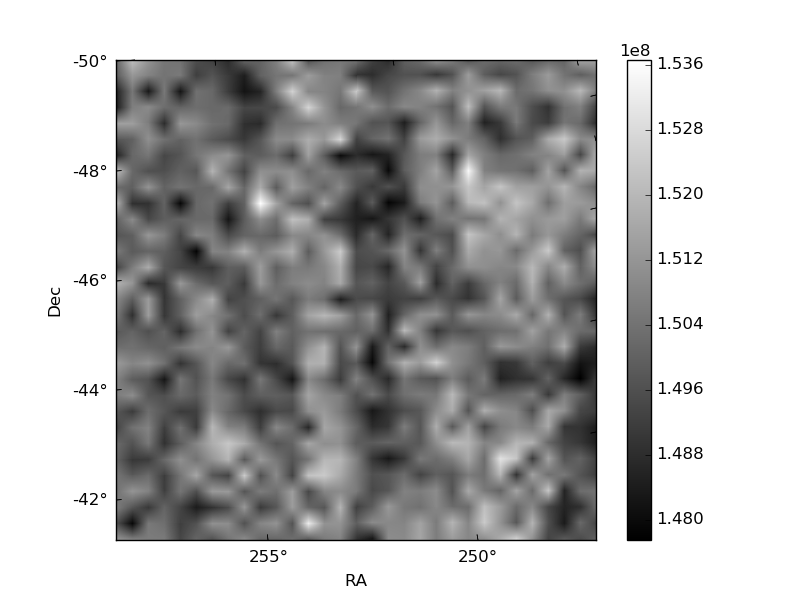
Histogram calculated using DETX and DETY for each event in the final _common_clean file
| Quadrant A | 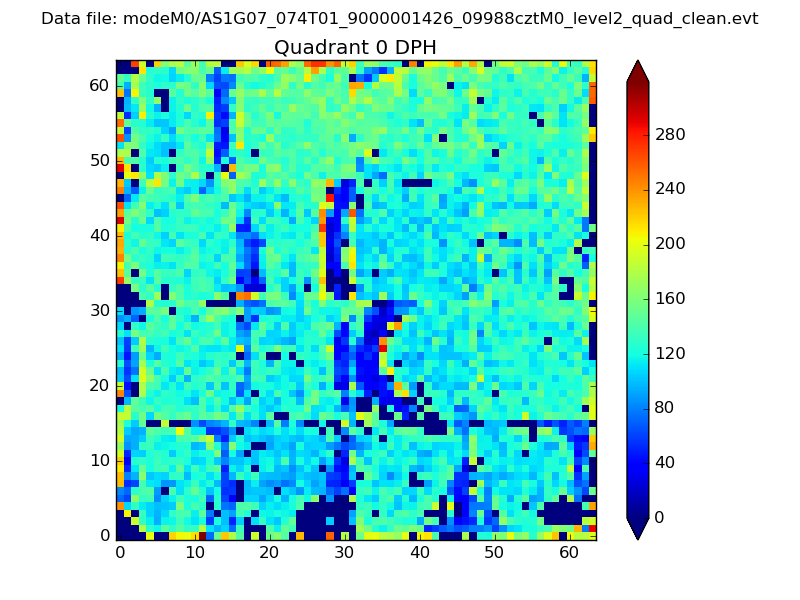 |
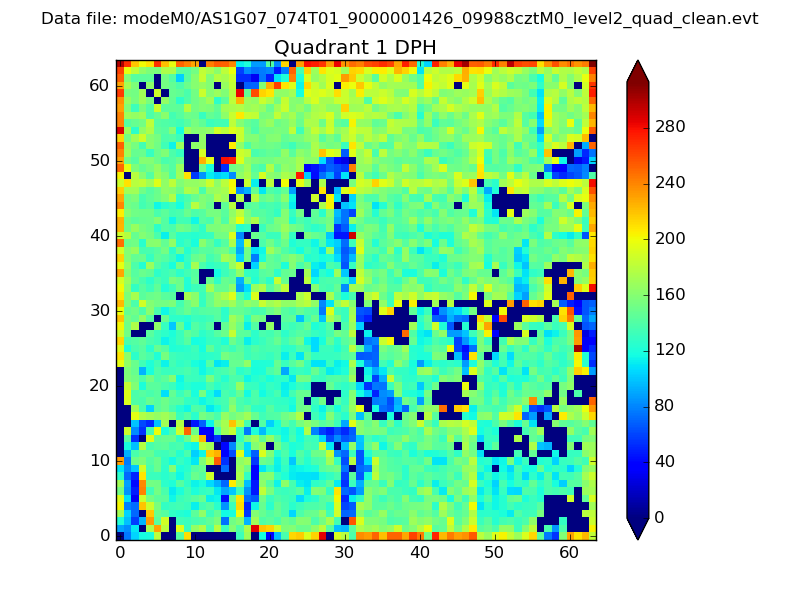 |
Quadrant B |
|---|---|---|---|
| Quadrant D | 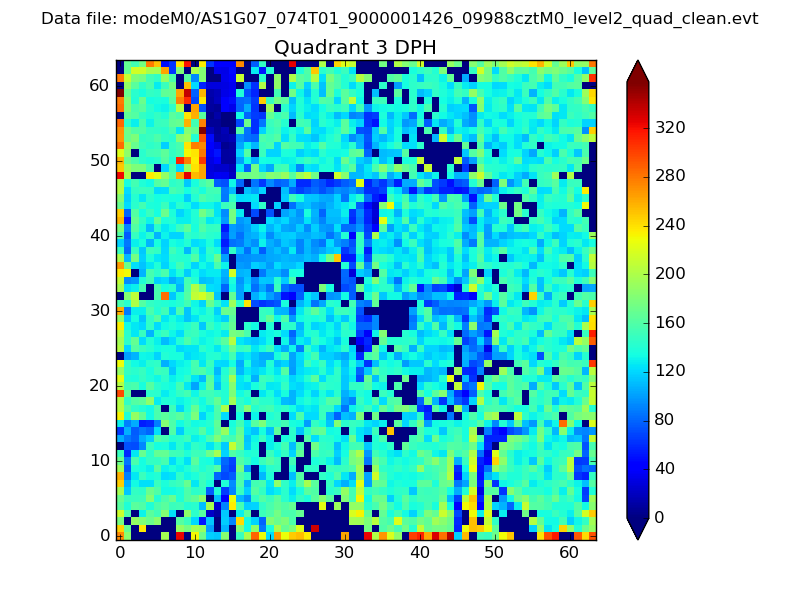 |
 |
Quadrant C |
| Plot type | Count rate plots | Images |
|---|---|---|
| Comparison with Poisson distribution Blue bars denote a histogram of data divided into 1 sec bins. Red curve is a Poisson curve with rate = median count rate of data. |
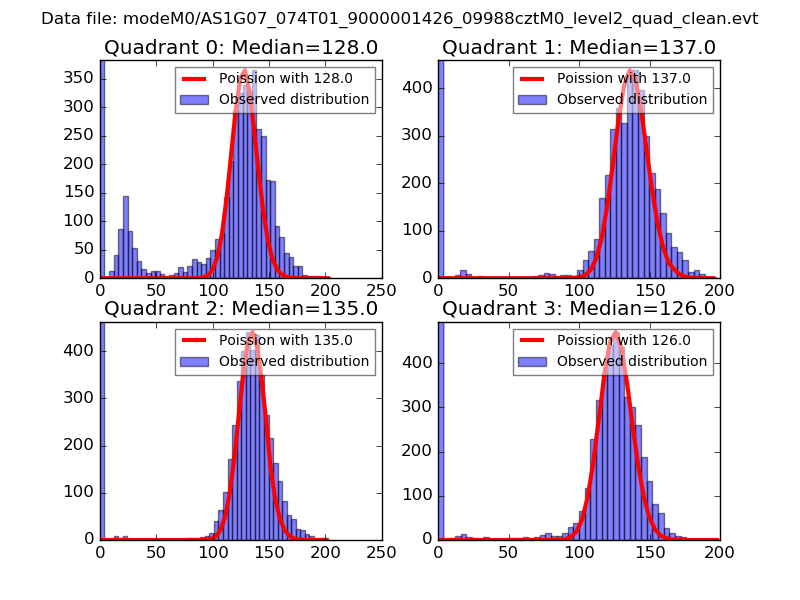 |
 |
| Quadrant-wise count rates Data is divided into 100 sec bins |
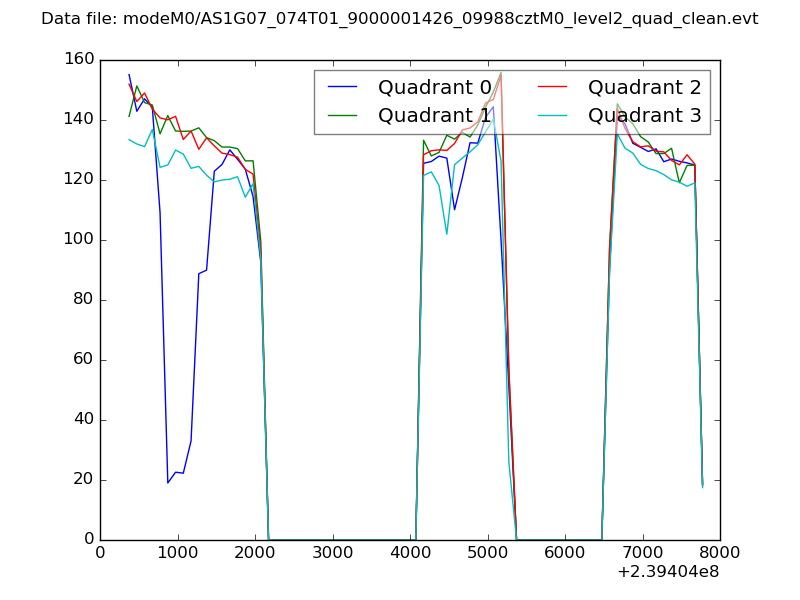 |
|
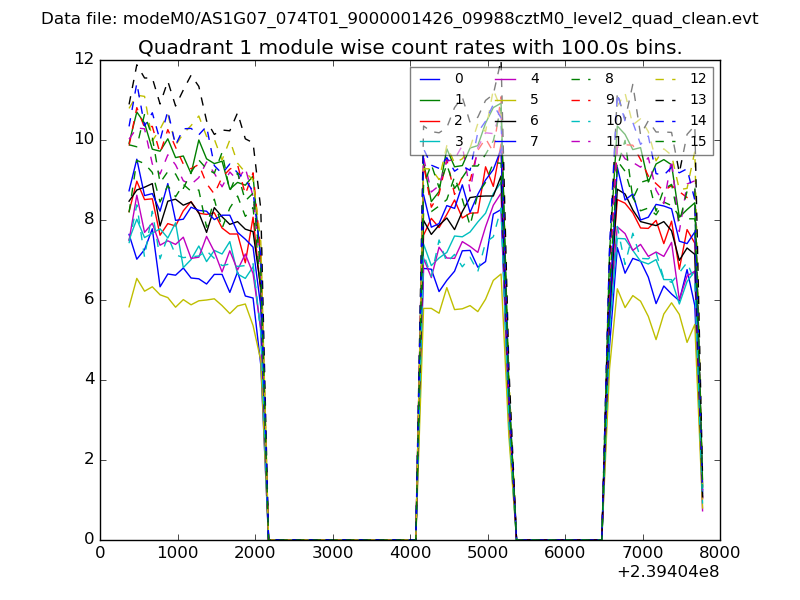
| Module-wise count rates for Quadrant A Data is divided into 100 sec bins |
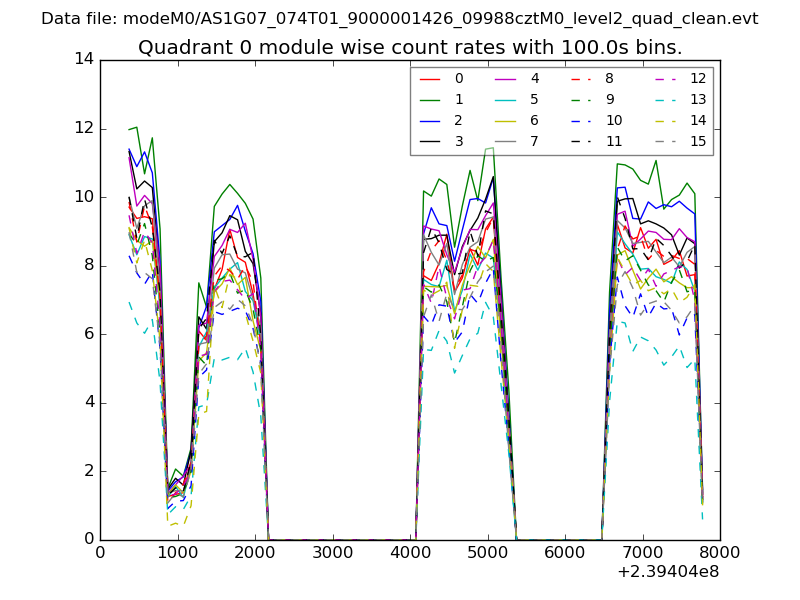 |
 |
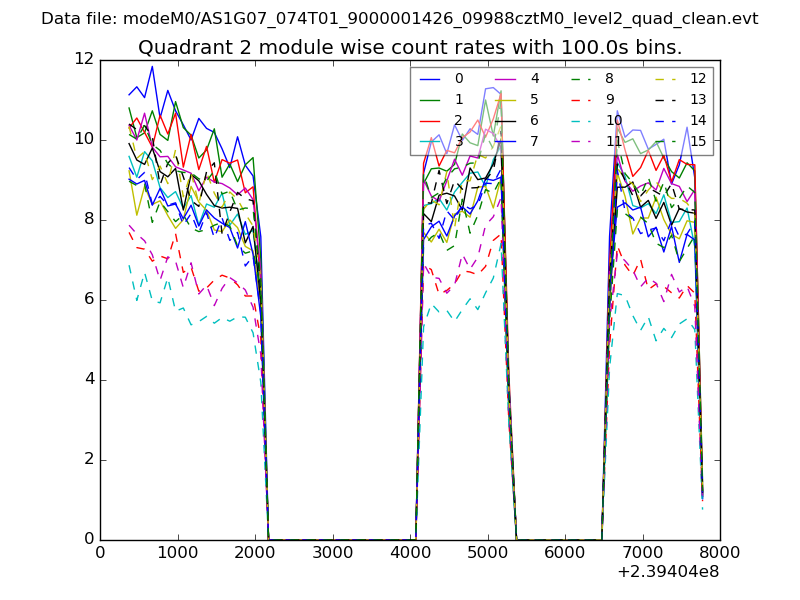
| Module-wise count rates for Quadrant B Data is divided into 100 sec bins |
 |
 |
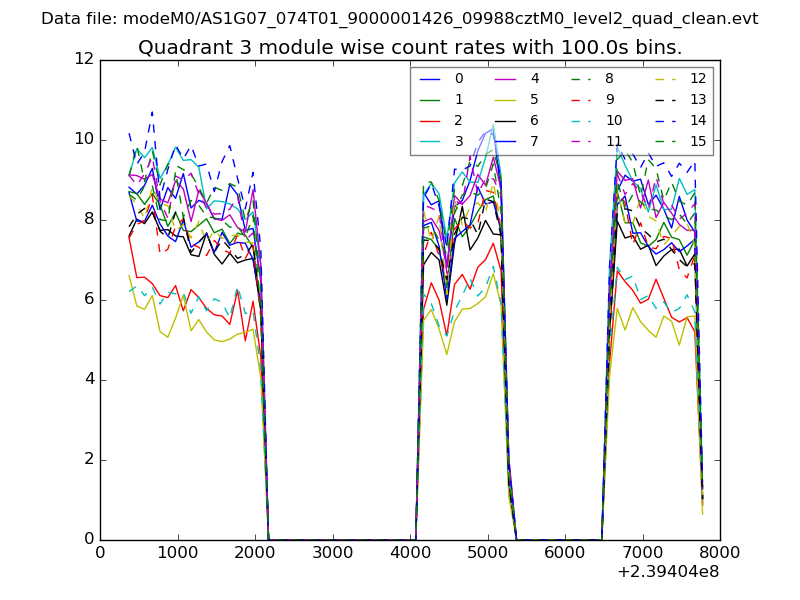
| Module-wise count rates for Quadrant C Data is divided into 100 sec bins |
 |
 |
| Module-wise count rates for Quadrant D Data is divided into 100 sec bins |
 |
 |
| Parameter | Plot |
|---|---|
| CZT HV Monitor | 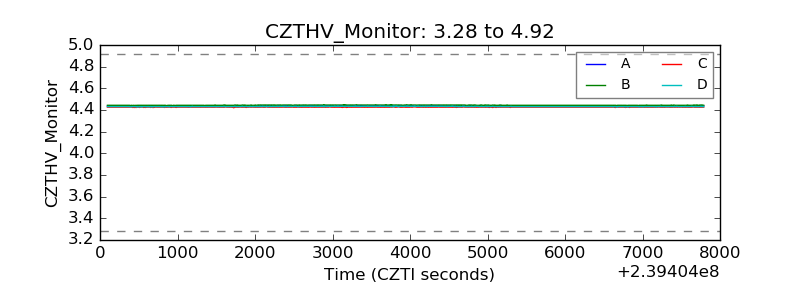 |
| D_VDD | 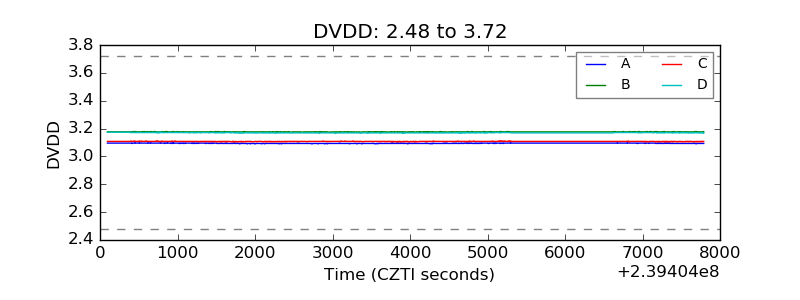 |
| Temperature 1 | 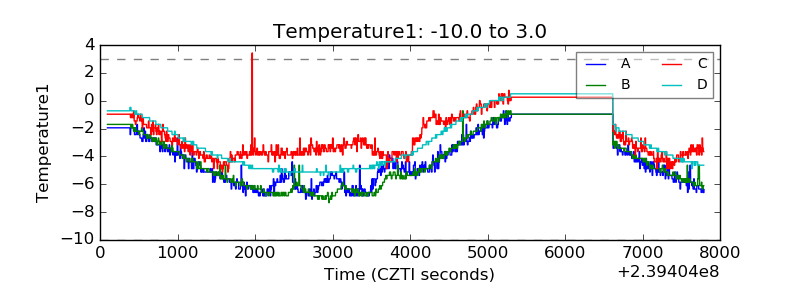 |
| Veto HV Monitor | 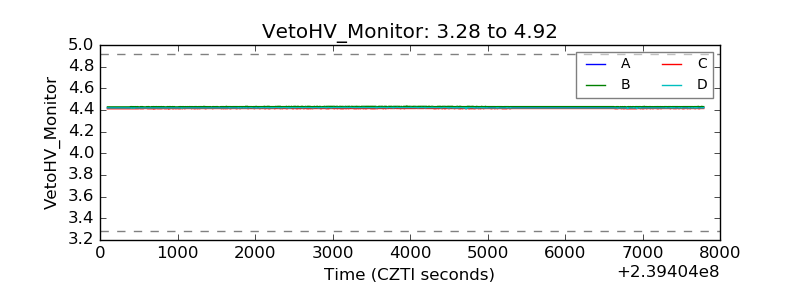 |
| Veto LLD | 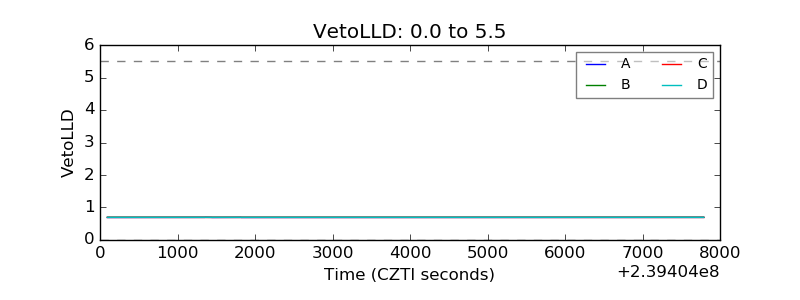 |
| Alpha Counter | 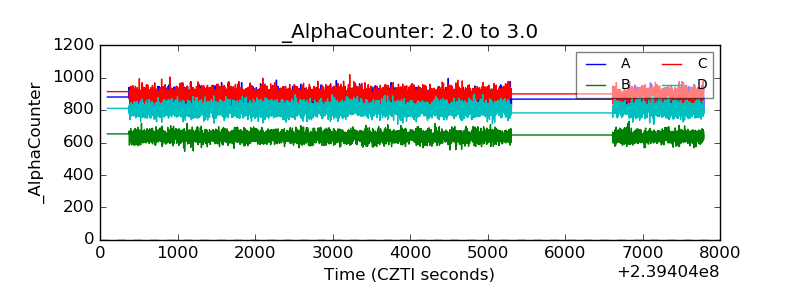 |
| _CPM_Rate | 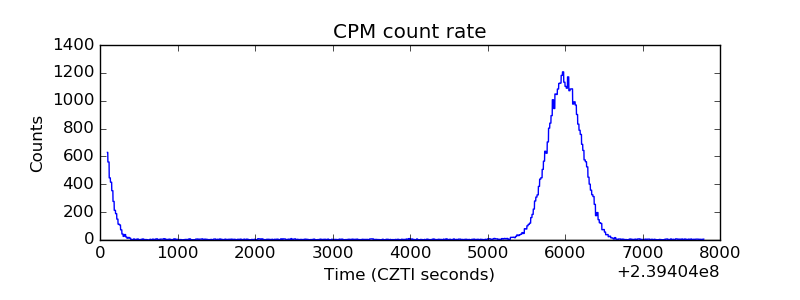 |
| CZT Counter | 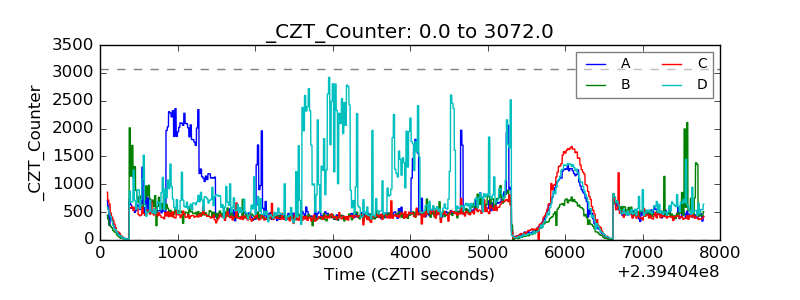 |
| +2.5 Volts monitor |  |
| +5 Volts monitor |  |
| _ROLL_ROT | 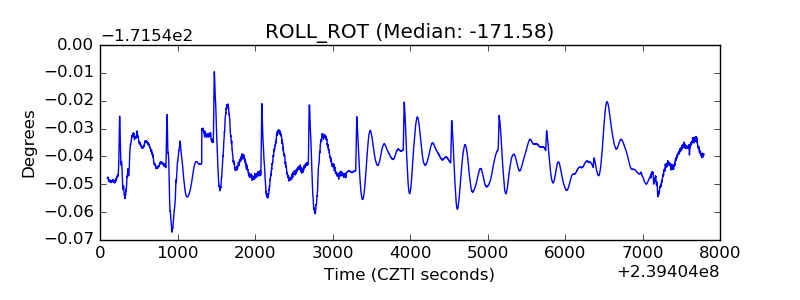 |
| _Roll_DEC |  |
| _Roll_RA | 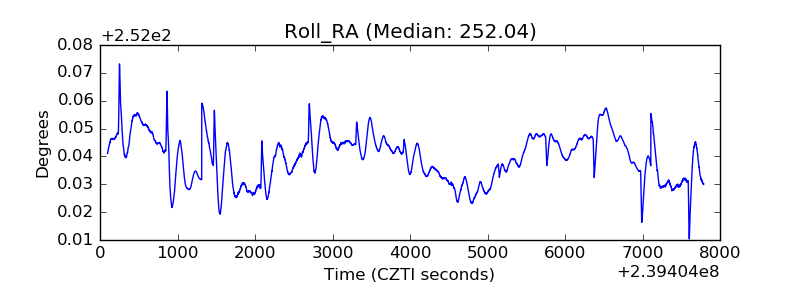 |
| Veto Counter | 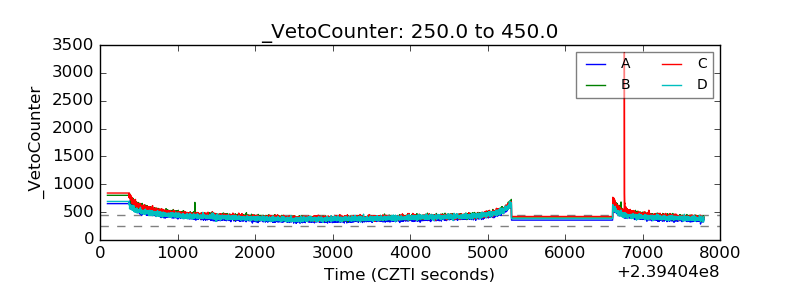 |