| Param | Original file | Final file |
|---|---|---|
| Filename | modeM0/AS1G07_074T01_9000001426_09990cztM0_level2.evt | modeM0/AS1G07_074T01_9000001426_09990cztM0_level2_quad_clean.evt |
| Size (bytes) | 555,402,240 | 88,453,440 |
| Size | 529.7 MB | 84.4 MB |
| Events in quadrant A | 3,397,541 | 554,558 |
| Events in quadrant B | 3,712,835 | 558,826 |
| Events in quadrant C | 3,274,192 | 559,600 |
| Events in quadrant D | 5,931,821 | 488,598 |
| Mode M9 | |||
|---|---|---|---|
| Quadrant | BADHDUFLAG | Total packets | Discarded packets |
| A | 0 | 18 | 0 |
| B | 0 | 18 | 0 |
| C | 0 | 18 | 0 |
| D | 0 | 18 | 0 |
| Mode M0 | |||
|---|---|---|---|
| Quadrant | BADHDUFLAG | Total packets | Discarded packets |
| A | 0 | 15387 | 3 |
| B | 0 | 16218 | 2 |
| C | 0 | 15180 | 2 |
| D | 0 | 22740 | 2 |
| Mode SS | |||
|---|---|---|---|
| Quadrant | BADHDUFLAG | Total packets | Discarded packets |
| A | 0 | 152 | 0 |
| B | 0 | 152 | 0 |
| C | 0 | 152 | 0 |
| D | 0 | 152 | 0 |
| Quadrant | Total seconds | Saturated seconds | Saturation percentage |
|---|---|---|---|
| A | 7425 | 52 | 0.700337% |
| B | 7425 | 107 | 1.441077% |
| C | 7425 | 32 | 0.430976% |
| D | 7425 | 875 | 11.784512% |
Noise dominated data is calculated using 1-second bins in cleaned event files. If a bin has >2000 counts, and if more than 50% of those come from <1% of pixels, then it is considered to be noise-dominated and hence unusable.
| Quadrant | # 1 sec bins | Bins with >0 counts | Bins with >2000 counts | High rate bins dominated by noise | Noise dominated (total time) | Noise dominated (detector-on time) | Marked lightcurve |
|---|---|---|---|---|---|---|---|
| A | 9200 | 7427 | 10 | 10 | 0.11% | 0.13% | 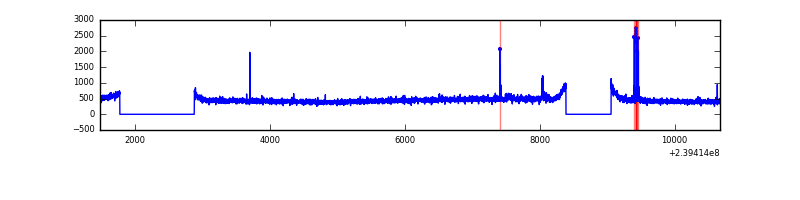 |
| B | 9200 | 7426 | 15 | 15 | 0.16% | 0.20% | 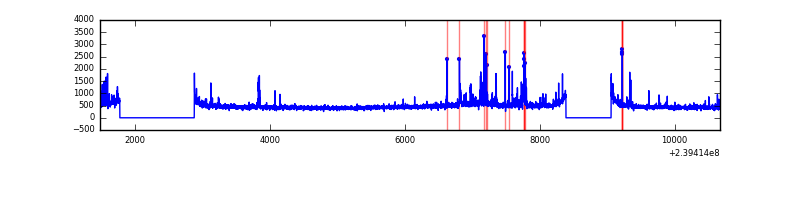 |
| C | 9200 | 7426 | 0 | 0 | 0.00% | 0.00% | 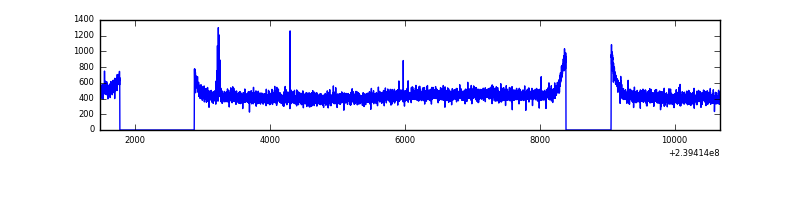 |
| D | 9200 | 7426 | 842 | 842 | 9.15% | 11.34% | 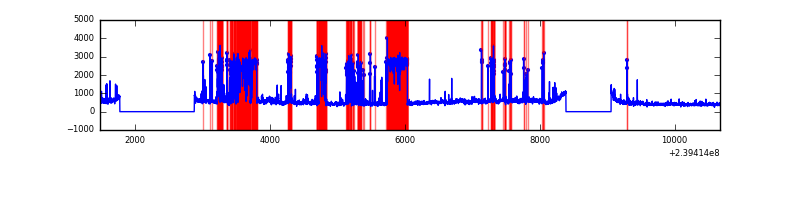 |
Top three noisy pixels from each quadrant. If the there are fewer than three noisy pixels in the level2.evt file, extra rows are filled as -1
| Pixel properties | Quadrant properties | ||||||
|---|---|---|---|---|---|---|---|
| Quadrant | DetID | PixID | Counts | Sigma | Mean | Median | Sigma |
| A | 15 | 174 | 54670 | 305.56 | 857 | 836 | 176.2 |
| A | 8 | 15 | 33330 | 184.43 | 857 | 836 | 176.2 |
| A | 4 | 2 | 12085 | 63.85 | 857 | 836 | 176.2 |
| B | 4 | 239 | 150298 | 891.69 | 865 | 842 | 167.6 |
| B | 0 | 214 | 64453 | 379.52 | 865 | 842 | 167.6 |
| B | 4 | 81 | 33071 | 192.29 | 865 | 842 | 167.6 |
| C | 5 | 32 | 15713 | 76.79 | 834 | 839 | 193.7 |
| C | 13 | 61 | 6271 | 28.05 | 834 | 839 | 193.7 |
| C | 8 | 222 | 3234 | 12.37 | 834 | 839 | 193.7 |
| D | 1 | 52 | 2432353 | 11918.02 | 767 | 751 | 204.0 |
| D | 8 | 195 | 326632 | 1597.24 | 767 | 751 | 204.0 |
| D | 2 | 16 | 78605 | 381.59 | 767 | 751 | 204.0 |
Histogram calculated using DETX and DETY for each event in the final _common_clean file
| Quadrant A | 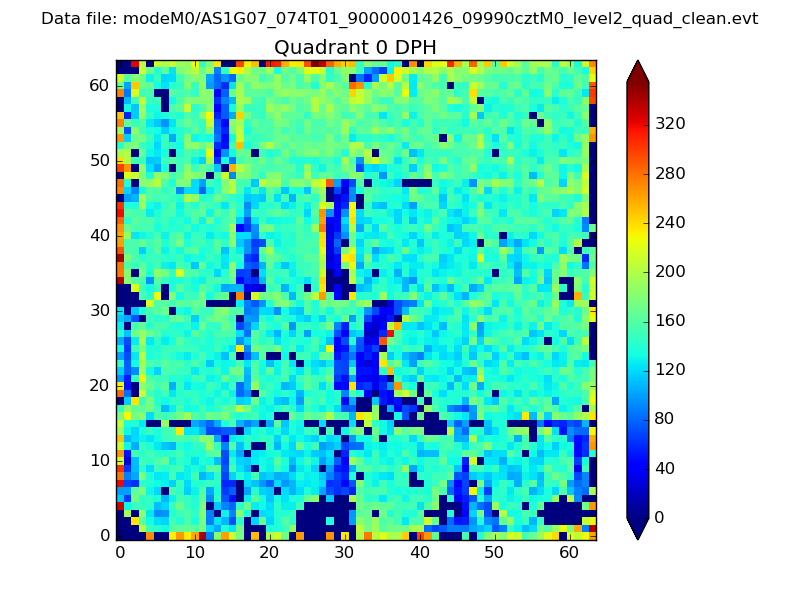 |
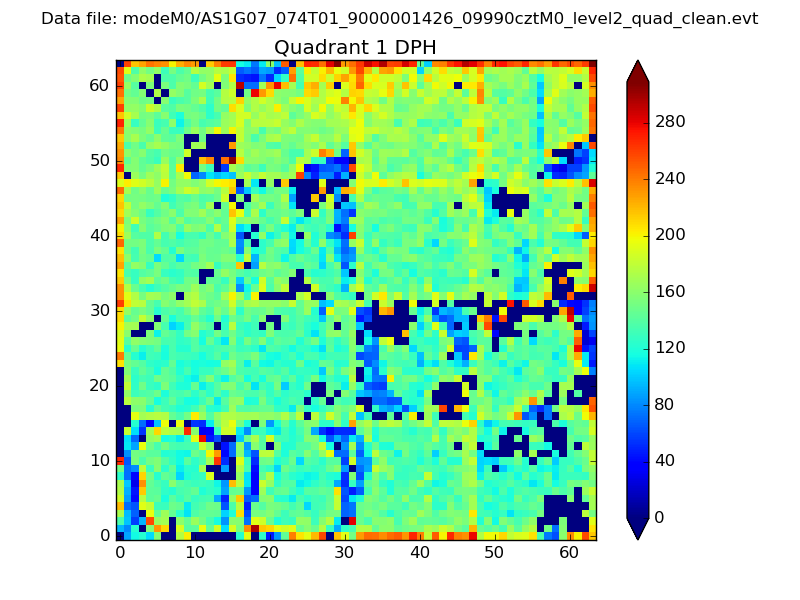 |
Quadrant B |
|---|---|---|---|
| Quadrant D | 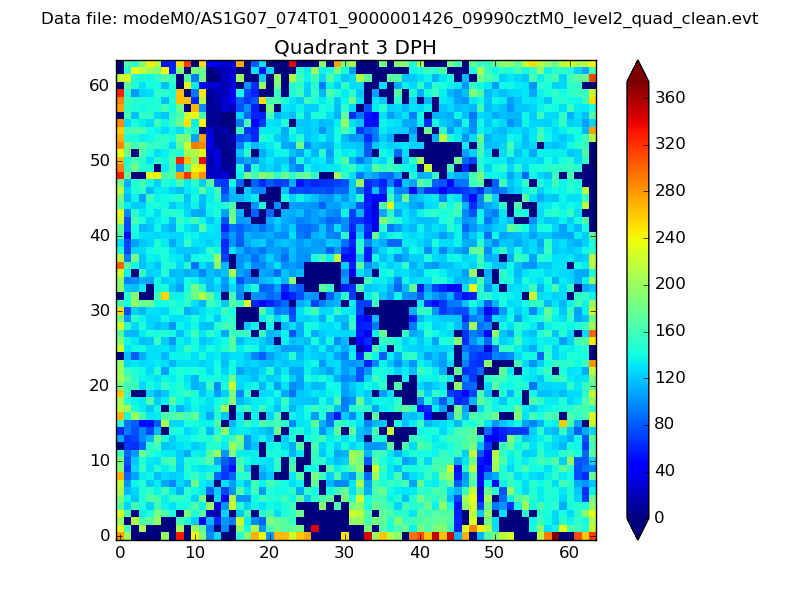 |
 |
Quadrant C |
| Plot type | Count rate plots | Images |
|---|---|---|
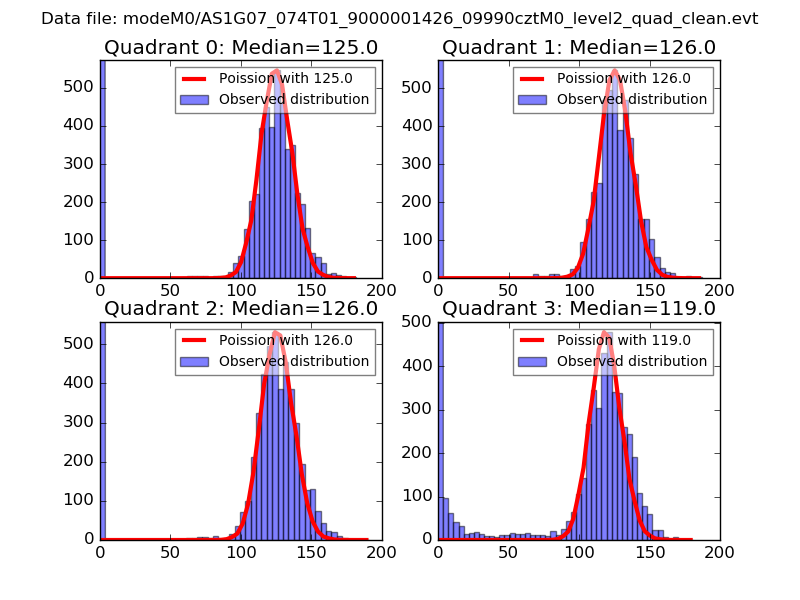
| Comparison with Poisson distribution Blue bars denote a histogram of data divided into 1 sec bins. Red curve is a Poisson curve with rate = median count rate of data. |
 |
 |
| Quadrant-wise count rates Data is divided into 100 sec bins |
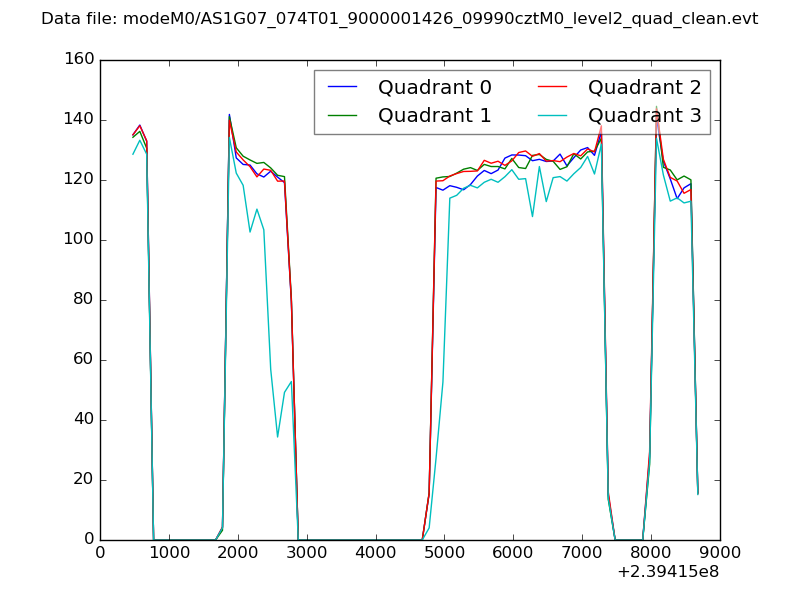 |
|
| Module-wise count rates for Quadrant A Data is divided into 100 sec bins |
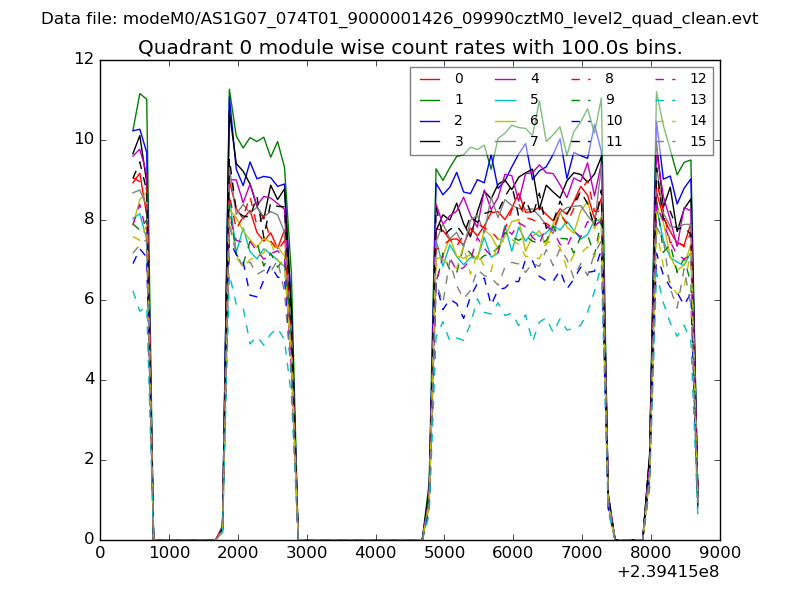 |
 |
| Module-wise count rates for Quadrant B Data is divided into 100 sec bins |
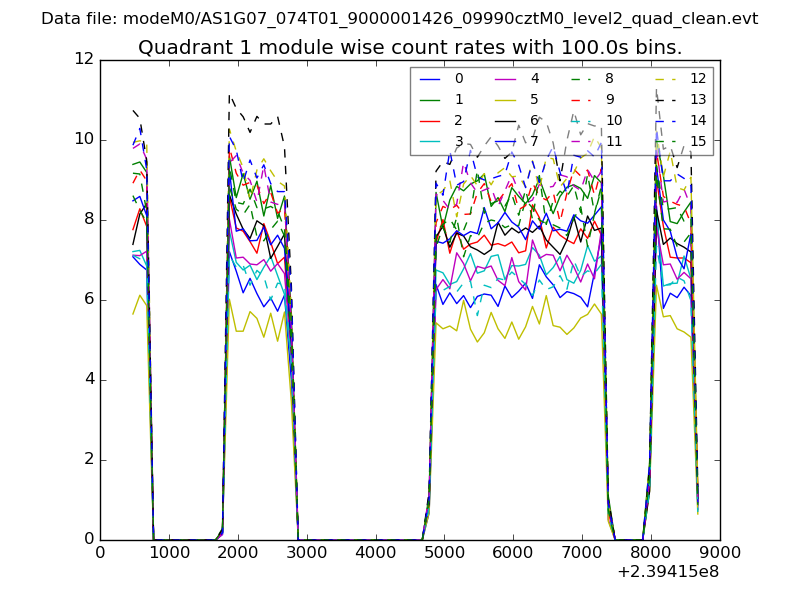 |
 |
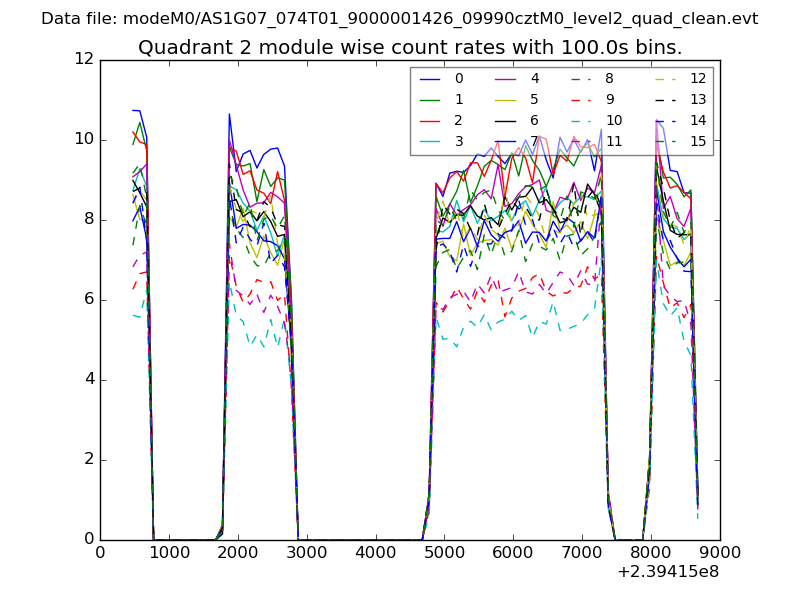
| Module-wise count rates for Quadrant C Data is divided into 100 sec bins |
 |
 |
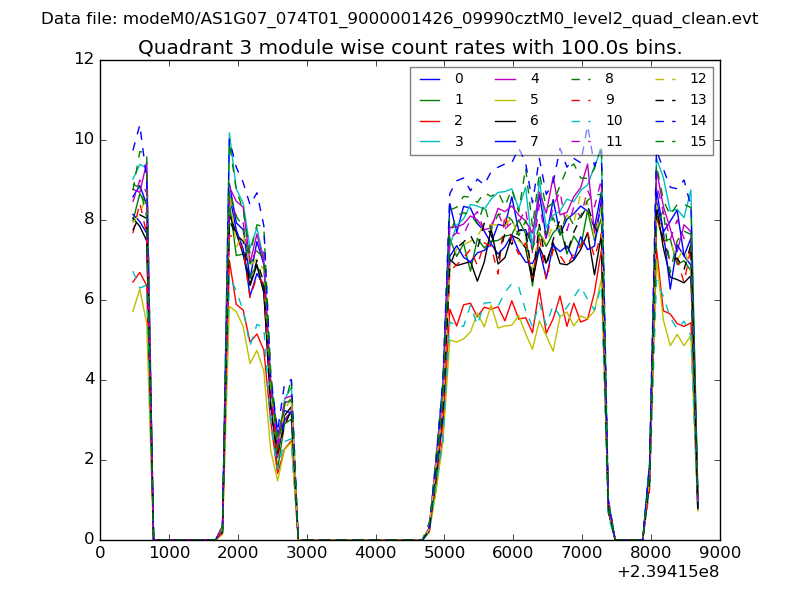
| Module-wise count rates for Quadrant D Data is divided into 100 sec bins |
 |
 |
| Parameter | Plot |
|---|---|
| CZT HV Monitor | 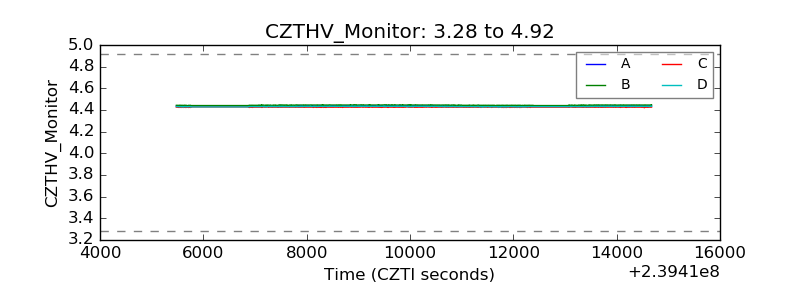 |
| D_VDD | 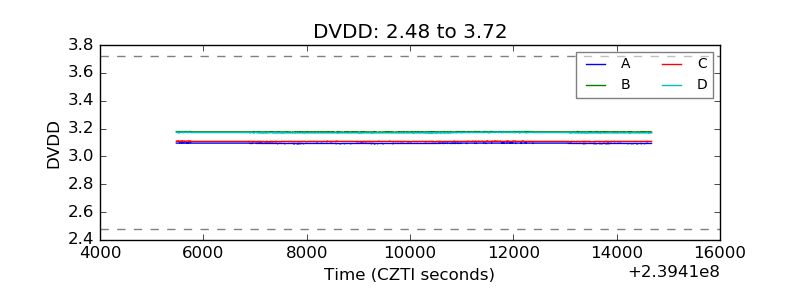 |
| Temperature 1 | 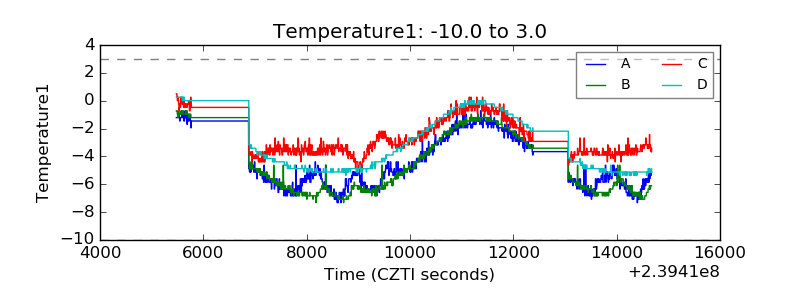 |
| Veto HV Monitor | 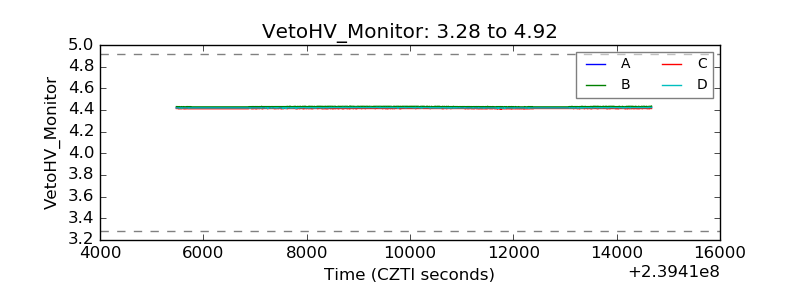 |
| Veto LLD | 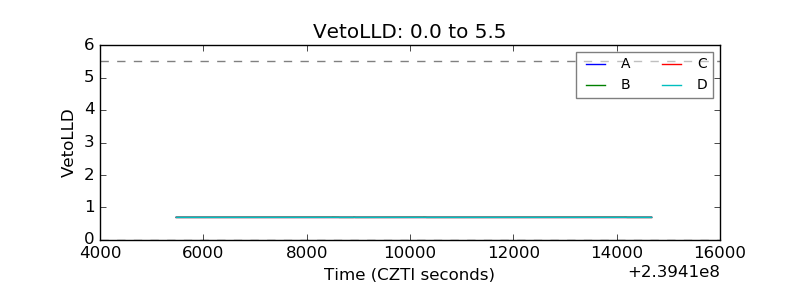 |
| Alpha Counter | 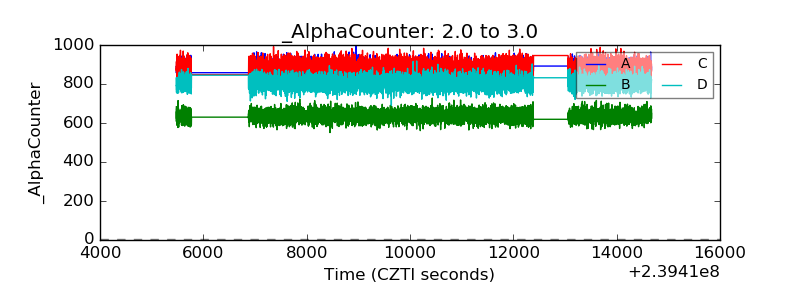 |
| _CPM_Rate | 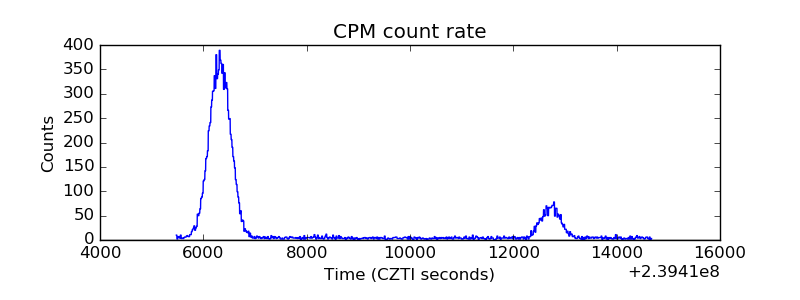 |
| CZT Counter |  |
| +2.5 Volts monitor |  |
| +5 Volts monitor |  |
| _ROLL_ROT | 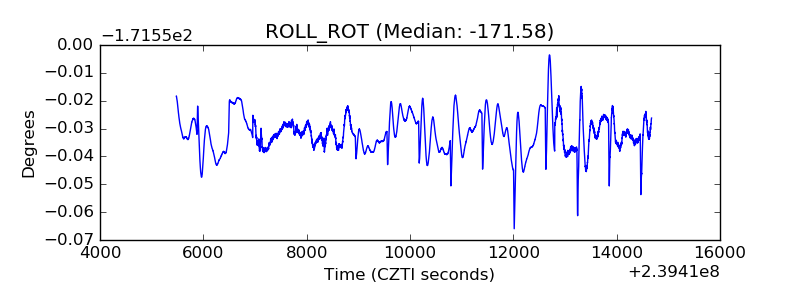 |
| _Roll_DEC | 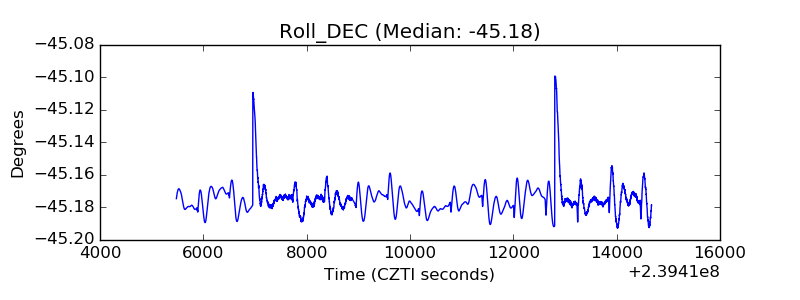 |
| _Roll_RA |  |
| Veto Counter | 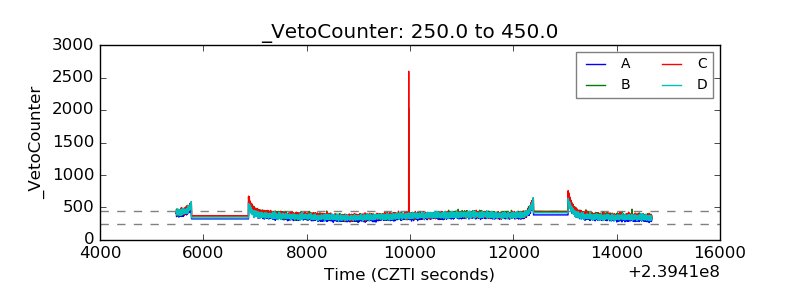 |