| Param | Original file | Final file |
|---|---|---|
| Filename | modeM0/AS1G07_074T01_9000001426_09998cztM0_level2.evt | modeM0/AS1G07_074T01_9000001426_09998cztM0_level2_quad_clean.evt |
| Size (bytes) | 563,618,880 | 80,881,920 |
| Size | 537.5 MB | 77.1 MB |
| Events in quadrant A | 3,560,377 | 484,235 |
| Events in quadrant B | 3,803,419 | 489,726 |
| Events in quadrant C | 3,423,462 | 490,397 |
| Events in quadrant D | 5,740,544 | 430,222 |
| Mode M9 | |||
|---|---|---|---|
| Quadrant | BADHDUFLAG | Total packets | Discarded packets |
| A | 0 | 7 | 0 |
| B | 0 | 7 | 0 |
| C | 0 | 7 | 0 |
| D | 0 | 7 | 0 |
| Mode M0 | |||
|---|---|---|---|
| Quadrant | BADHDUFLAG | Total packets | Discarded packets |
| A | 0 | 16395 | 13 |
| B | 0 | 17002 | 9 |
| C | 0 | 16163 | 11 |
| D | 0 | 22634 | 28 |
| Mode SS | |||
|---|---|---|---|
| Quadrant | BADHDUFLAG | Total packets | Discarded packets |
| A | 0 | 162 | 0 |
| B | 0 | 162 | 0 |
| C | 0 | 162 | 0 |
| D | 0 | 162 | 0 |
| Quadrant | Total seconds | Saturated seconds | Saturation percentage |
|---|---|---|---|
| A | 7972 | 51 | 0.639739% |
| B | 7974 | 89 | 1.116127% |
| C | 7973 | 30 | 0.376270% |
| D | 7972 | 768 | 9.633718% |
Noise dominated data is calculated using 1-second bins in cleaned event files. If a bin has >2000 counts, and if more than 50% of those come from <1% of pixels, then it is considered to be noise-dominated and hence unusable.
| Quadrant | # 1 sec bins | Bins with >0 counts | Bins with >2000 counts | High rate bins dominated by noise | Noise dominated (total time) | Noise dominated (detector-on time) | Marked lightcurve |
|---|---|---|---|---|---|---|---|
| A | 8648 | 7979 | 13 | 13 | 0.15% | 0.16% | 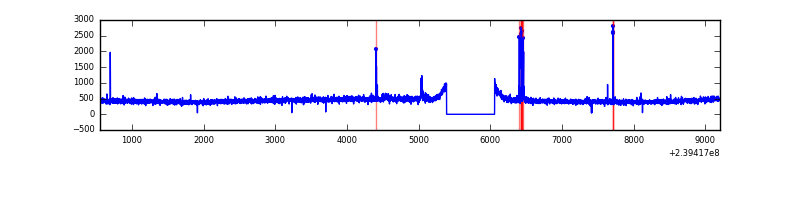 |
| B | 8648 | 7978 | 15 | 15 | 0.17% | 0.19% | 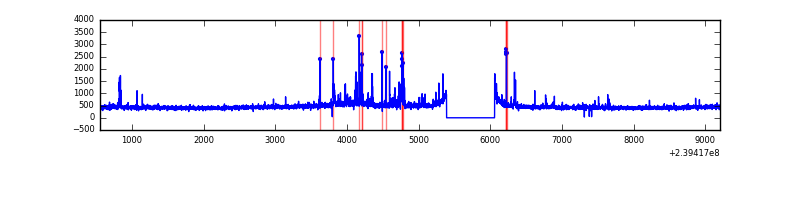 |
| C | 8648 | 7978 | 0 | 0 | 0.00% | 0.00% | 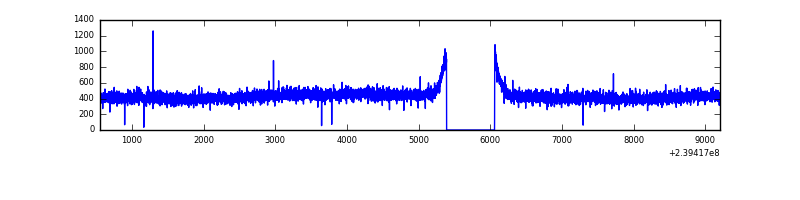 |
| D | 8648 | 7976 | 734 | 734 | 8.49% | 9.20% | 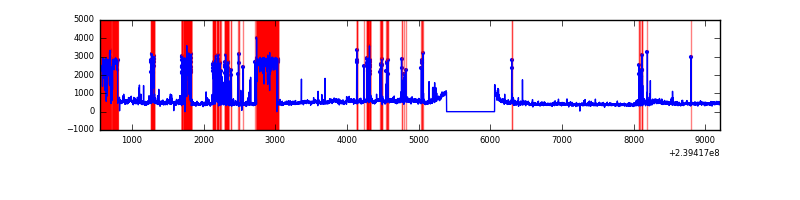 |
Top three noisy pixels from each quadrant. If the there are fewer than three noisy pixels in the level2.evt file, extra rows are filled as -1
| Pixel properties | Quadrant properties | ||||||
|---|---|---|---|---|---|---|---|
| Quadrant | DetID | PixID | Counts | Sigma | Mean | Median | Sigma |
| A | 15 | 174 | 54441 | 293.6 | 895 | 876 | 182.4 |
| A | 8 | 15 | 40017 | 214.54 | 895 | 876 | 182.4 |
| A | 4 | 2 | 12103 | 61.54 | 895 | 876 | 182.4 |
| B | 4 | 239 | 124276 | 708.91 | 905 | 881 | 174.1 |
| B | 0 | 214 | 61082 | 345.86 | 905 | 881 | 174.1 |
| B | 4 | 81 | 24369 | 134.94 | 905 | 881 | 174.1 |
| C | 13 | 61 | 6536 | 27.75 | 876 | 881 | 203.7 |
| C | 5 | 32 | 3583 | 13.26 | 876 | 881 | 203.7 |
| C | 8 | 222 | 3576 | 13.23 | 876 | 881 | 203.7 |
| D | 1 | 52 | 2077753 | 9802.82 | 815 | 794 | 211.9 |
| D | 8 | 195 | 338062 | 1591.84 | 815 | 794 | 211.9 |
| D | 2 | 16 | 98402 | 460.69 | 815 | 794 | 211.9 |
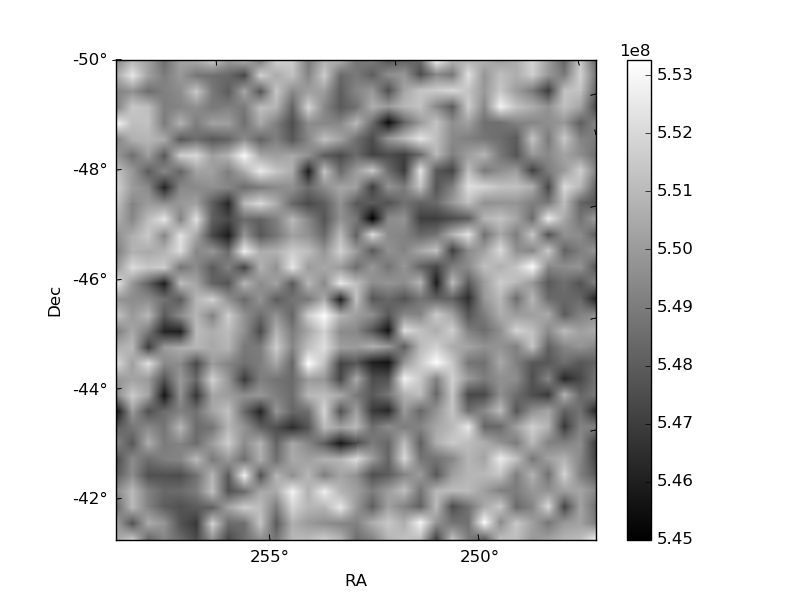
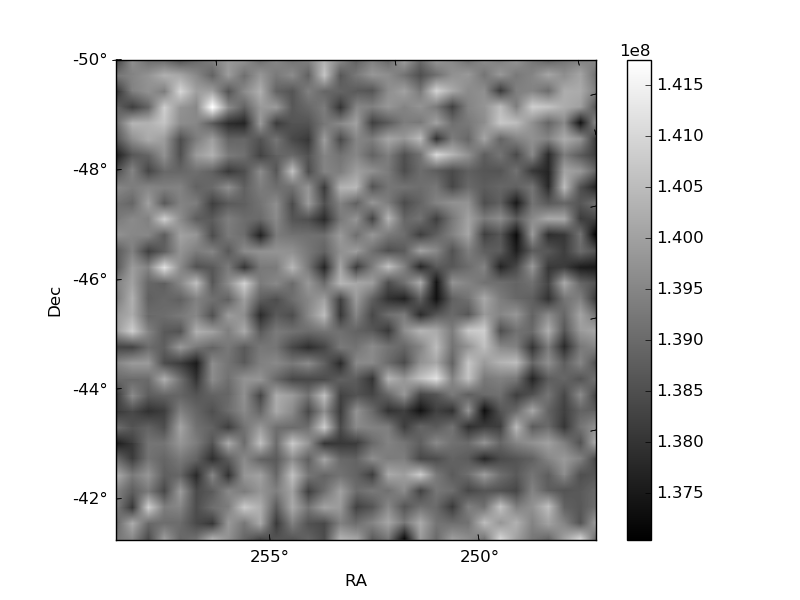
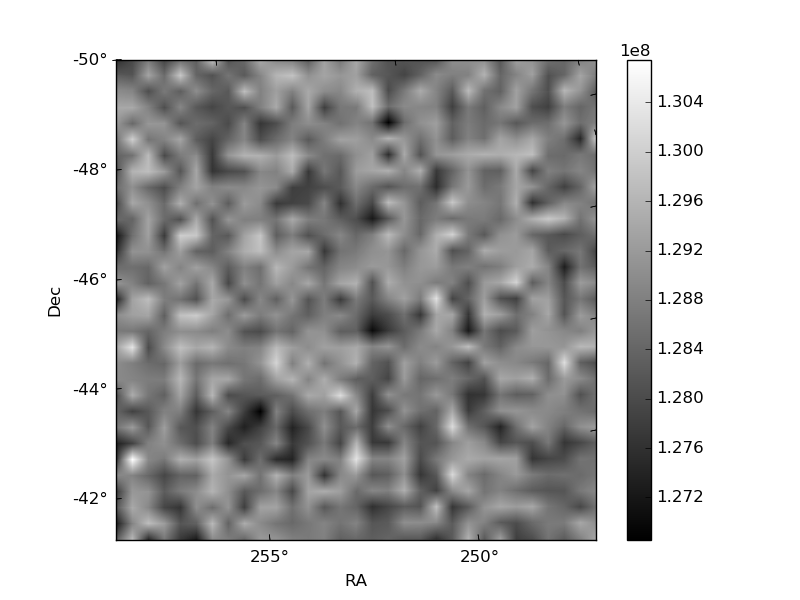
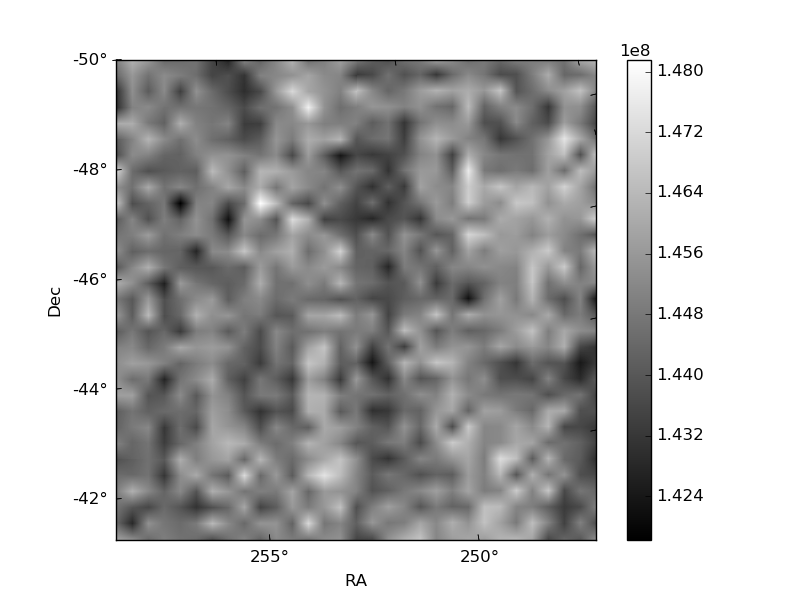
Histogram calculated using DETX and DETY for each event in the final _common_clean file
| Quadrant A | 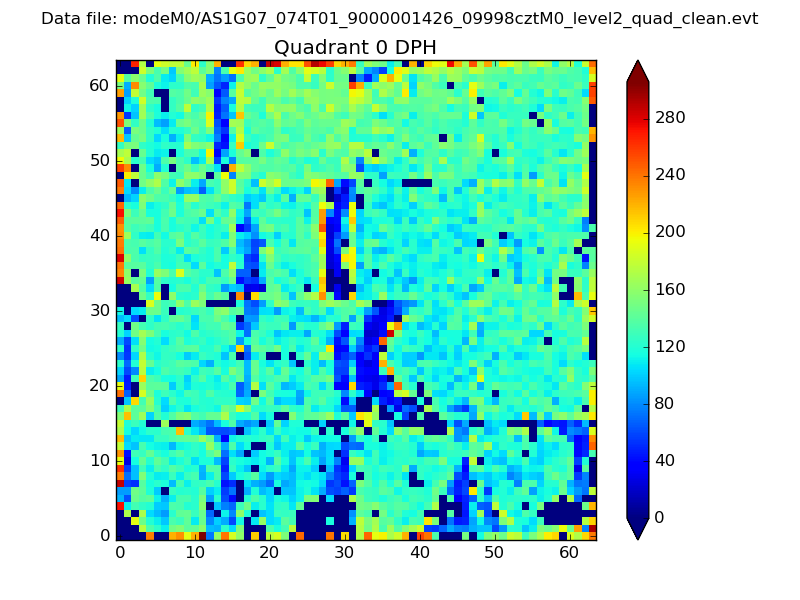 |
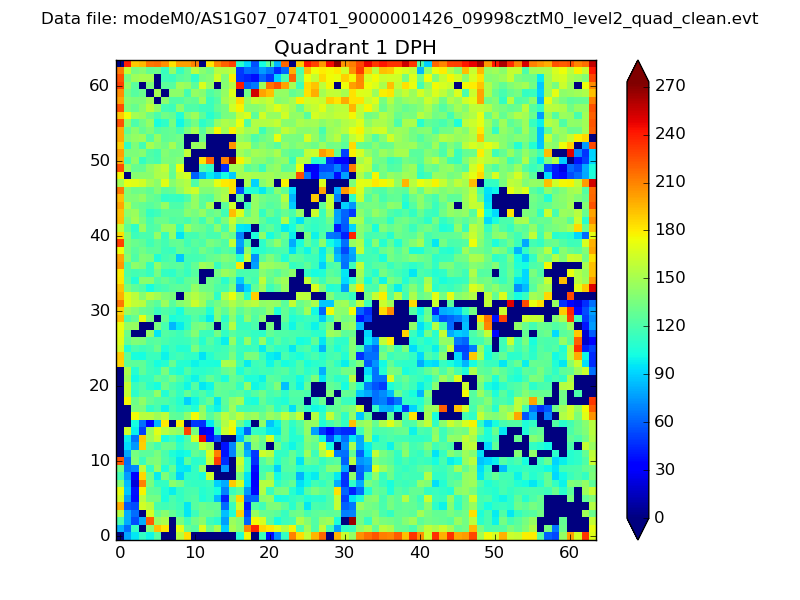 |
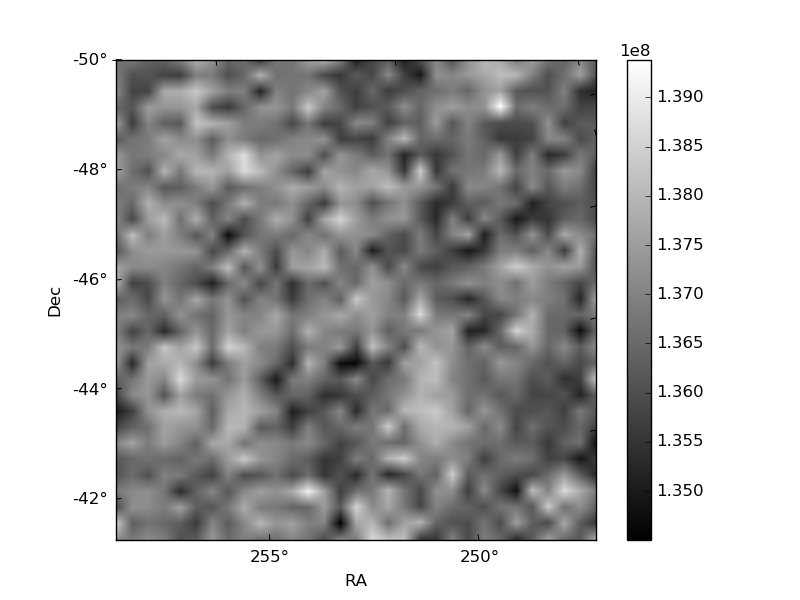
Quadrant B |
|---|---|---|---|
| Quadrant D | 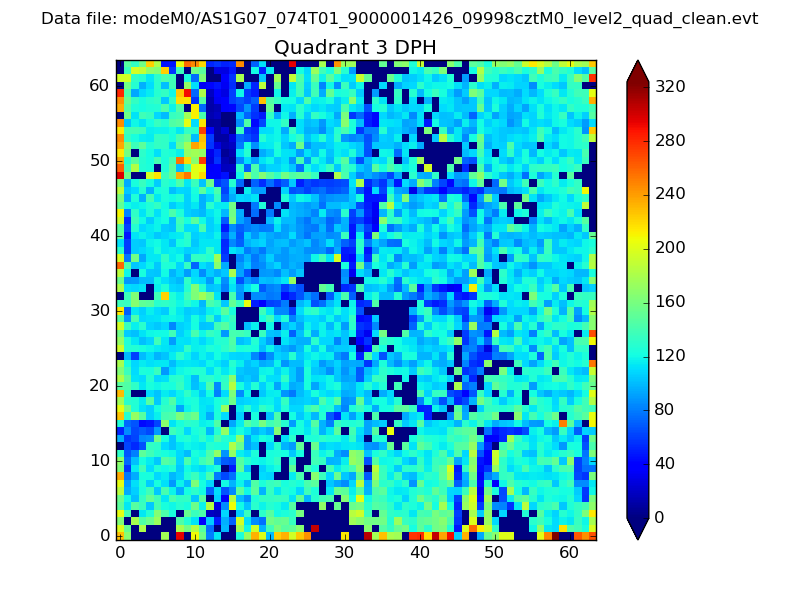 |
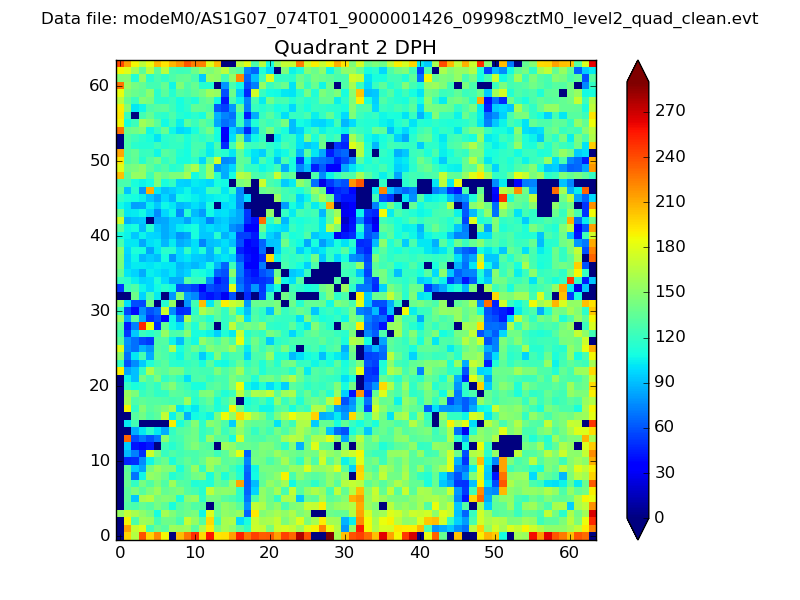 |
Quadrant C |
| Plot type | Count rate plots | Images |
|---|---|---|
| Comparison with Poisson distribution Blue bars denote a histogram of data divided into 1 sec bins. Red curve is a Poisson curve with rate = median count rate of data. |
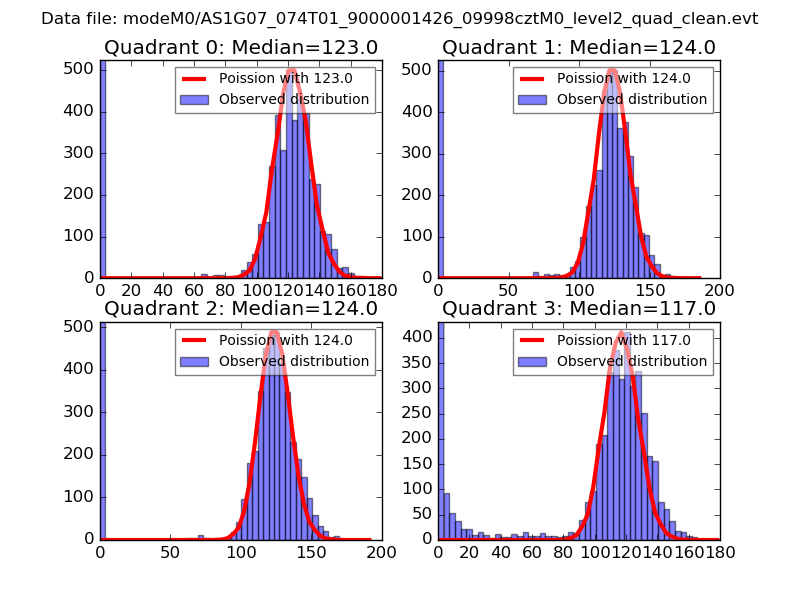 |
 |
| Quadrant-wise count rates Data is divided into 100 sec bins |
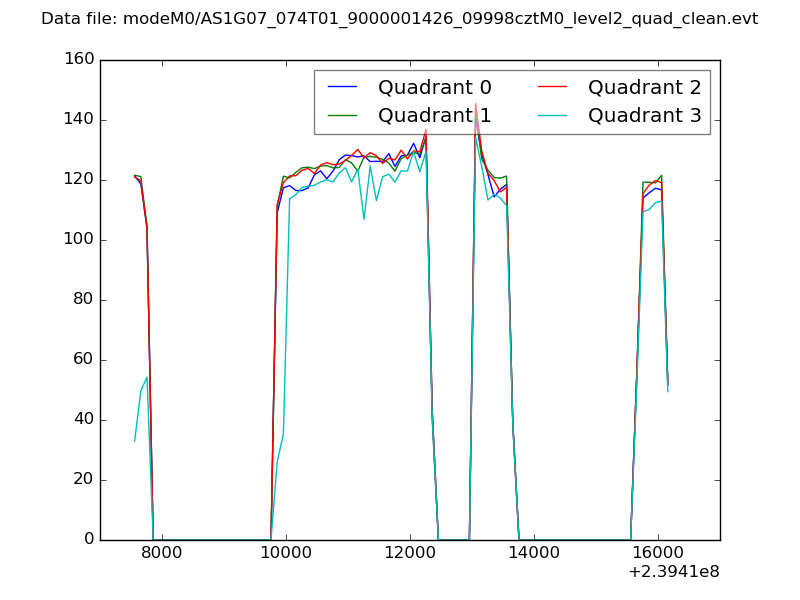 |
|
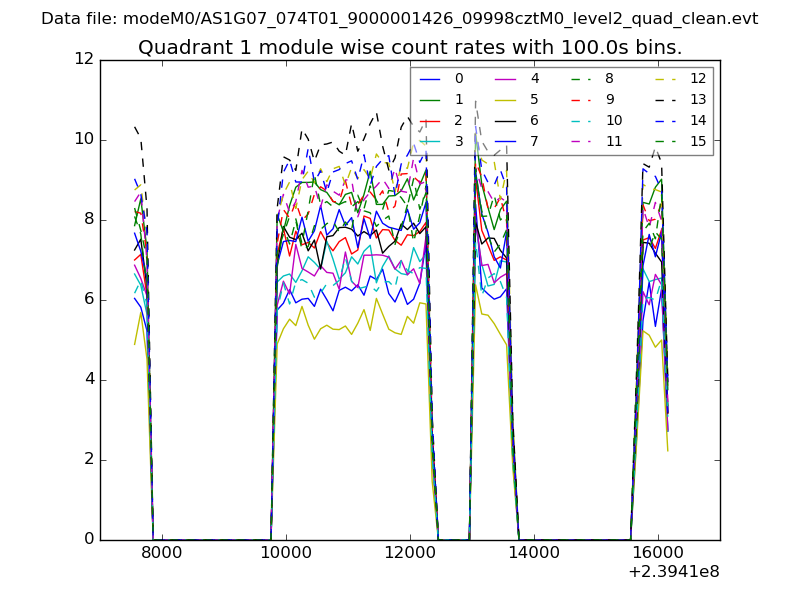
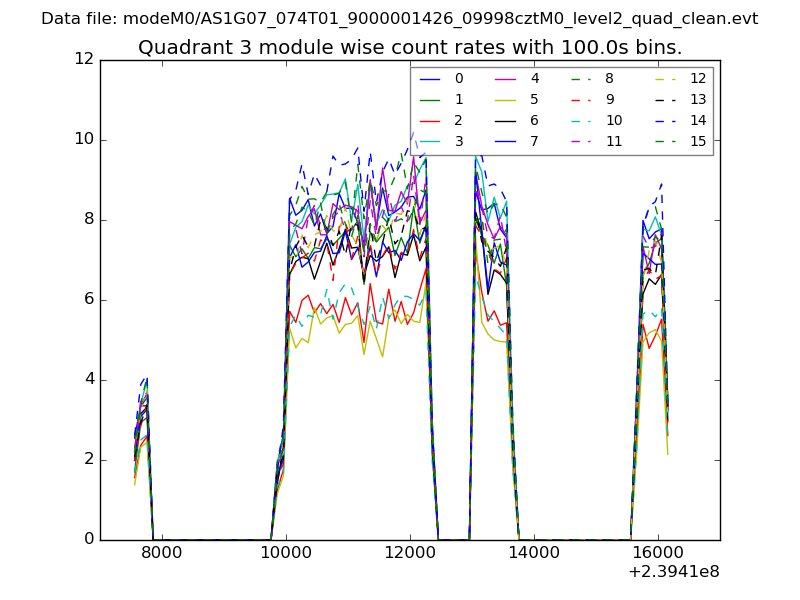
| Module-wise count rates for Quadrant A Data is divided into 100 sec bins |
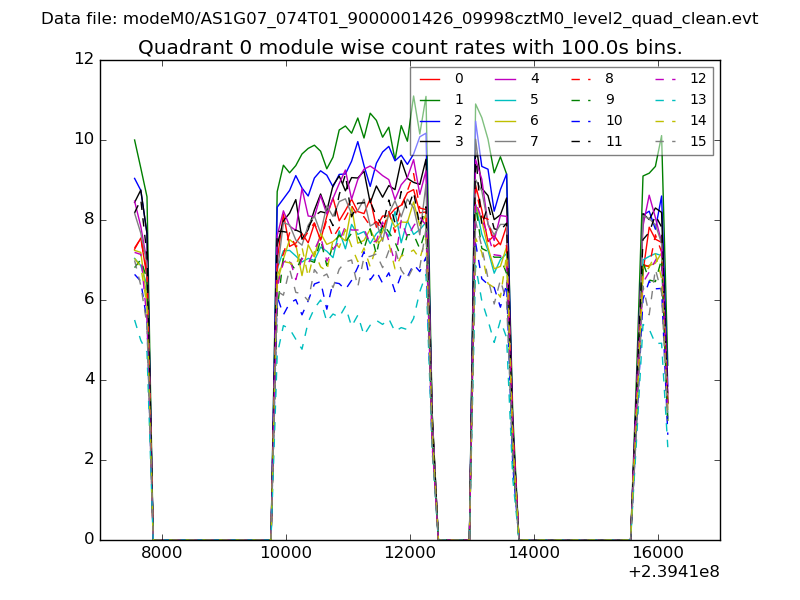 |
 |
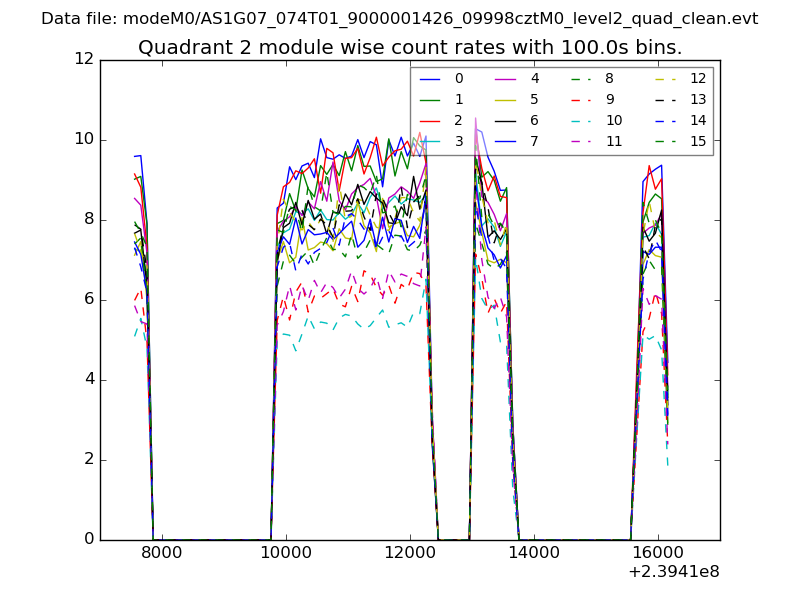
| Module-wise count rates for Quadrant B Data is divided into 100 sec bins |
 |
 |
| Module-wise count rates for Quadrant C Data is divided into 100 sec bins |
 |
 |
| Module-wise count rates for Quadrant D Data is divided into 100 sec bins |
 |
 |
| Parameter | Plot |
|---|---|
| CZT HV Monitor | 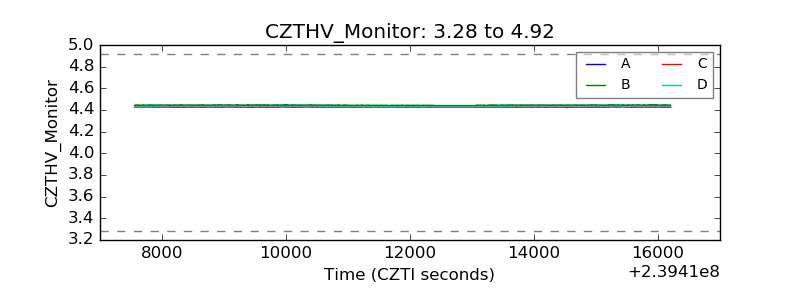 |
| D_VDD |  |
| Temperature 1 | 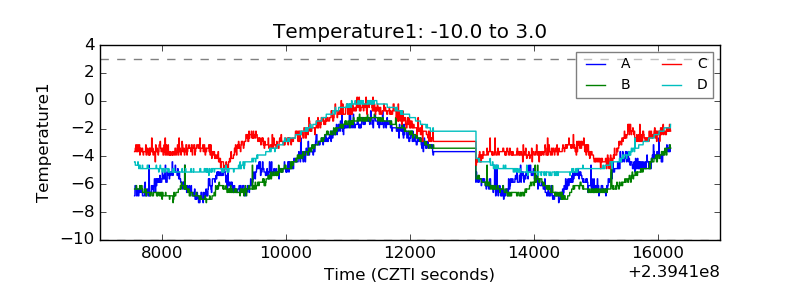 |
| Veto HV Monitor | 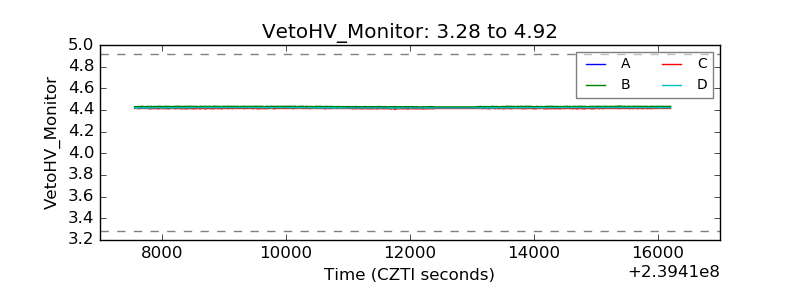 |
| Veto LLD | 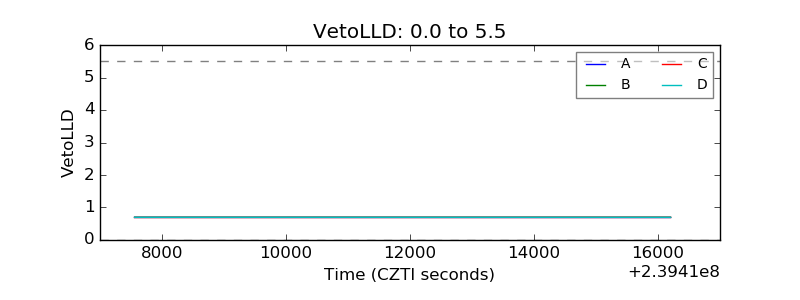 |
| Alpha Counter | 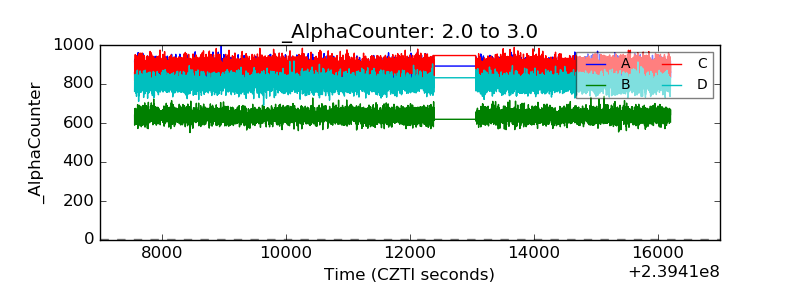 |
| _CPM_Rate | 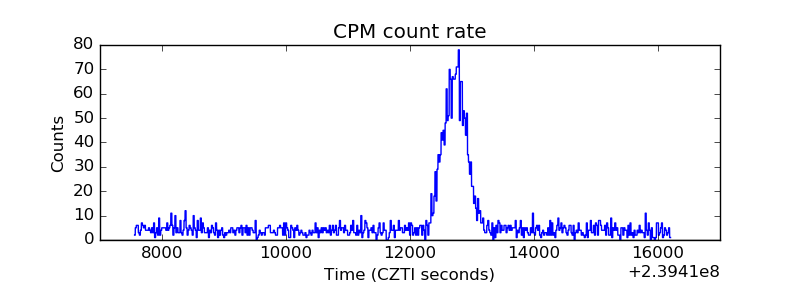 |
| CZT Counter | 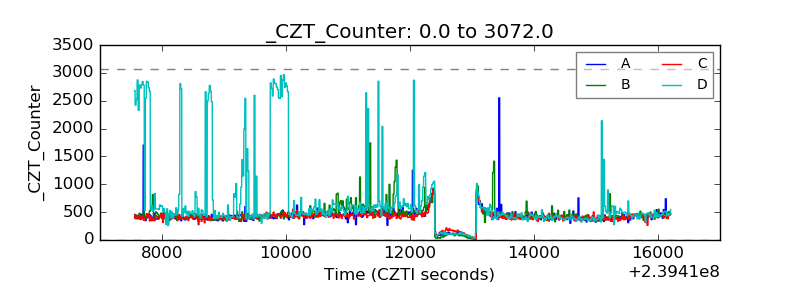 |
| +2.5 Volts monitor | 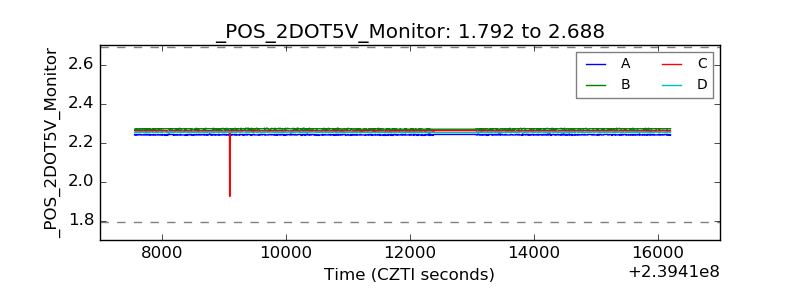 |
| +5 Volts monitor |  |
| _ROLL_ROT | 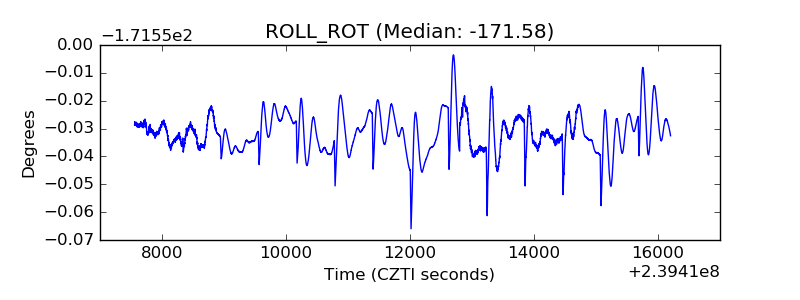 |
| _Roll_DEC | 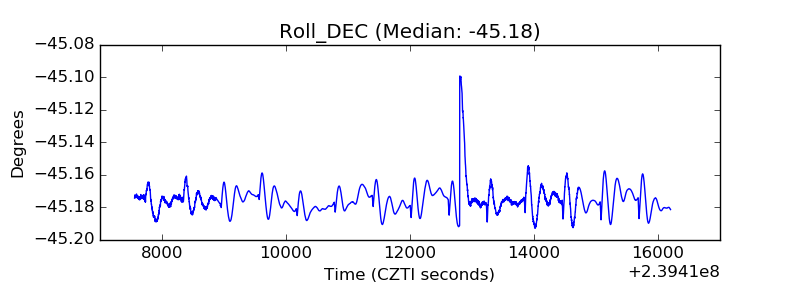 |
| _Roll_RA | 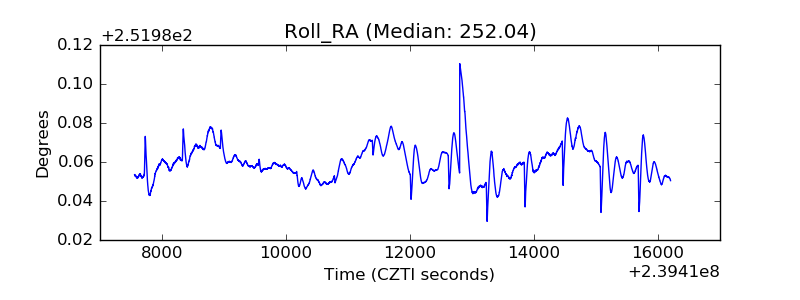 |
| Veto Counter | 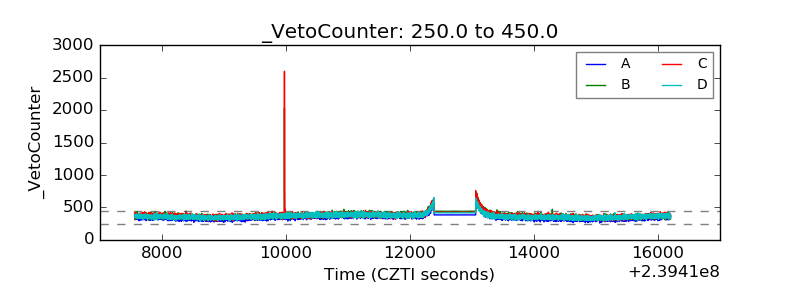 |