| Param | Original file | Final file |
|---|---|---|
| Filename | modeM0/AS1C02_028T02_9000001428cztM0_level2.fits | modeM0/AS1C02_028T02_9000001428cztM0_level2_quad_clean.evt |
| Size (bytes) | 160,594,560 | 158,408,640 |
| Size | 153.2 MB | 151.1 MB |
| Events in quadrant A | 949,678 | 930,779 |
| Events in quadrant B | 917,102 | 928,982 |
| Events in quadrant C | 944,080 | 882,838 |
| Events in quadrant D | 816,446 | 818,668 |
| Mode SS | |||
|---|---|---|---|
| Quadrant | BADHDUFLAG | Total packets | Discarded packets |
| A | 0 | 366 | 0 |
| B | 0 | 366 | 0 |
| C | 0 | 366 | 0 |
| D | 0 | 366 | 0 |
| Mode M0 | |||
|---|---|---|---|
| Quadrant | BADHDUFLAG | Total packets | Discarded packets |
| A | 0 | 37589 | 0 |
| B | 0 | 38840 | 0 |
| C | 0 | 36805 | 0 |
| D | 0 | 42393 | 0 |
| Mode M9 | |||
|---|---|---|---|
| Quadrant | BADHDUFLAG | Total packets | Discarded packets |
| A | 0 | 6 | 0 |
| B | 0 | 6 | 0 |
| C | 0 | 6 | 0 |
| D | 0 | 6 | 0 |
| Quadrant | Total seconds | Saturated seconds | Saturation percentage |
|---|---|---|---|
| A | 17923 | 616 | 3.436925% |
| B | 17921 | 606 | 3.381508% |
| C | 17921 | 428 | 2.388260% |
| D | 17922 | 695 | 3.877915% |
Noise dominated data is calculated using 1-second bins in cleaned event files. If a bin has >2000 counts, and if more than 50% of those come from <1% of pixels, then it is considered to be noise-dominated and hence unusable.
| Quadrant | # 1 sec bins | Bins with >0 counts | Bins with >2000 counts | High rate bins dominated by noise | Noise dominated (total time) | Noise dominated (detector-on time) | Marked lightcurve |
|---|---|---|---|---|---|---|---|
| A | 18556 | 17919 | 0 | 0 | 0.00% | 0.00% |  |
| B | 18556 | 17917 | 0 | 0 | 0.00% | 0.00% | 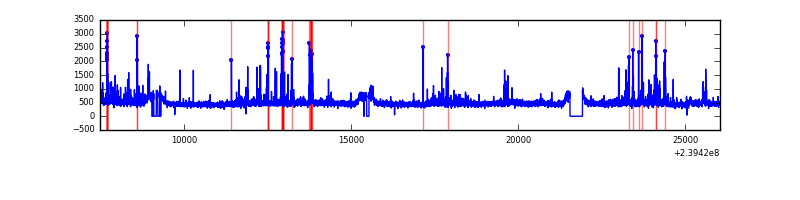 |
| C | 18556 | 17920 | 0 | 0 | 0.00% | 0.00% |  |
| D | 18556 | 17918 | 0 | 0 | 0.00% | 0.00% | 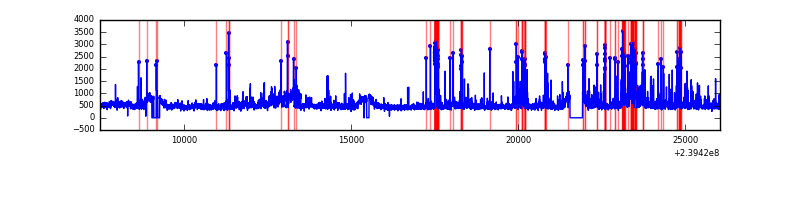 |
Top three noisy pixels from each quadrant. If the there are fewer than three noisy pixels in the level2.evt file, extra rows are filled as -1
| Pixel properties | Quadrant properties | ||||||
|---|---|---|---|---|---|---|---|
| Quadrant | DetID | PixID | Counts | Sigma | Mean | Median | Sigma |
| A | 0 | 29 | 875 | 9.9 | 246 | 231 | 65.0 |
| A | 7 | 110 | 778 | 8.41 | 246 | 231 | 65.0 |
| A | 0 | 30 | 714 | 7.43 | 246 | 231 | 65.0 |
| B | 2 | 9 | 796 | 11.08 | 242 | 229 | 51.2 |
| B | 14 | 254 | 613 | 7.5 | 242 | 229 | 51.2 |
| B | 3 | 17 | 604 | 7.33 | 242 | 229 | 51.2 |
| C | 12 | 241 | 693 | 6.98 | 249 | 230 | 66.4 |
| C | 3 | 158 | 639 | 6.16 | 249 | 230 | 66.4 |
| C | 2 | 191 | 624 | 5.94 | 249 | 230 | 66.4 |
| D | 3 | 14 | 616 | 6.26 | 232 | 210 | 64.8 |
| D | 7 | 5 | 582 | 5.74 | 232 | 210 | 64.8 |
| D | 15 | 47 | 568 | 5.52 | 232 | 210 | 64.8 |
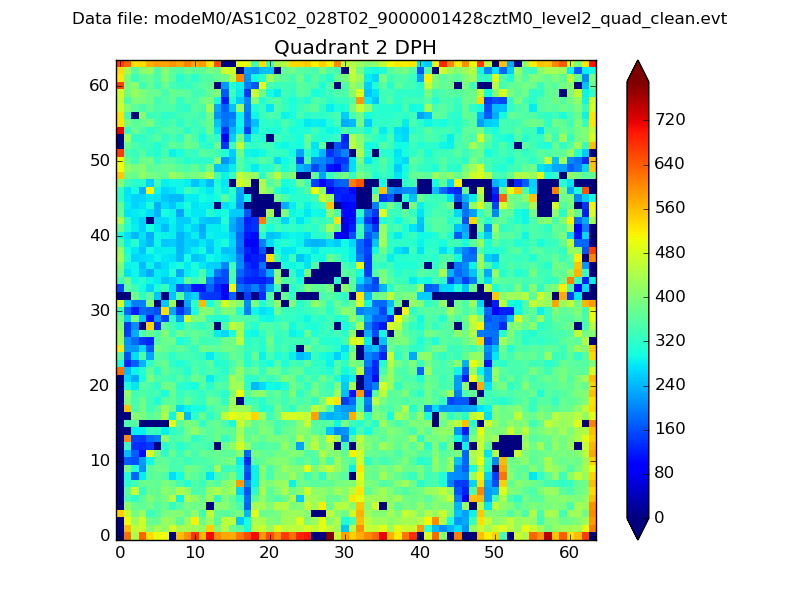
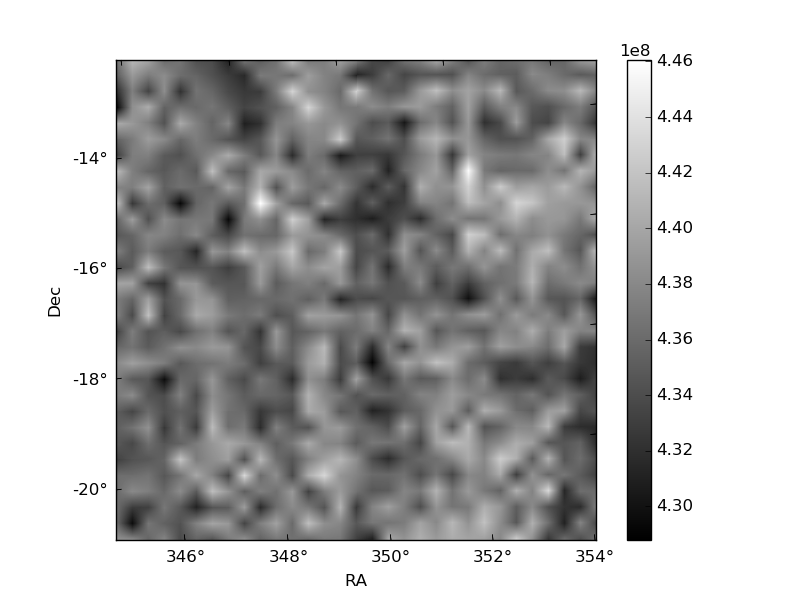
Histogram calculated using DETX and DETY for each event in the final _common_clean file
| Quadrant A | 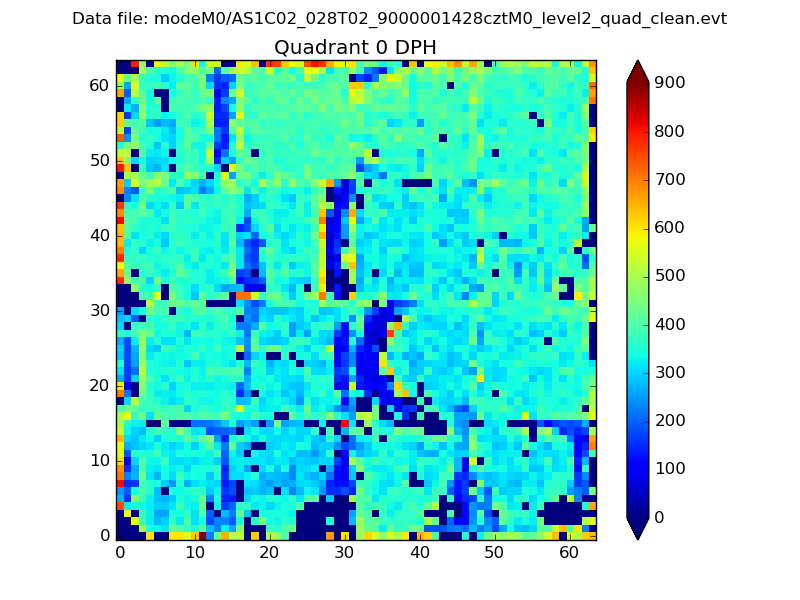 |
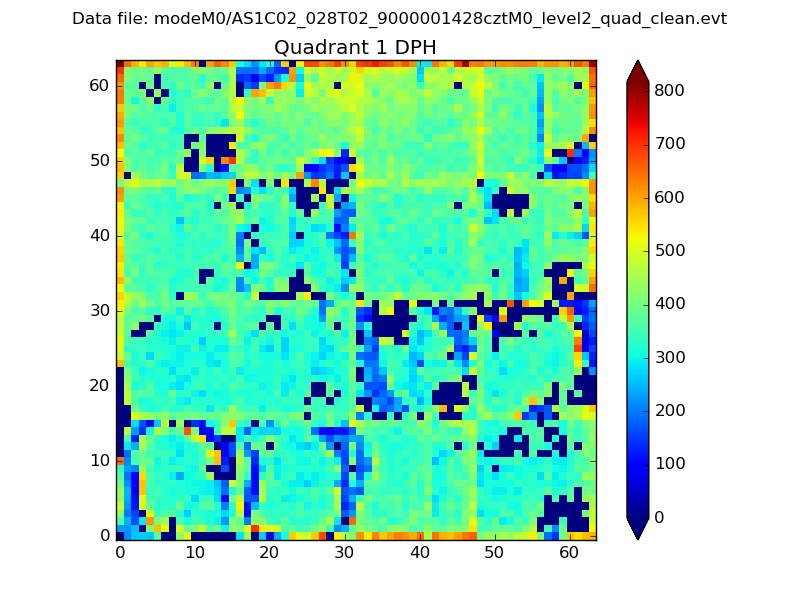 |
Quadrant B |
|---|---|---|---|
| Quadrant D | 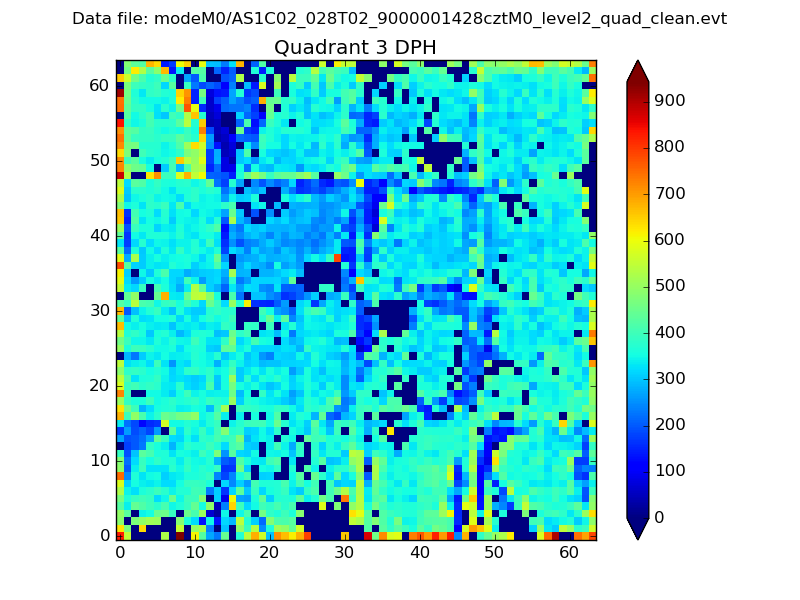 |
 |
Quadrant C |
| Plot type | Count rate plots | Images |
|---|---|---|
| Comparison with Poisson distribution Blue bars denote a histogram of data divided into 1 sec bins. Red curve is a Poisson curve with rate = median count rate of data. |
 |
 |
| Quadrant-wise count rates Data is divided into 100 sec bins |
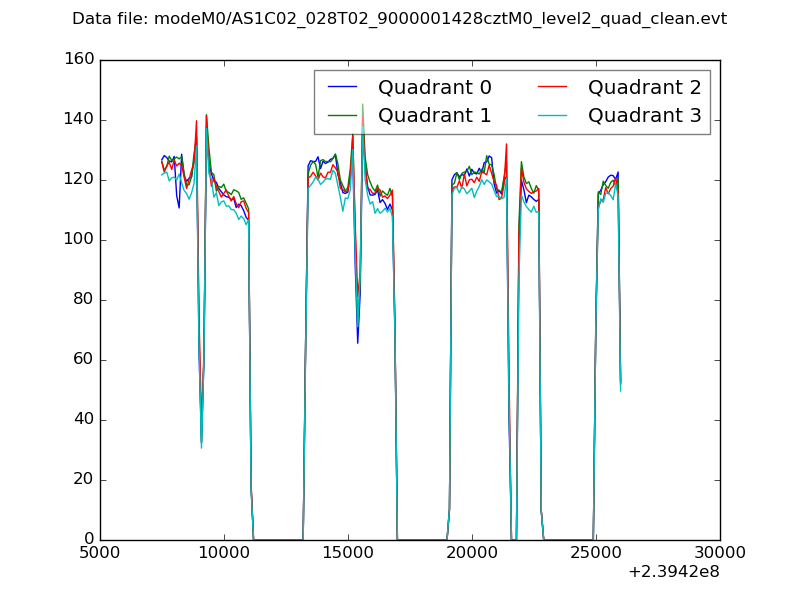 |
|
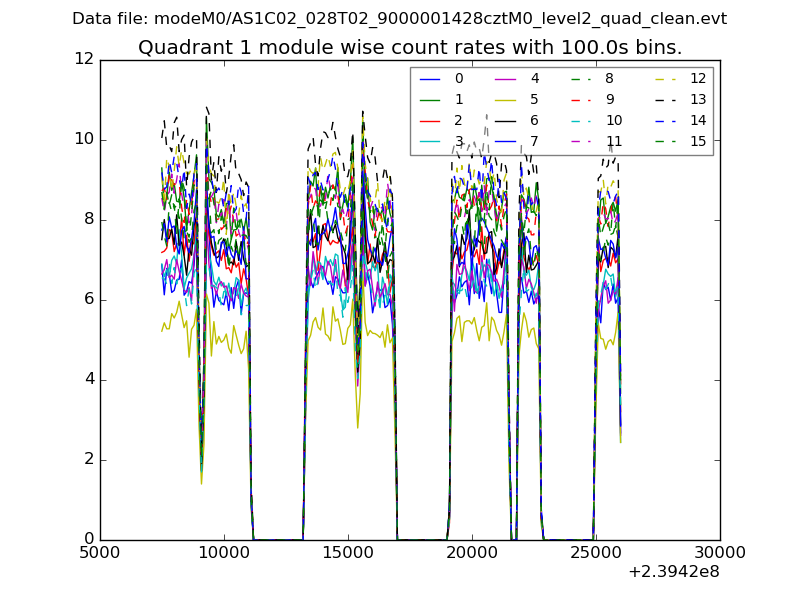
| Module-wise count rates for Quadrant A Data is divided into 100 sec bins |
 |
 |
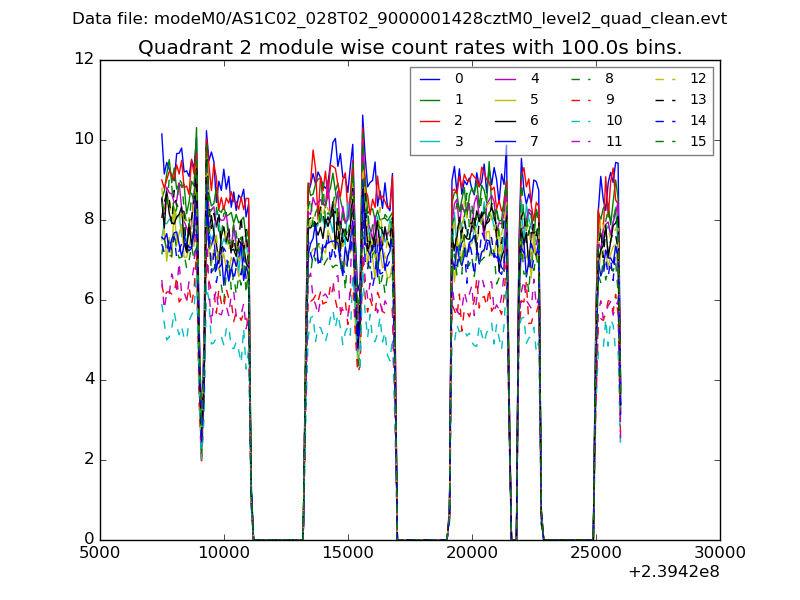
| Module-wise count rates for Quadrant B Data is divided into 100 sec bins |
 |
 |
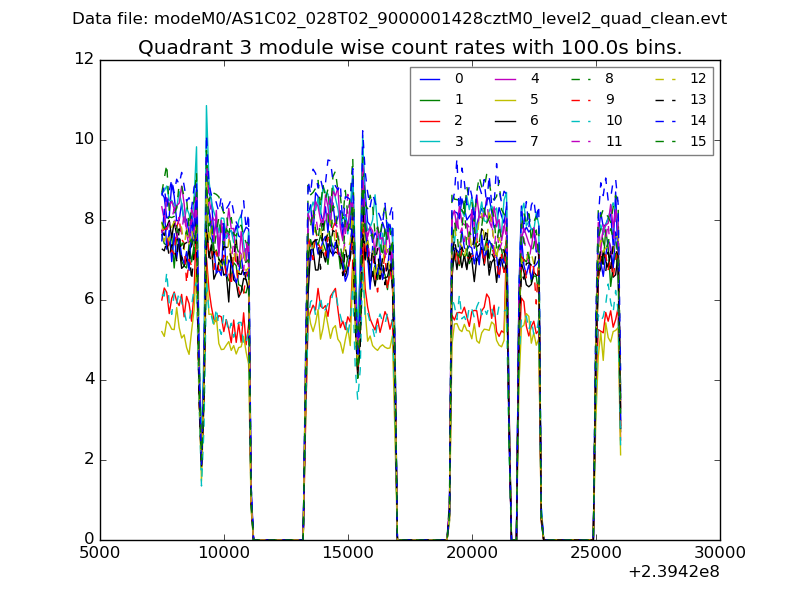
| Module-wise count rates for Quadrant C Data is divided into 100 sec bins |
 |
 |
| Module-wise count rates for Quadrant D Data is divided into 100 sec bins |
 |
 |
| Parameter | Plot |
|---|---|
| CZT HV Monitor | 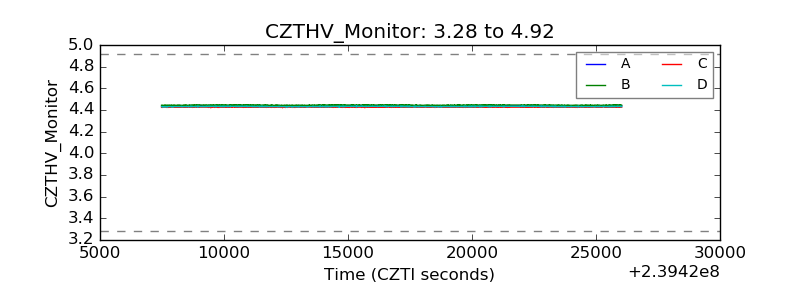 |
| D_VDD | 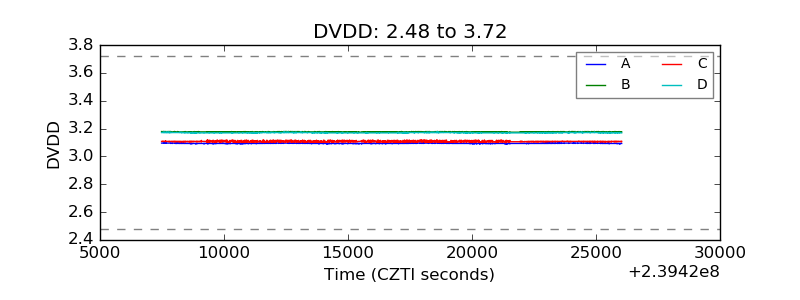 |
| Temperature 1 | 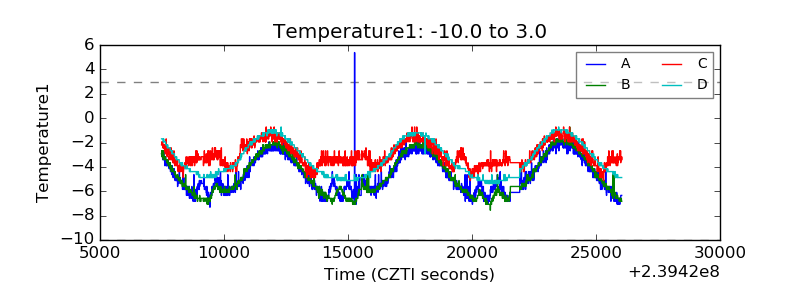 |
| Veto HV Monitor |  |
| Veto LLD | 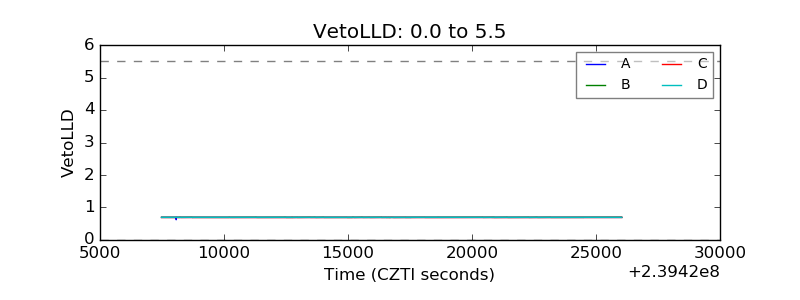 |
| Alpha Counter | 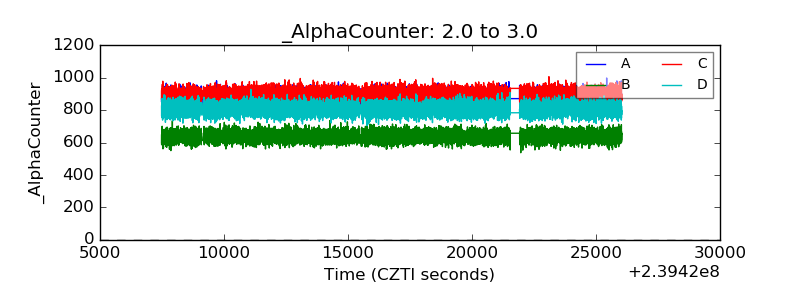 |
| _CPM_Rate | 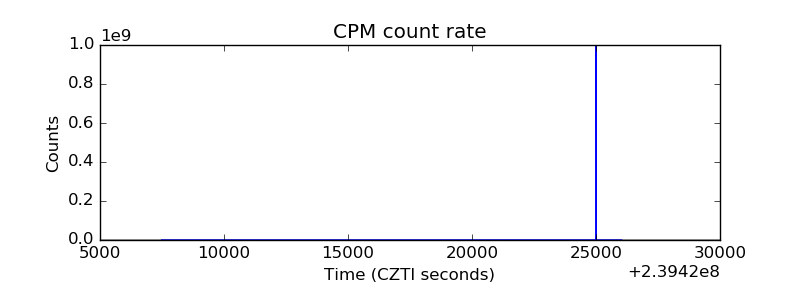 |
| CZT Counter | 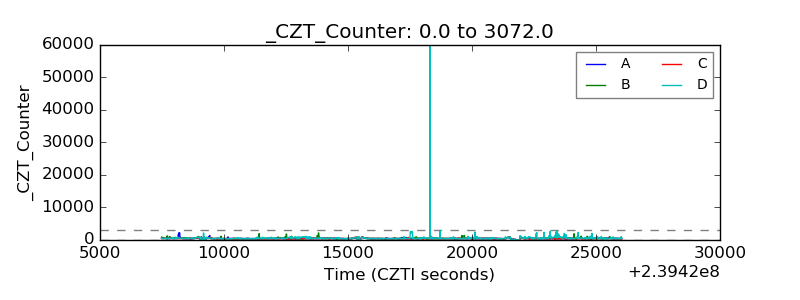 |
| +2.5 Volts monitor | 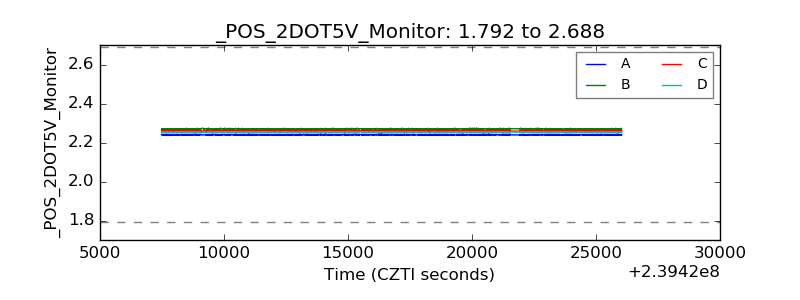 |
| +5 Volts monitor | 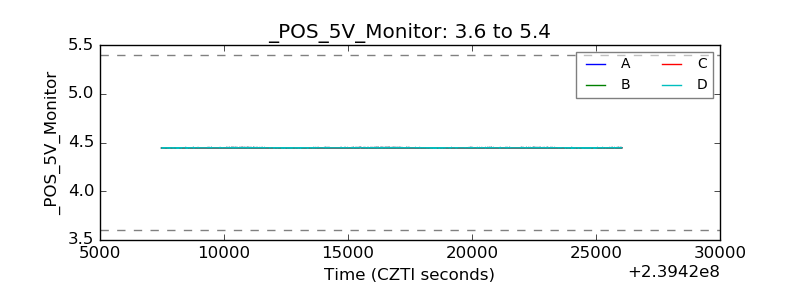 |
| _ROLL_ROT | 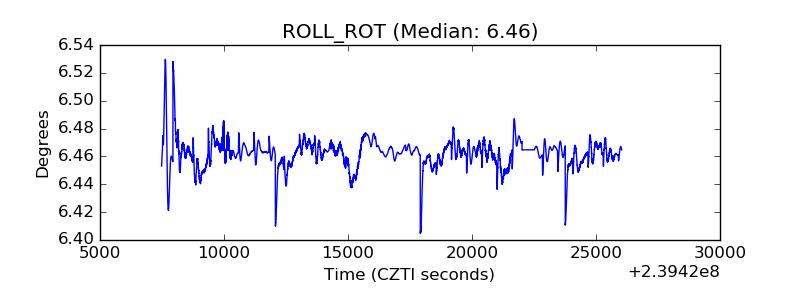 |
| _Roll_DEC | 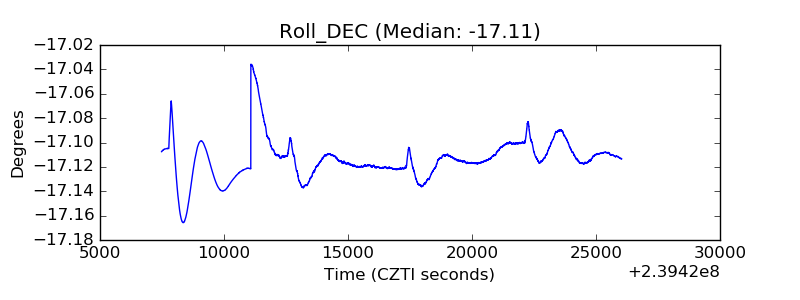 |
| _Roll_RA | 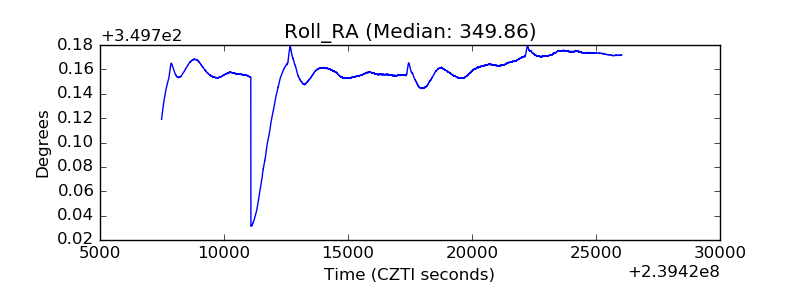 |
| Veto Counter | 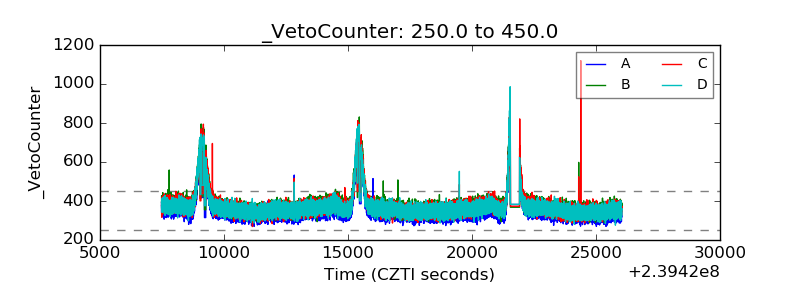 |