| Param | Original file | Final file |
|---|---|---|
| Filename | modeM0/AS1G07_002T02_9000001432cztM0_level2.fits | modeM0/AS1G07_002T02_9000001432cztM0_level2_quad_clean.evt |
| Size (bytes) | 460,327,680 | 440,127,360 |
| Size | 439.0 MB | 419.7 MB |
| Events in quadrant A | 2,774,704 | 2,609,420 |
| Events in quadrant B | 2,718,009 | 2,643,595 |
| Events in quadrant C | 2,771,748 | 2,465,951 |
| Events in quadrant D | 2,335,834 | 2,270,682 |
| Mode SS | |||
|---|---|---|---|
| Quadrant | BADHDUFLAG | Total packets | Discarded packets |
| A | 0 | 990 | 0 |
| B | 0 | 1046 | 0 |
| C | 0 | 1018 | 0 |
| D | 0 | 986 | 0 |
| Mode M0 | |||
|---|---|---|---|
| Quadrant | BADHDUFLAG | Total packets | Discarded packets |
| A | 0 | 104789 | 0 |
| B | 0 | 102938 | 0 |
| C | 0 | 100012 | 0 |
| D | 0 | 132858 | 0 |
| Mode M9 | |||
|---|---|---|---|
| Quadrant | BADHDUFLAG | Total packets | Discarded packets |
| A | 0 | 84 | 0 |
| B | 0 | 83 | 0 |
| C | 0 | 86 | 0 |
| D | 0 | 86 | 0 |
| Quadrant | Total seconds | Saturated seconds | Saturation percentage |
|---|---|---|---|
| A | 48679 | 561 | 1.152448% |
| B | 48742 | 595 | 1.220713% |
| C | 48650 | 318 | 0.653649% |
| D | 48260 | 2132 | 4.417737% |
Noise dominated data is calculated using 1-second bins in cleaned event files. If a bin has >2000 counts, and if more than 50% of those come from <1% of pixels, then it is considered to be noise-dominated and hence unusable.
| Quadrant | # 1 sec bins | Bins with >0 counts | Bins with >2000 counts | High rate bins dominated by noise | Noise dominated (total time) | Noise dominated (detector-on time) | Marked lightcurve |
|---|---|---|---|---|---|---|---|
| A | 63755 | 49587 | 0 | 0 | 0.00% | 0.00% | 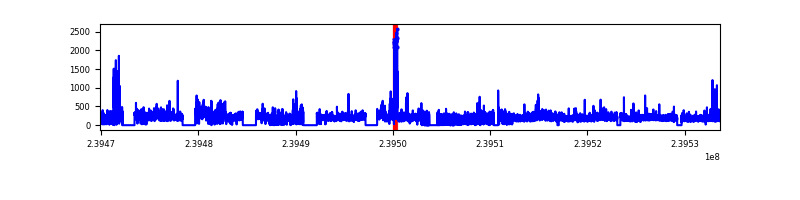 |
| B | 63755 | 49695 | 0 | 0 | 0.00% | 0.00% | 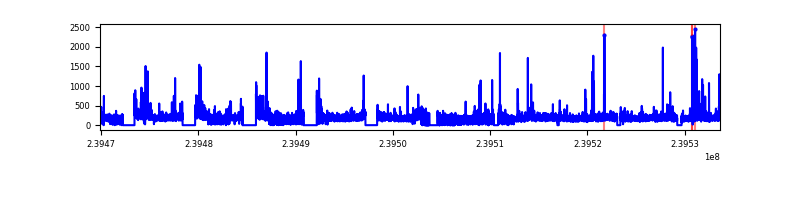 |
| C | 63755 | 49630 | 0 | 0 | 0.00% | 0.00% | 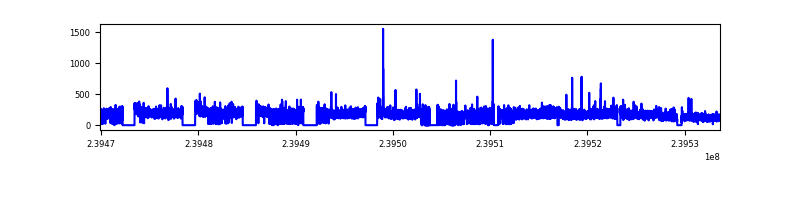 |
| D | 63755 | 49039 | 0 | 0 | 0.00% | 0.00% |  |
Top three noisy pixels from each quadrant. If the there are fewer than three noisy pixels in the level2.evt file, extra rows are filled as -1
| Pixel properties | Quadrant properties | ||||||
|---|---|---|---|---|---|---|---|
| Quadrant | DetID | PixID | Counts | Sigma | Mean | Median | Sigma |
| A | 0 | 29 | 2707 | 11.11 | 721 | 673 | 183.1 |
| A | 7 | 110 | 2239 | 8.55 | 721 | 673 | 183.1 |
| A | 0 | 30 | 2026 | 7.39 | 721 | 673 | 183.1 |
| B | 2 | 9 | 2370 | 11.8 | 716 | 682 | 143.1 |
| B | 14 | 254 | 1805 | 7.85 | 716 | 682 | 143.1 |
| B | 3 | 17 | 1780 | 7.67 | 716 | 682 | 143.1 |
| C | 1 | 80 | 1802 | 6.49 | 735 | 706 | 169.0 |
| C | 12 | 241 | 1670 | 5.71 | 735 | 706 | 169.0 |
| C | 9 | 242 | 1644 | 5.55 | 735 | 706 | 169.0 |
| D | 7 | 3 | 1658 | 5.87 | 666 | 605 | 179.4 |
| D | 6 | 231 | 1639 | 5.76 | 666 | 605 | 179.4 |
| D | 6 | 67 | 1620 | 5.66 | 666 | 605 | 179.4 |
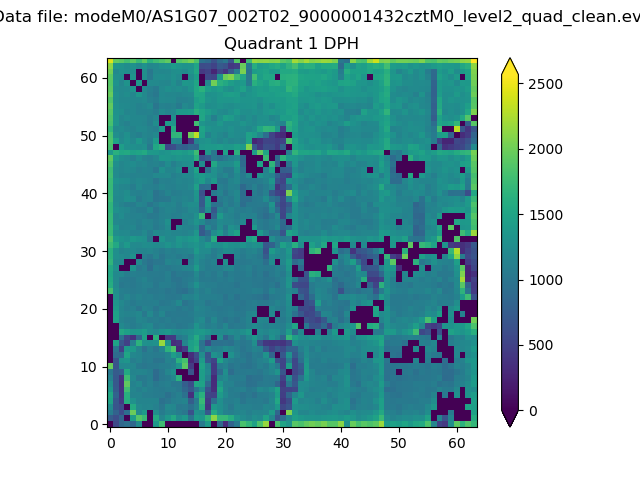
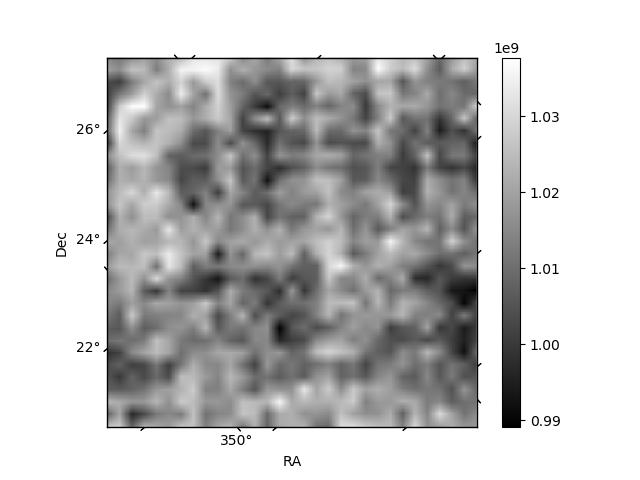
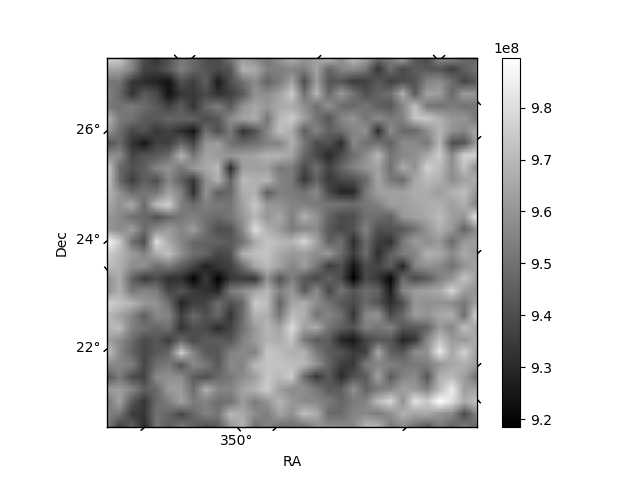
Histogram calculated using DETX and DETY for each event in the final _common_clean file
| Quadrant A | 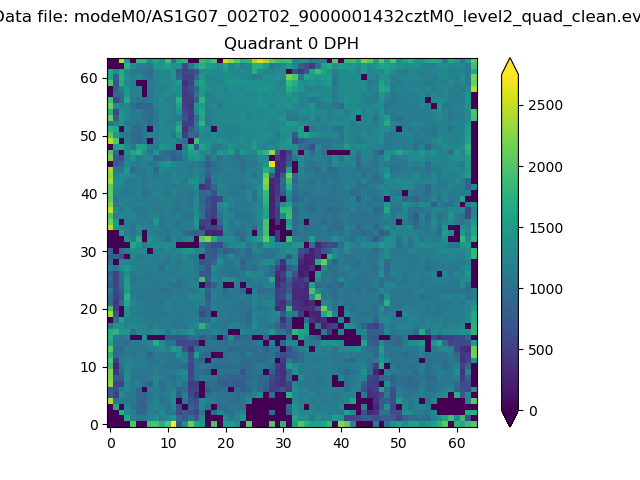 |
 |
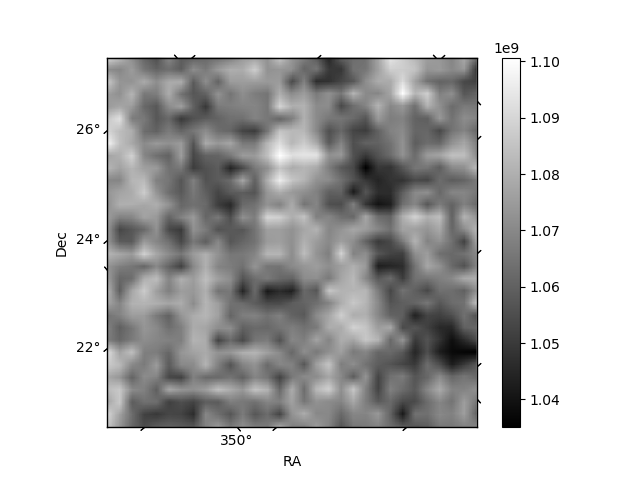
Quadrant B |
|---|---|---|---|
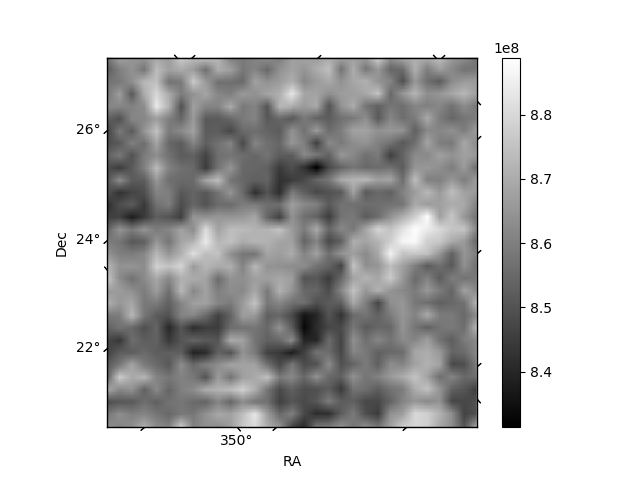
| Quadrant D | 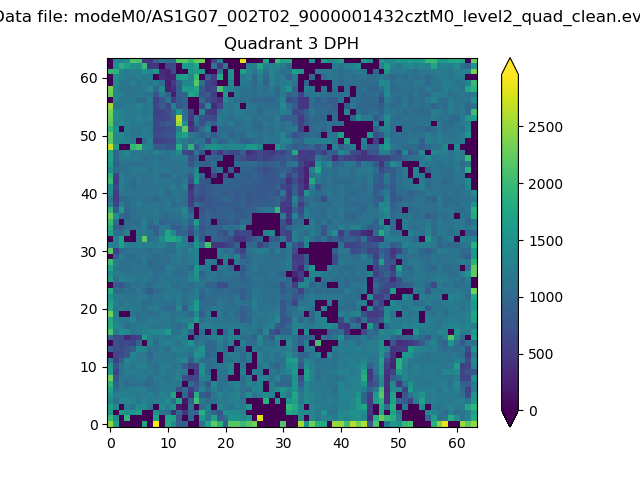 |
 |
Quadrant C |
| Plot type | Count rate plots | Images |
|---|---|---|
| Comparison with Poisson distribution Blue bars denote a histogram of data divided into 1 sec bins. Red curve is a Poisson curve with rate = median count rate of data. |
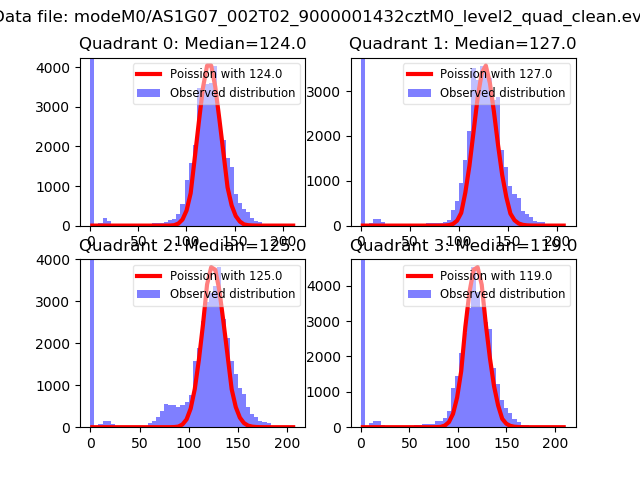 |
 |
| Quadrant-wise count rates Data is divided into 100 sec bins |
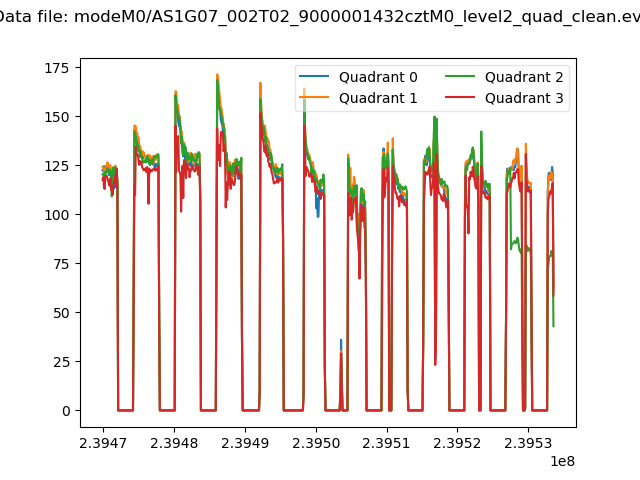 |
|
| Module-wise count rates for Quadrant A Data is divided into 100 sec bins |
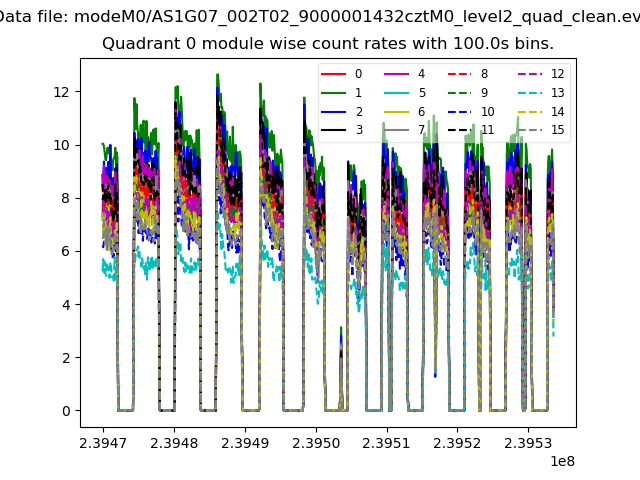 |
 |
| Module-wise count rates for Quadrant B Data is divided into 100 sec bins |
 |
 |
| Module-wise count rates for Quadrant C Data is divided into 100 sec bins |
 |
 |
| Module-wise count rates for Quadrant D Data is divided into 100 sec bins |
 |
 |
| Parameter | Plot |
|---|---|
| CZT HV Monitor | 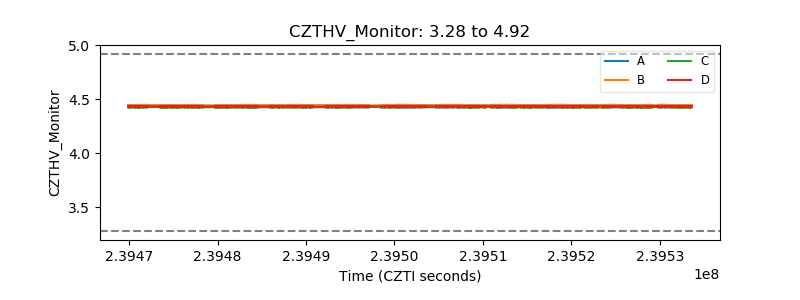 |
| D_VDD |  |
| Temperature 1 | 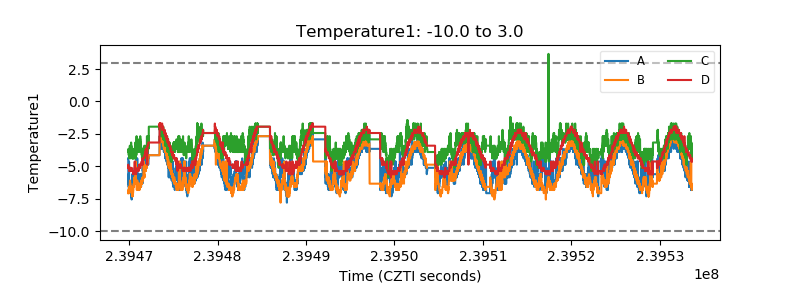 |
| Veto HV Monitor |  |
| Veto LLD |  |
| Alpha Counter | 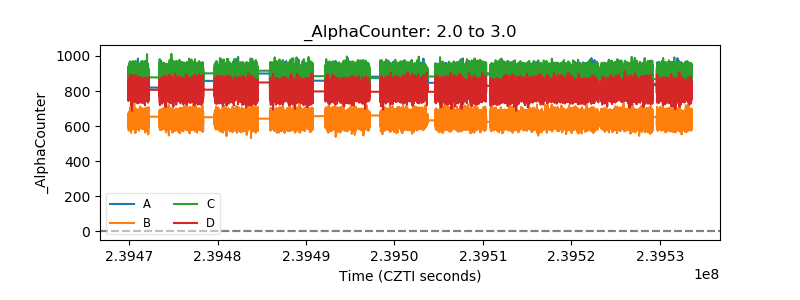 |
| _CPM_Rate | 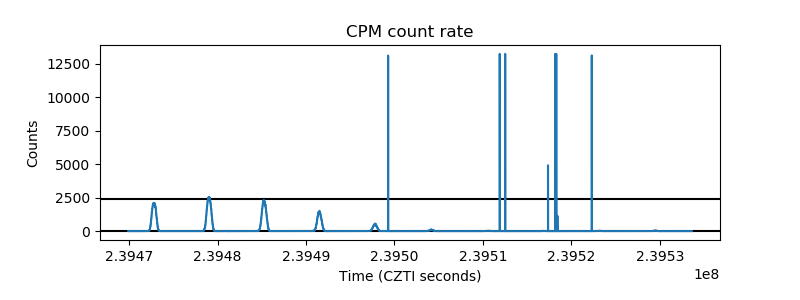 |
| CZT Counter |  |
| +2.5 Volts monitor | 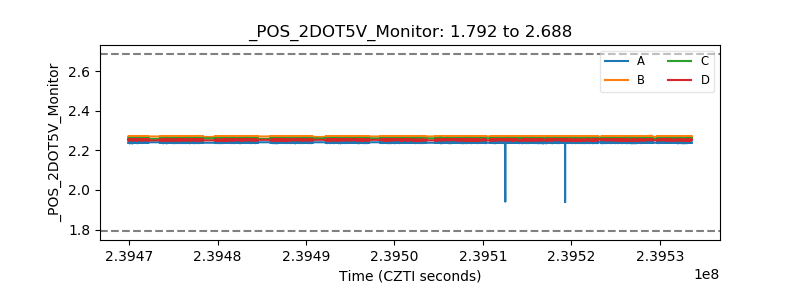 |
| +5 Volts monitor |  |
| _ROLL_ROT | 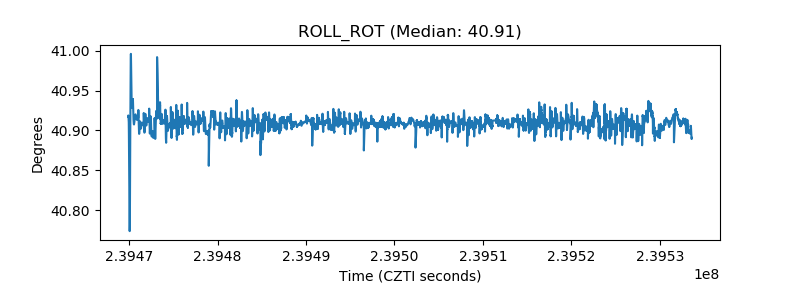 |
| _Roll_DEC | 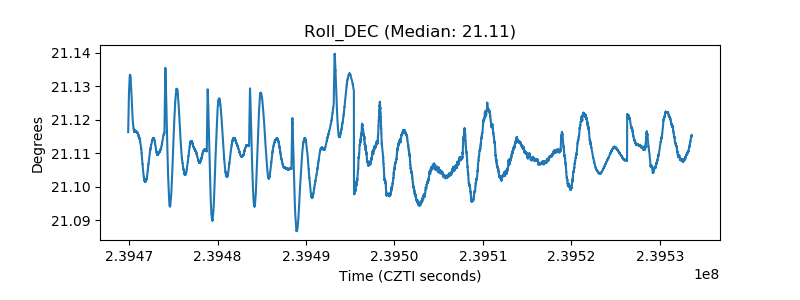 |
| _Roll_RA |  |
| Veto Counter |  |