| Param | Original file | Final file |
|---|---|---|
| Filename | modeM0/AS1G07_002T02_9000001432_09999cztM0_level2.evt | modeM0/AS1G07_002T02_9000001432_09999cztM0_level2_quad_clean.evt |
| Size (bytes) | 284,664,960 | 49,599,360 |
| Size | 271.5 MB | 47.3 MB |
| Events in quadrant A | 2,043,807 | 313,511 |
| Events in quadrant B | 1,832,431 | 322,587 |
| Events in quadrant C | 1,711,314 | 315,611 |
| Events in quadrant D | 2,791,454 | 298,848 |
| Mode SS | |||
|---|---|---|---|
| Quadrant | BADHDUFLAG | Total packets | Discarded packets |
| A | 0 | 74 | 0 |
| B | 0 | 74 | 2 |
| C | 0 | 74 | 0 |
| D | 0 | 74 | 2 |
| Mode M0 | |||
|---|---|---|---|
| Quadrant | BADHDUFLAG | Total packets | Discarded packets |
| A | 0 | 8557 | 135 |
| B | 0 | 7908 | 73 |
| C | 0 | 7599 | 88 |
| D | 0 | 10626 | 113 |
| Mode M9 | |||
|---|---|---|---|
| Quadrant | BADHDUFLAG | Total packets | Discarded packets |
| A | 0 | 12 | 0 |
| B | 0 | 12 | 0 |
| C | 0 | 12 | 0 |
| D | 0 | 12 | 0 |
| Quadrant | Total seconds | Saturated seconds | Saturation percentage |
|---|---|---|---|
| A | 3535 | 70 | 1.980198% |
| B | 3553 | 53 | 1.491697% |
| C | 3545 | 39 | 1.100141% |
| D | 3547 | 263 | 7.414717% |
Noise dominated data is calculated using 1-second bins in cleaned event files. If a bin has >2000 counts, and if more than 50% of those come from <1% of pixels, then it is considered to be noise-dominated and hence unusable.
| Quadrant | # 1 sec bins | Bins with >0 counts | Bins with >2000 counts | High rate bins dominated by noise | Noise dominated (total time) | Noise dominated (detector-on time) | Marked lightcurve |
|---|---|---|---|---|---|---|---|
| A | 4808 | 3586 | 24 | 24 | 0.50% | 0.67% | 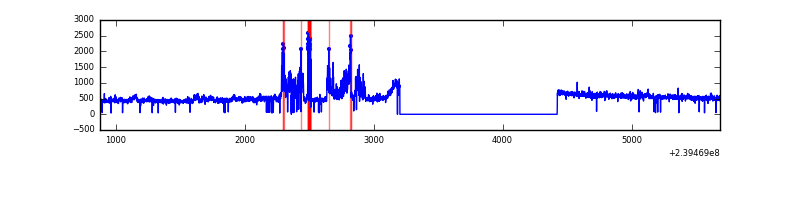 |
| B | 4807 | 3584 | 1 | 1 | 0.02% | 0.03% | 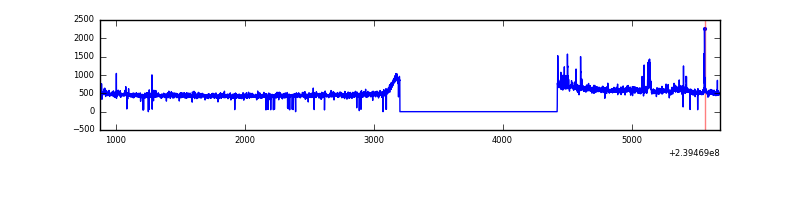 |
| C | 4808 | 3587 | 0 | 0 | 0.00% | 0.00% | 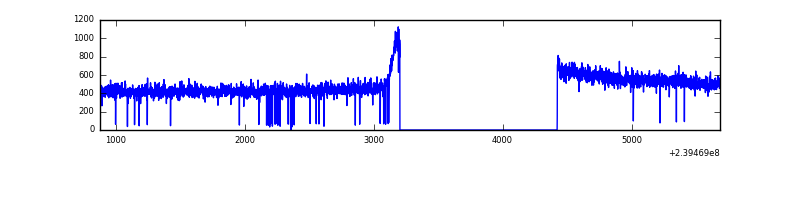 |
| D | 4808 | 3585 | 202 | 202 | 4.20% | 5.63% | 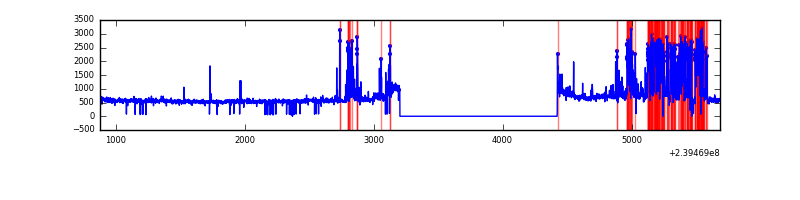 |
Top three noisy pixels from each quadrant. If the there are fewer than three noisy pixels in the level2.evt file, extra rows are filled as -1
| Pixel properties | Quadrant properties | ||||||
|---|---|---|---|---|---|---|---|
| Quadrant | DetID | PixID | Counts | Sigma | Mean | Median | Sigma |
| A | 14 | 111 | 233962 | 2560.07 | 446 | 437 | 91.2 |
| A | 8 | 15 | 94217 | 1028.08 | 446 | 437 | 91.2 |
| A | 0 | 226 | 4056 | 39.67 | 446 | 437 | 91.2 |
| B | 4 | 239 | 27205 | 307.6 | 450 | 440 | 87.0 |
| B | 5 | 94 | 23749 | 267.88 | 450 | 440 | 87.0 |
| B | 0 | 214 | 9506 | 104.19 | 450 | 440 | 87.0 |
| C | 13 | 61 | 3136 | 26.19 | 438 | 442 | 102.9 |
| C | 8 | 222 | 1799 | 13.19 | 438 | 442 | 102.9 |
| C | 14 | 67 | 1692 | 12.15 | 438 | 442 | 102.9 |
| D | 12 | 233 | 670652 | 6154.43 | 426 | 416 | 108.9 |
| D | 8 | 195 | 305979 | 2805.83 | 426 | 416 | 108.9 |
| D | 2 | 16 | 90039 | 822.96 | 426 | 416 | 108.9 |
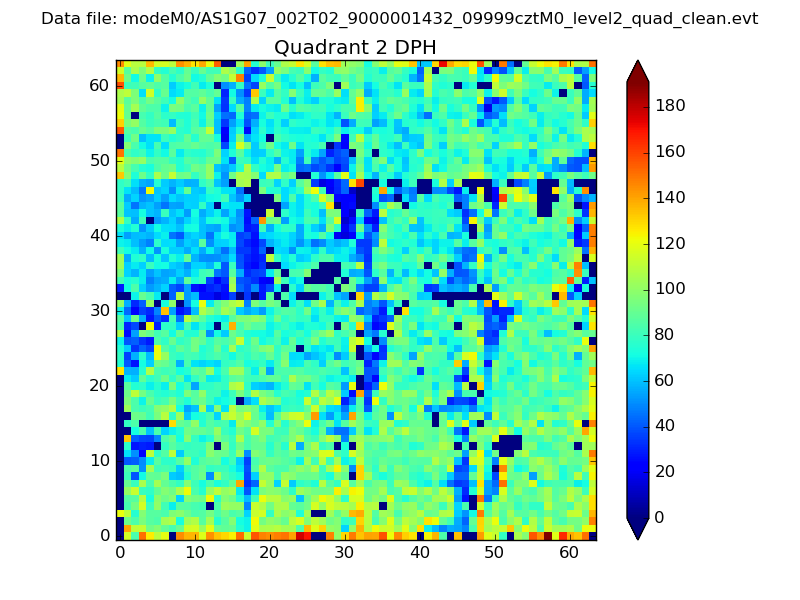
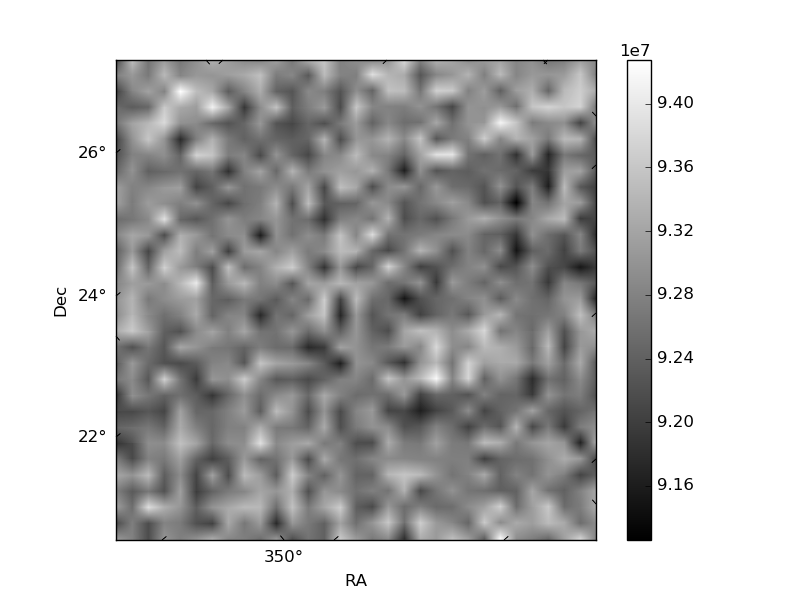
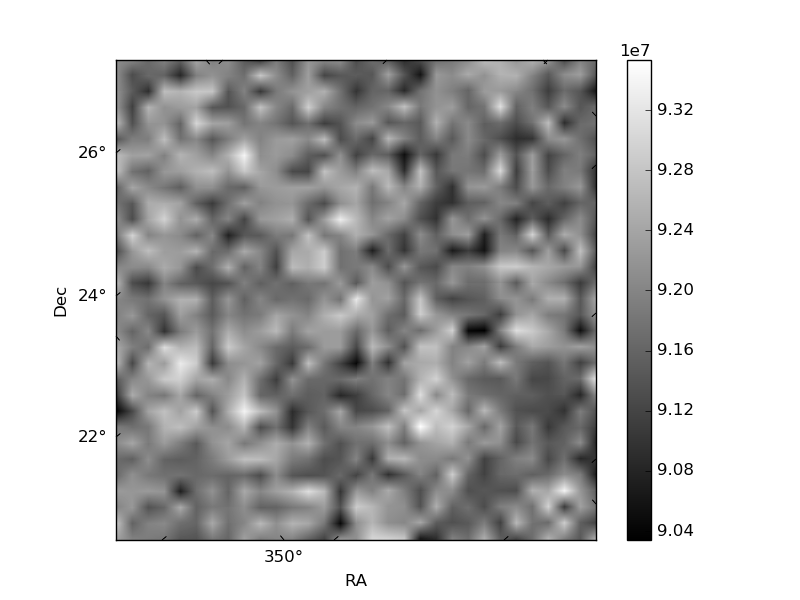
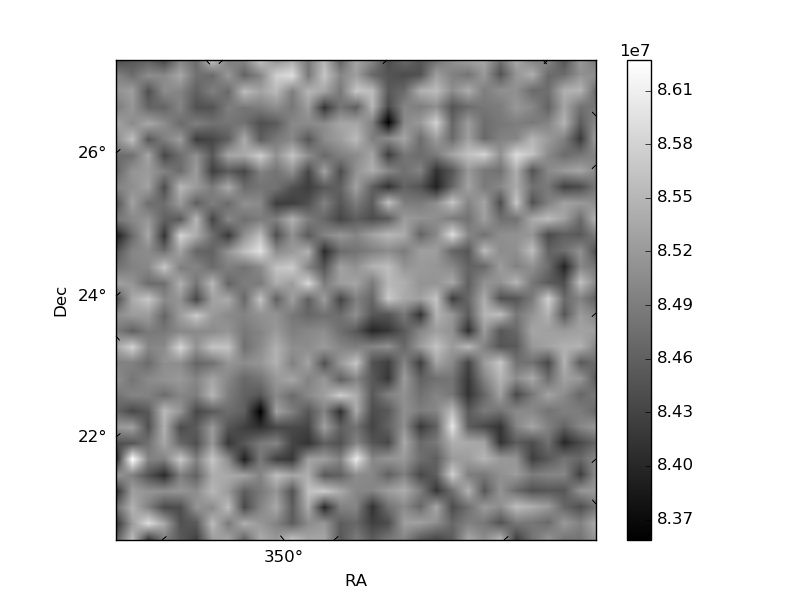
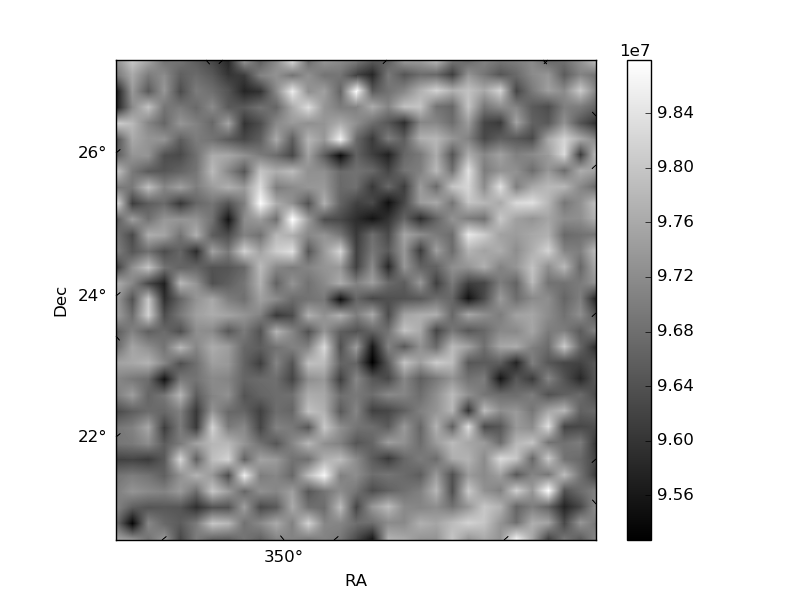
Histogram calculated using DETX and DETY for each event in the final _common_clean file
| Quadrant A | 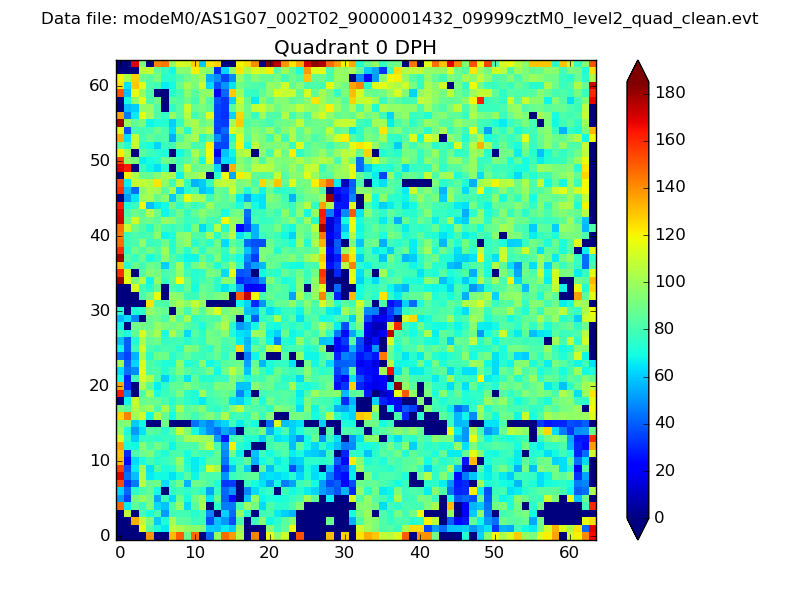 |
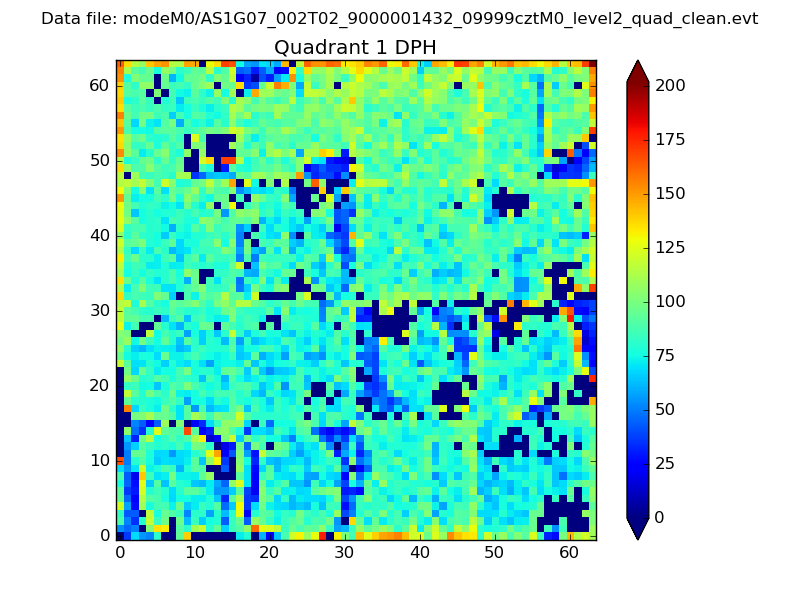 |
Quadrant B |
|---|---|---|---|
| Quadrant D | 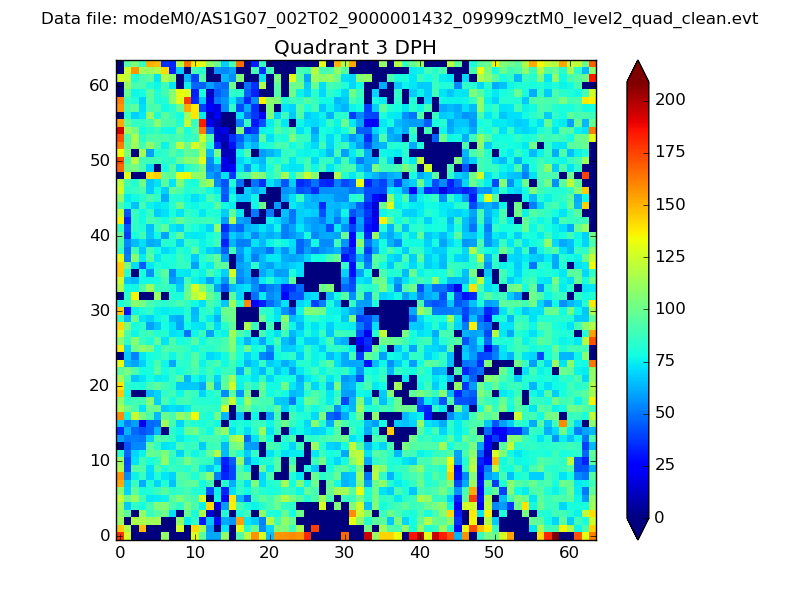 |
 |
Quadrant C |
| Plot type | Count rate plots | Images |
|---|---|---|
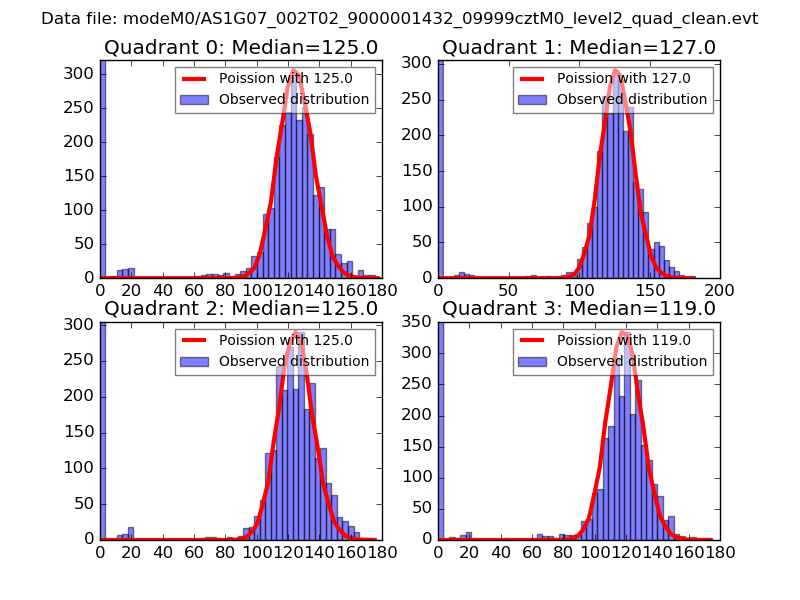
| Comparison with Poisson distribution Blue bars denote a histogram of data divided into 1 sec bins. Red curve is a Poisson curve with rate = median count rate of data. |
 |
 |
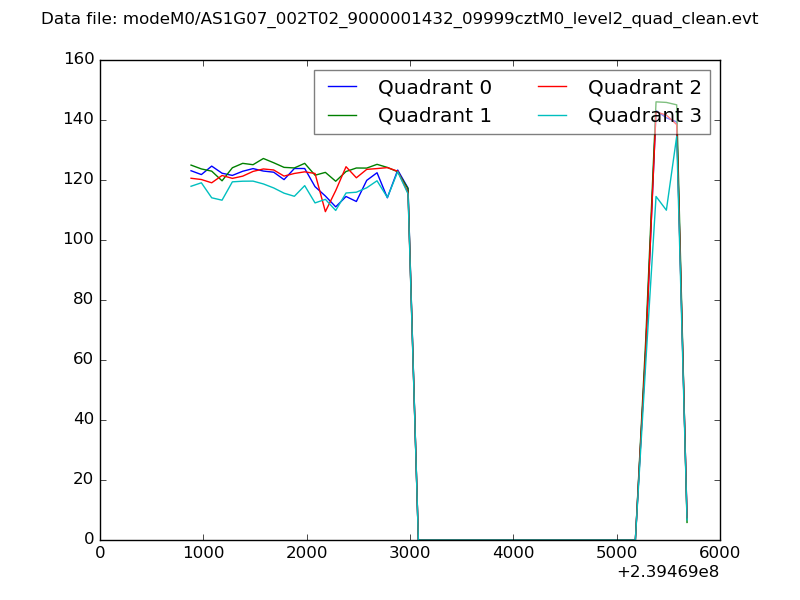
| Quadrant-wise count rates Data is divided into 100 sec bins |
 |
|
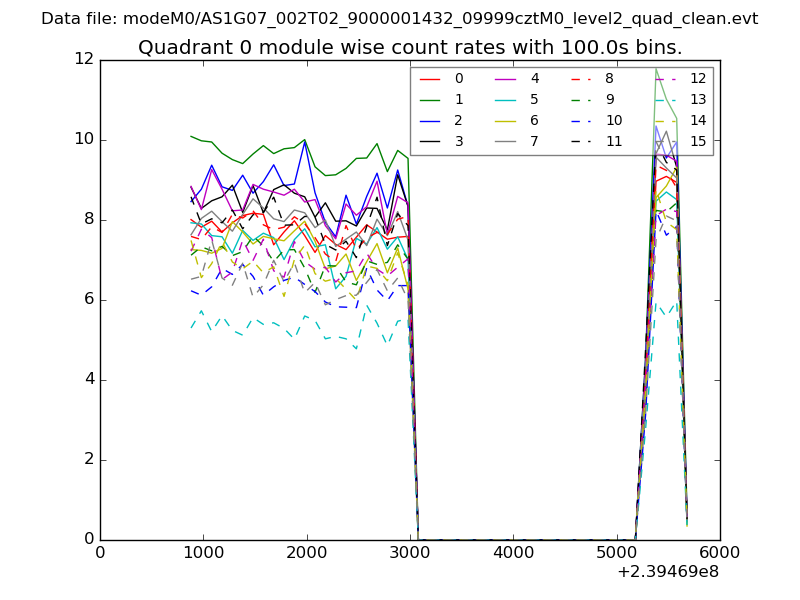
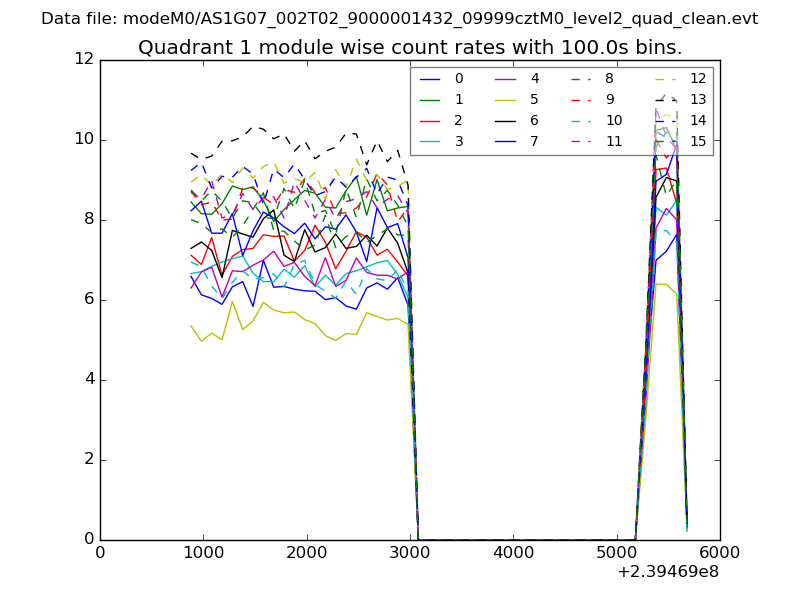
| Module-wise count rates for Quadrant A Data is divided into 100 sec bins |
 |
 |
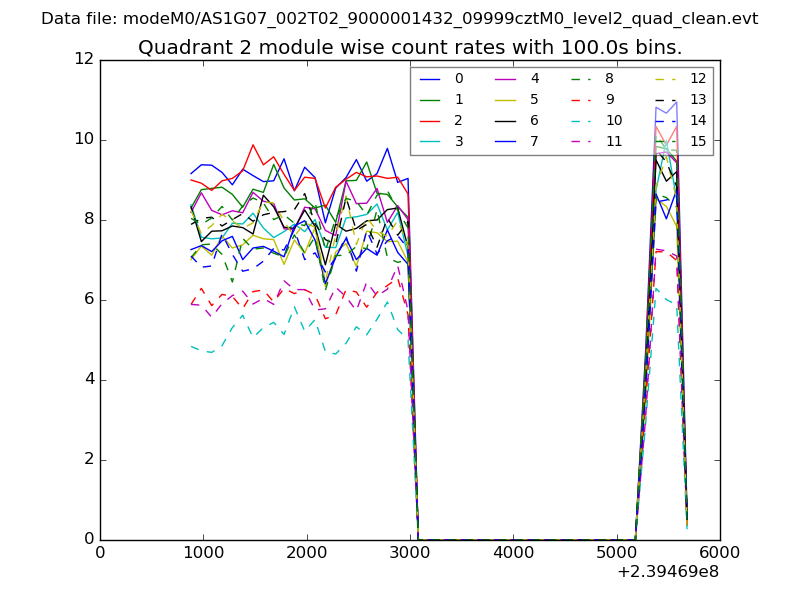
| Module-wise count rates for Quadrant B Data is divided into 100 sec bins |
 |
 |
| Module-wise count rates for Quadrant C Data is divided into 100 sec bins |
 |
 |
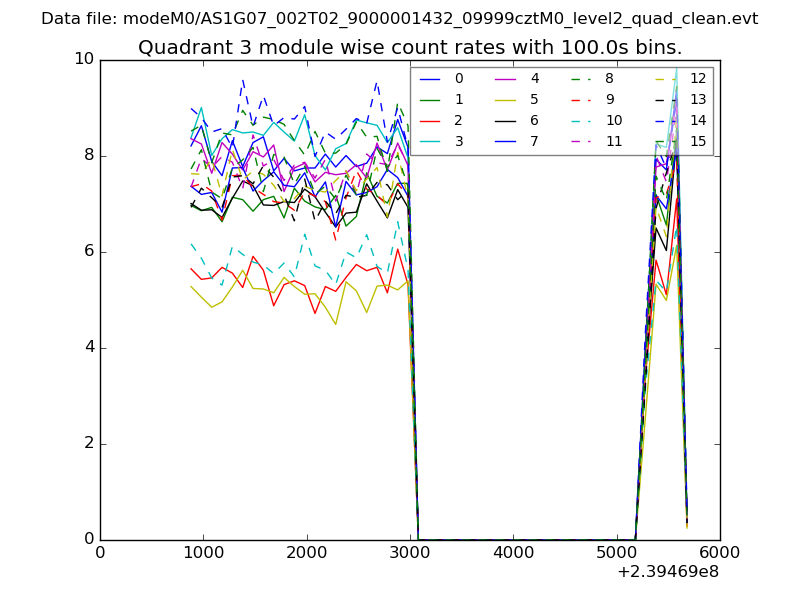
| Module-wise count rates for Quadrant D Data is divided into 100 sec bins |
 |
 |
| Parameter | Plot |
|---|---|
| CZT HV Monitor | 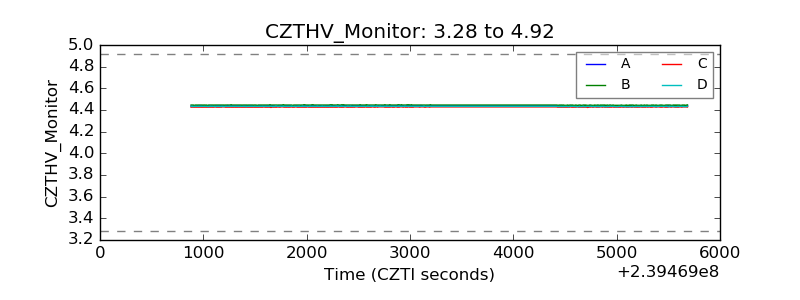 |
| D_VDD | 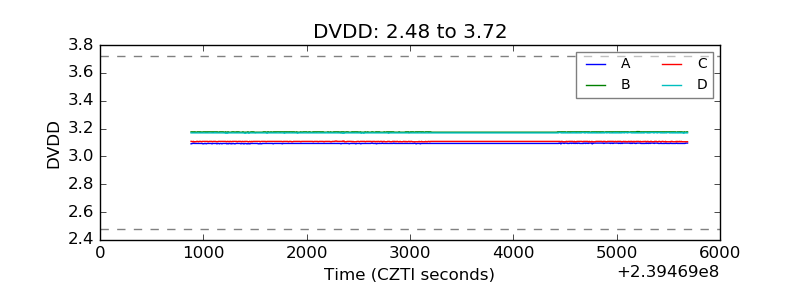 |
| Temperature 1 | 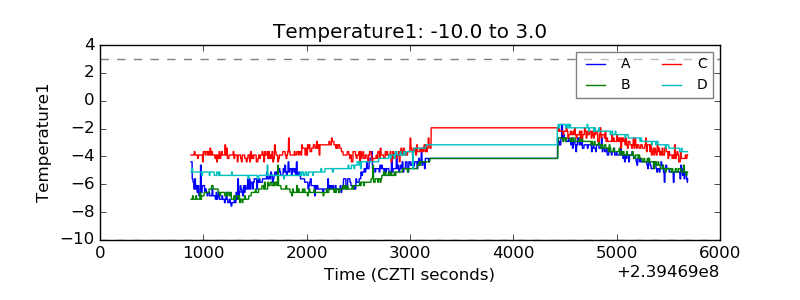 |
| Veto HV Monitor | 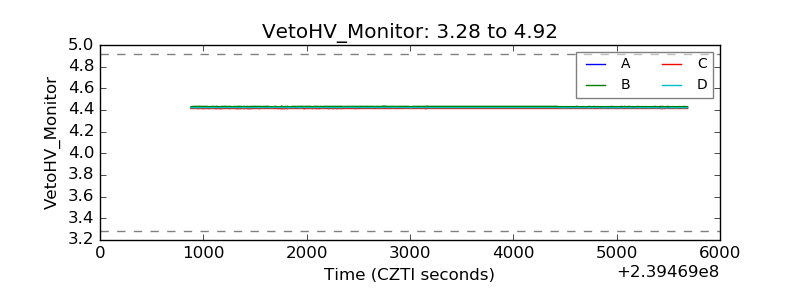 |
| Veto LLD | 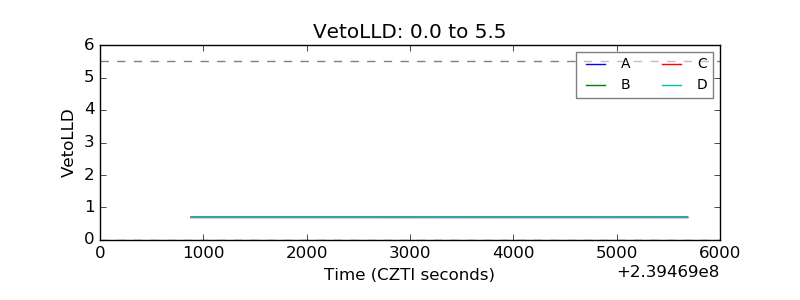 |
| Alpha Counter | 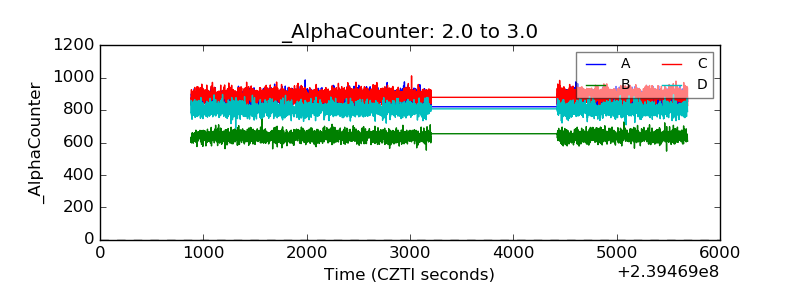 |
| _CPM_Rate | 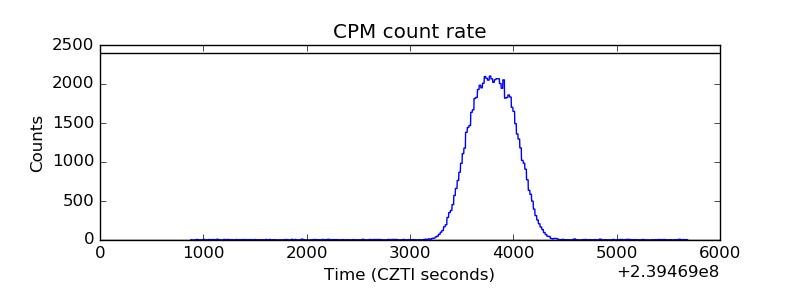 |
| CZT Counter | 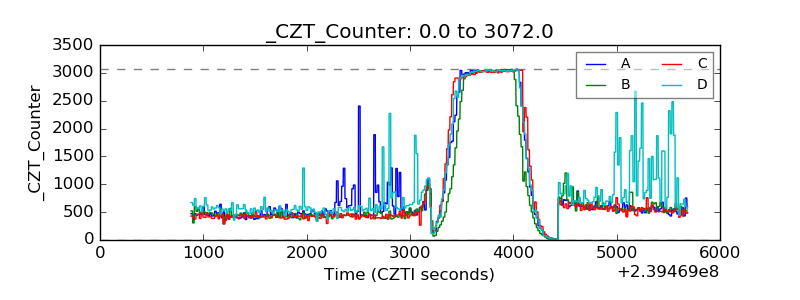 |
| +2.5 Volts monitor |  |
| +5 Volts monitor |  |
| _ROLL_ROT | 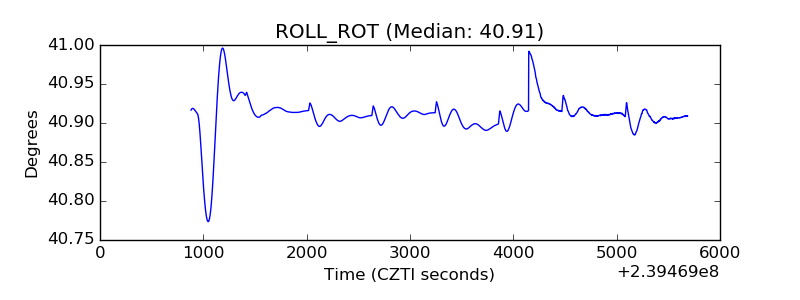 |
| _Roll_DEC | 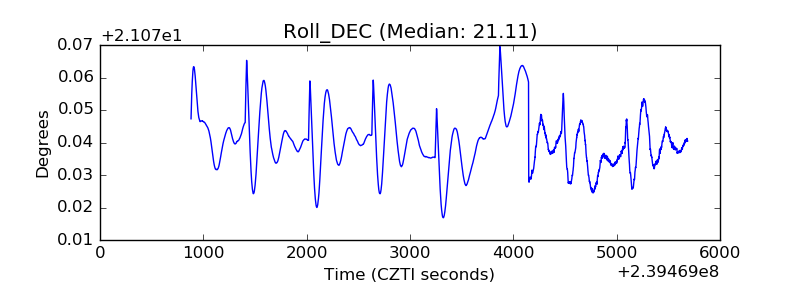 |
| _Roll_RA | 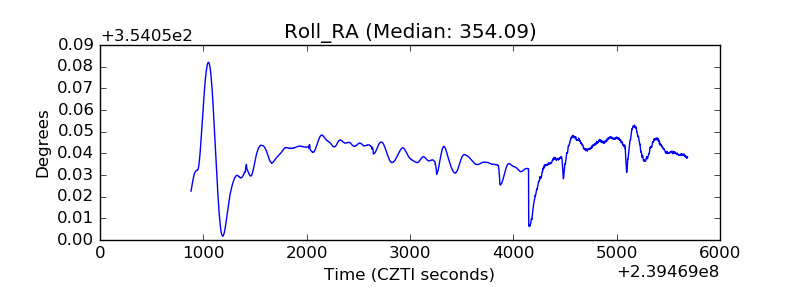 |
| Veto Counter | 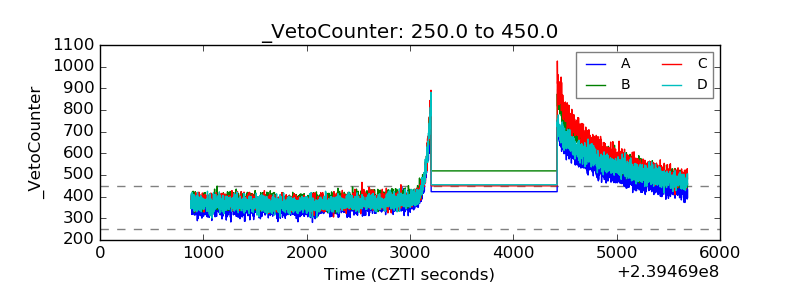 |