| Param | Original file | Final file |
|---|---|---|
| Filename | modeM0/AS1G07_002T02_9000001432_10000cztM0_level2.evt | modeM0/AS1G07_002T02_9000001432_10000cztM0_level2_quad_clean.evt |
| Size (bytes) | 505,938,240 | 91,244,160 |
| Size | 482.5 MB | 87.0 MB |
| Events in quadrant A | 3,357,911 | 587,888 |
| Events in quadrant B | 3,298,682 | 599,815 |
| Events in quadrant C | 3,101,812 | 590,455 |
| Events in quadrant D | 5,140,364 | 549,285 |
| Mode SS | |||
|---|---|---|---|
| Quadrant | BADHDUFLAG | Total packets | Discarded packets |
| A | 0 | 126 | 0 |
| B | 0 | 126 | 0 |
| C | 0 | 126 | 0 |
| D | 0 | 126 | 0 |
| Mode M0 | |||
|---|---|---|---|
| Quadrant | BADHDUFLAG | Total packets | Discarded packets |
| A | 0 | 14143 | 8 |
| B | 0 | 13979 | 6 |
| C | 0 | 13308 | 2 |
| D | 0 | 19280 | 27 |
| Mode M9 | |||
|---|---|---|---|
| Quadrant | BADHDUFLAG | Total packets | Discarded packets |
| A | 0 | 13 | 0 |
| B | 0 | 13 | 0 |
| C | 0 | 13 | 0 |
| D | 0 | 13 | 0 |
| Quadrant | Total seconds | Saturated seconds | Saturation percentage |
|---|---|---|---|
| A | 6247 | 54 | 0.864415% |
| B | 6247 | 83 | 1.328638% |
| C | 6249 | 41 | 0.656105% |
| D | 6243 | 543 | 8.697741% |
Noise dominated data is calculated using 1-second bins in cleaned event files. If a bin has >2000 counts, and if more than 50% of those come from <1% of pixels, then it is considered to be noise-dominated and hence unusable.
| Quadrant | # 1 sec bins | Bins with >0 counts | Bins with >2000 counts | High rate bins dominated by noise | Noise dominated (total time) | Noise dominated (detector-on time) | Marked lightcurve |
|---|---|---|---|---|---|---|---|
| A | 7544 | 6249 | 0 | 0 | 0.00% | 0.00% | 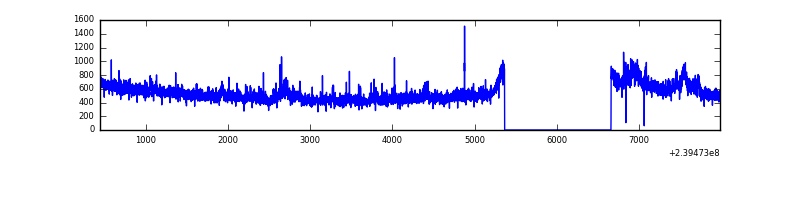 |
| B | 7544 | 6249 | 9 | 9 | 0.12% | 0.14% | 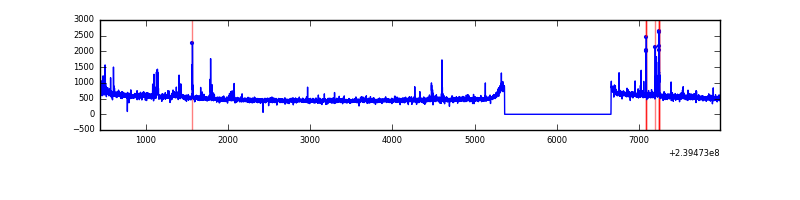 |
| C | 7544 | 6249 | 0 | 0 | 0.00% | 0.00% | 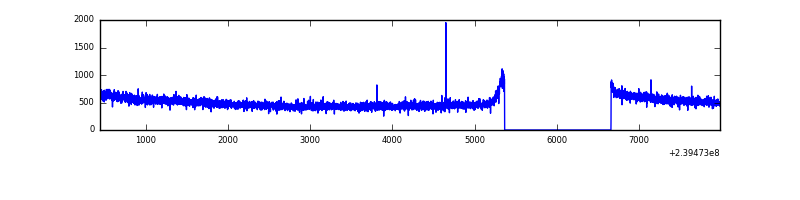 |
| D | 7544 | 6249 | 454 | 454 | 6.02% | 7.27% | 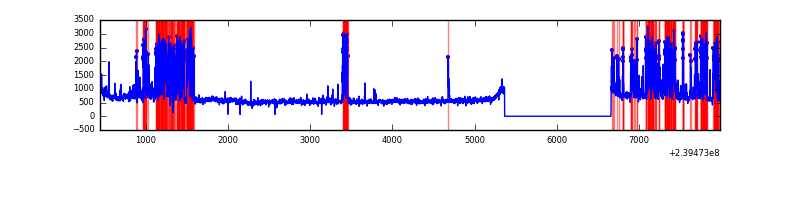 |
Top three noisy pixels from each quadrant. If the there are fewer than three noisy pixels in the level2.evt file, extra rows are filled as -1
| Pixel properties | Quadrant properties | ||||||
|---|---|---|---|---|---|---|---|
| Quadrant | DetID | PixID | Counts | Sigma | Mean | Median | Sigma |
| A | 8 | 15 | 248508 | 1540.09 | 801 | 787 | 160.8 |
| A | 14 | 111 | 22997 | 138.08 | 801 | 787 | 160.8 |
| A | 0 | 226 | 7254 | 40.2 | 801 | 787 | 160.8 |
| B | 4 | 239 | 75359 | 491.49 | 810 | 792 | 151.7 |
| B | 12 | 111 | 16307 | 102.26 | 810 | 792 | 151.7 |
| B | 0 | 214 | 14053 | 87.4 | 810 | 792 | 151.7 |
| C | 13 | 61 | 5672 | 26.47 | 795 | 801 | 184.0 |
| C | 14 | 234 | 2775 | 10.73 | 795 | 801 | 184.0 |
| C | 3 | 202 | 2080 | 6.95 | 795 | 801 | 184.0 |
| D | 12 | 233 | 1469078 | 7718.19 | 763 | 744 | 190.2 |
| D | 8 | 195 | 575978 | 3023.67 | 763 | 744 | 190.2 |
| D | 1 | 52 | 155934 | 815.74 | 763 | 744 | 190.2 |
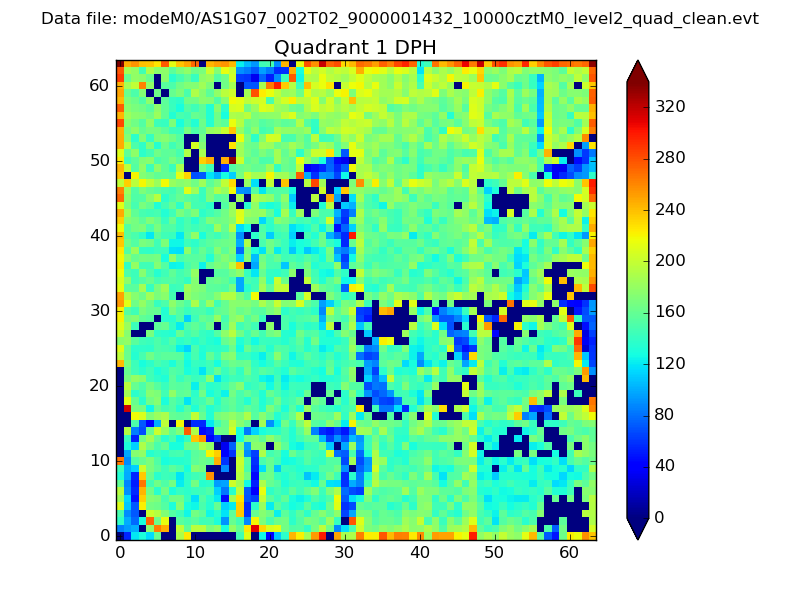
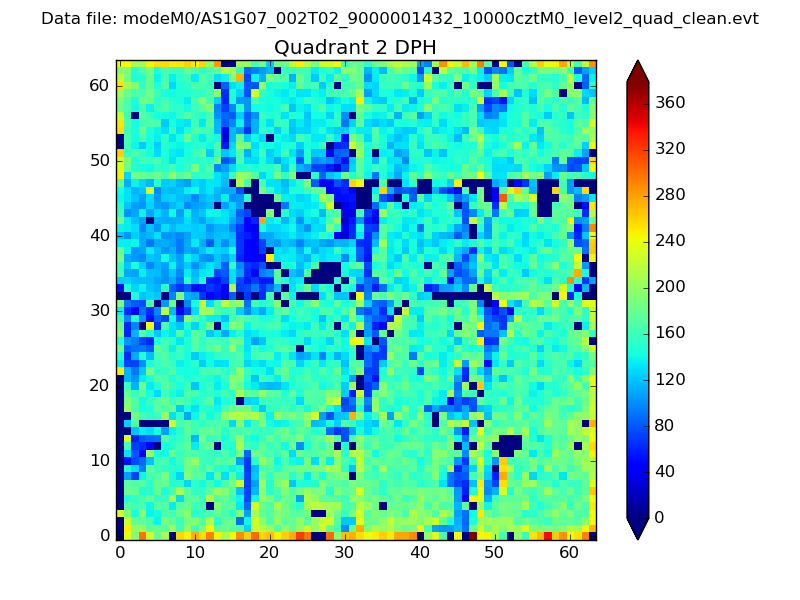
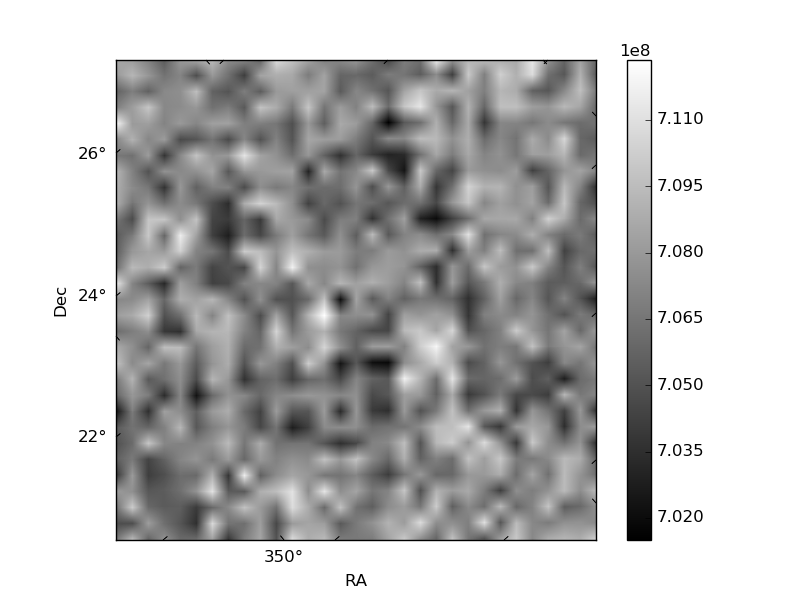
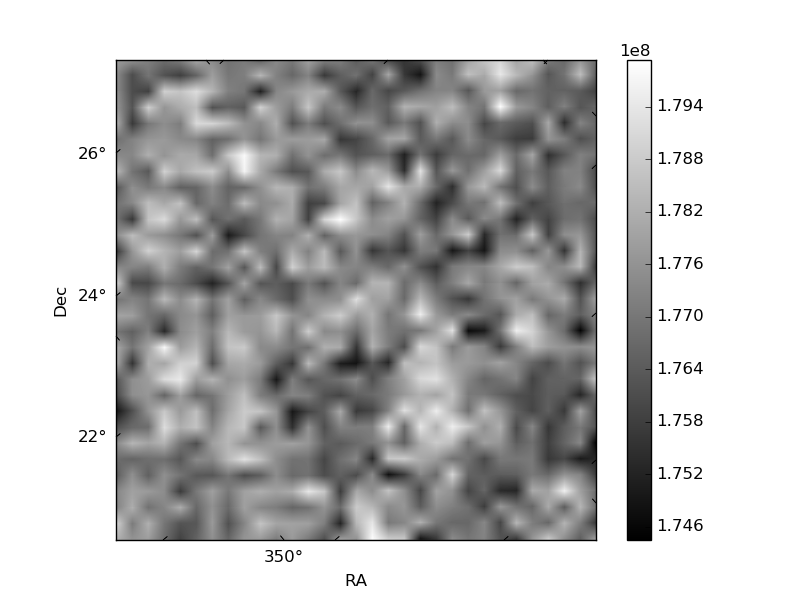
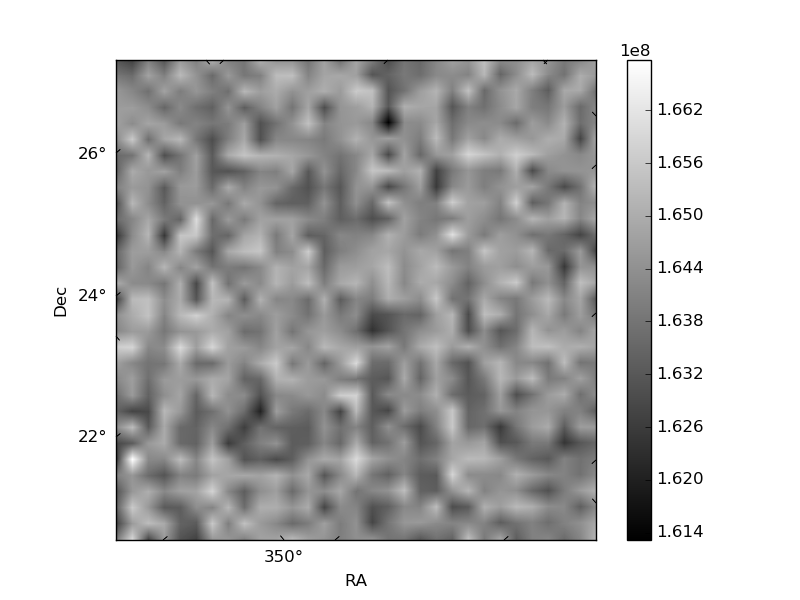
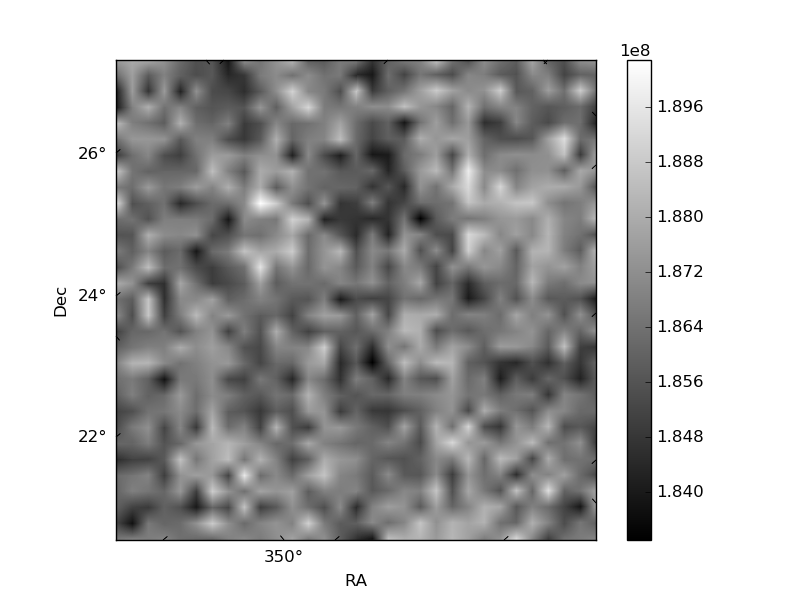
Histogram calculated using DETX and DETY for each event in the final _common_clean file
| Quadrant A |  |
 |
Quadrant B |
|---|---|---|---|
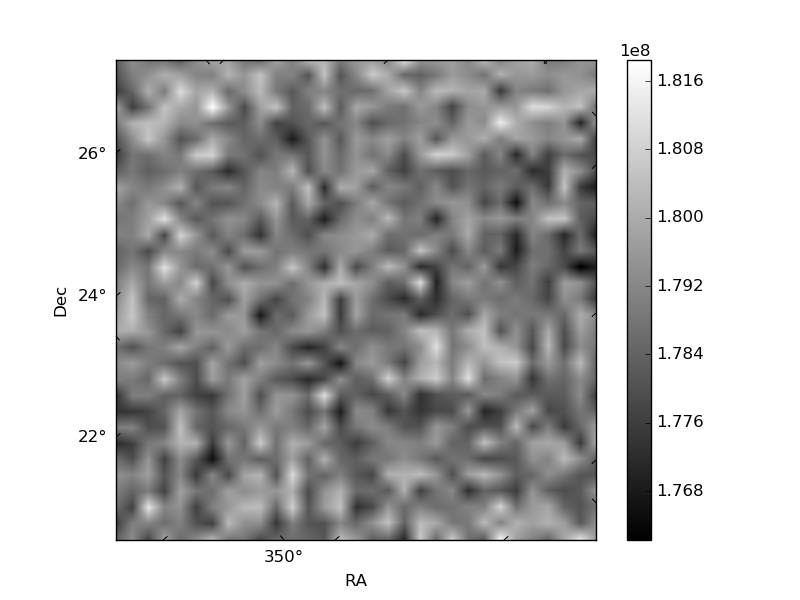
| Quadrant D | 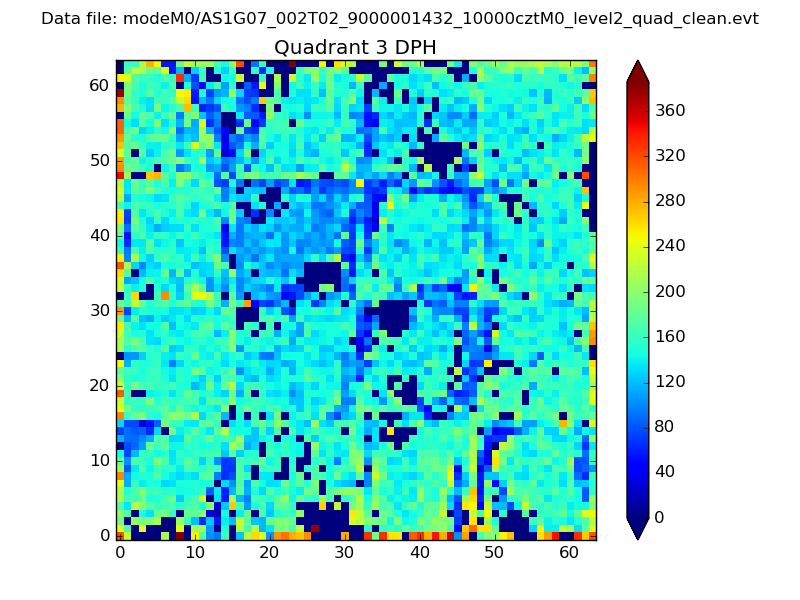 |
 |
Quadrant C |
| Plot type | Count rate plots | Images |
|---|---|---|
| Comparison with Poisson distribution Blue bars denote a histogram of data divided into 1 sec bins. Red curve is a Poisson curve with rate = median count rate of data. |
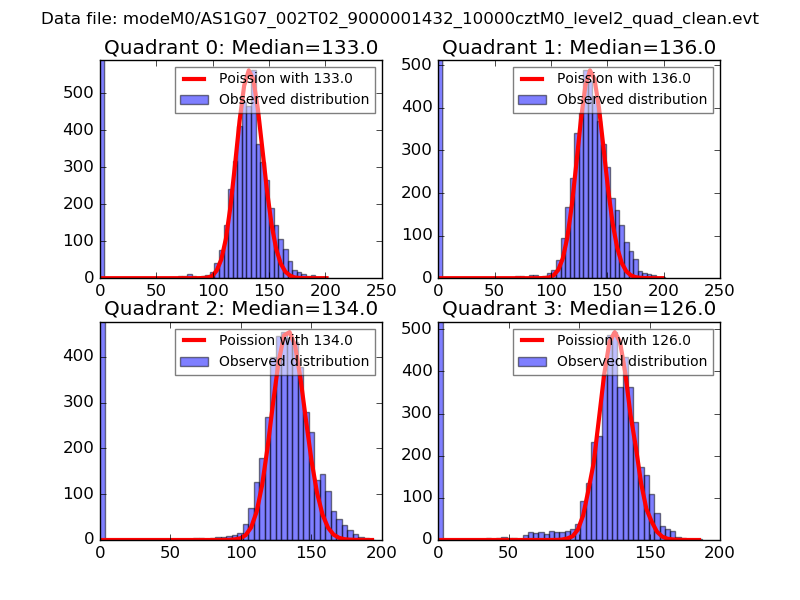 |
 |
| Quadrant-wise count rates Data is divided into 100 sec bins |
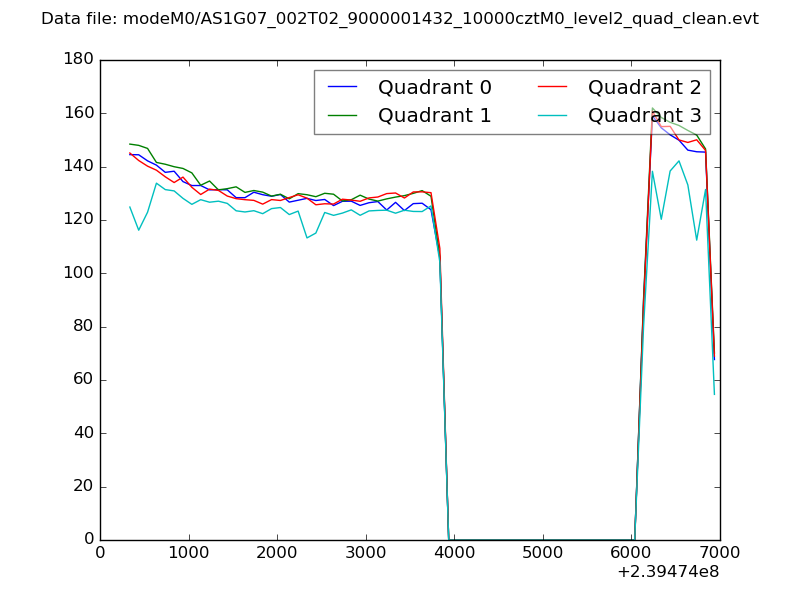 |
|
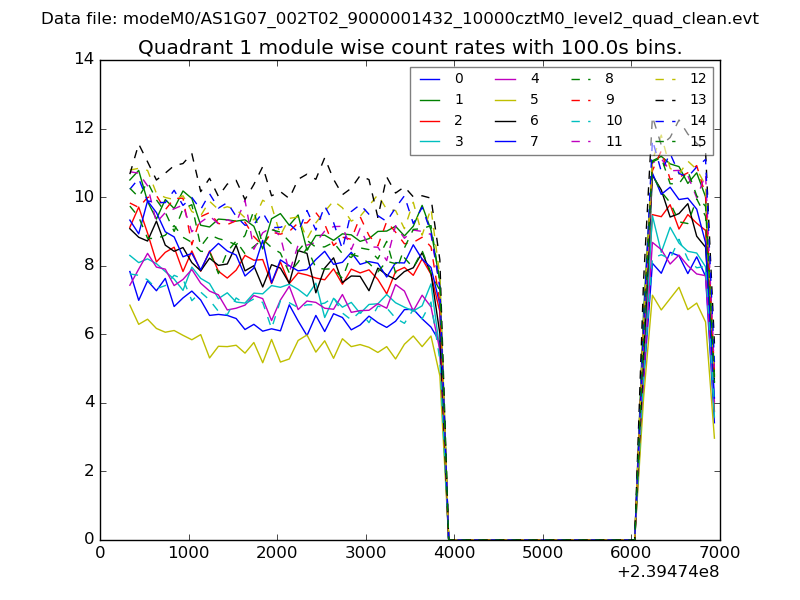
| Module-wise count rates for Quadrant A Data is divided into 100 sec bins |
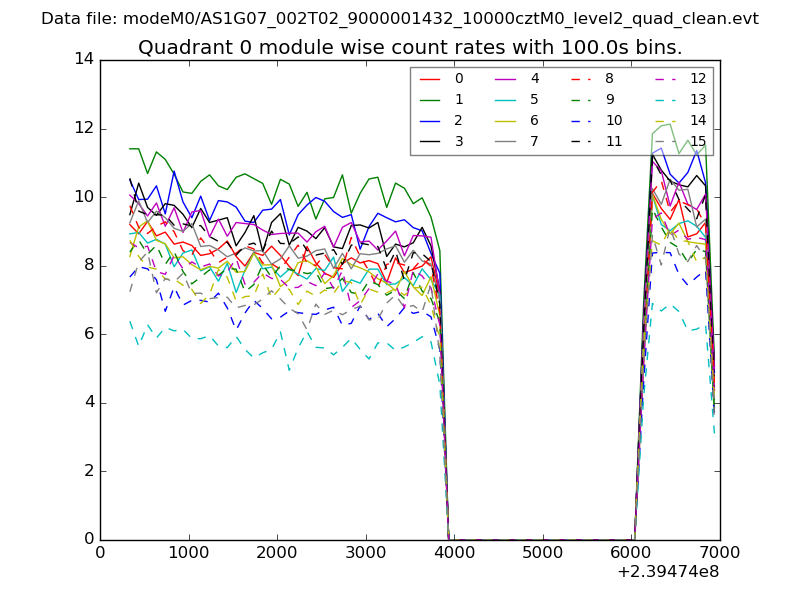 |
 |
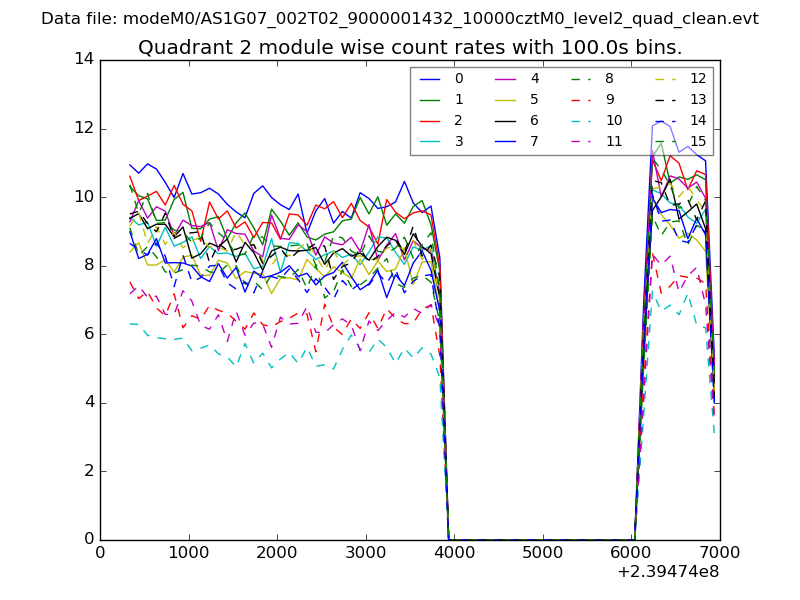
| Module-wise count rates for Quadrant B Data is divided into 100 sec bins |
 |
 |
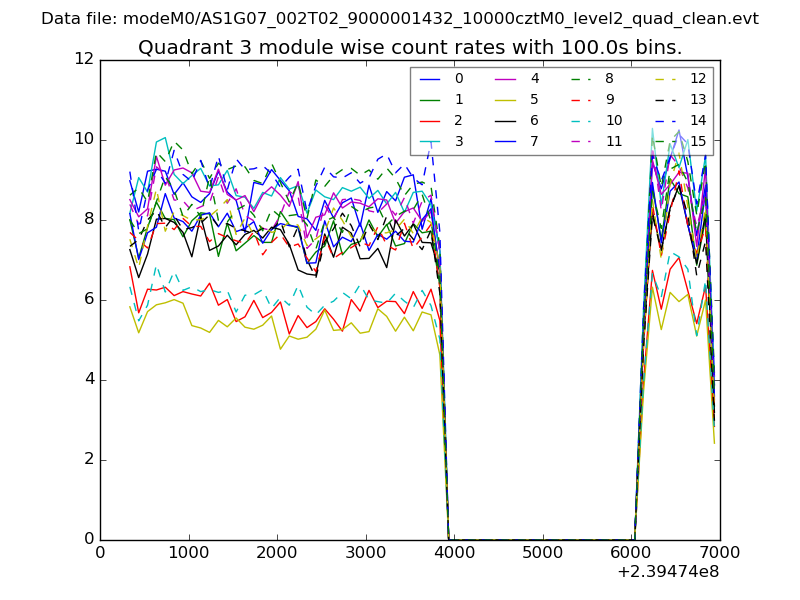
| Module-wise count rates for Quadrant C Data is divided into 100 sec bins |
 |
 |
| Module-wise count rates for Quadrant D Data is divided into 100 sec bins |
 |
 |
| Parameter | Plot |
|---|---|
| CZT HV Monitor |  |
| D_VDD | 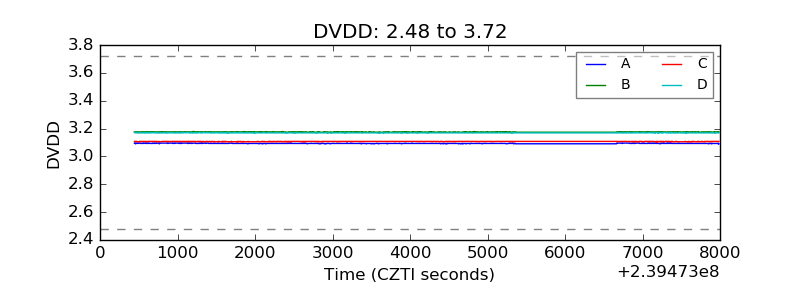 |
| Temperature 1 | 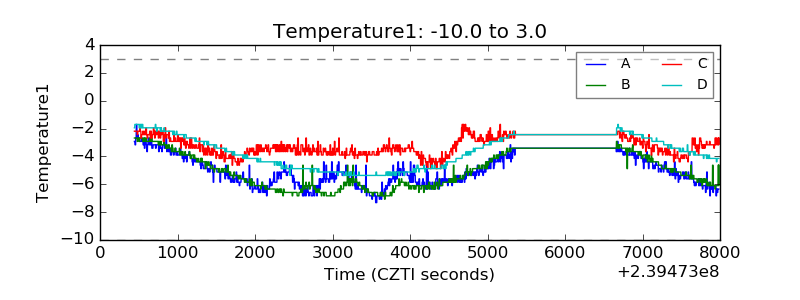 |
| Veto HV Monitor | 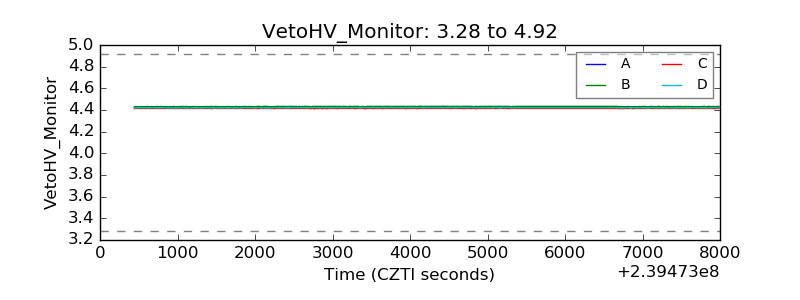 |
| Veto LLD | 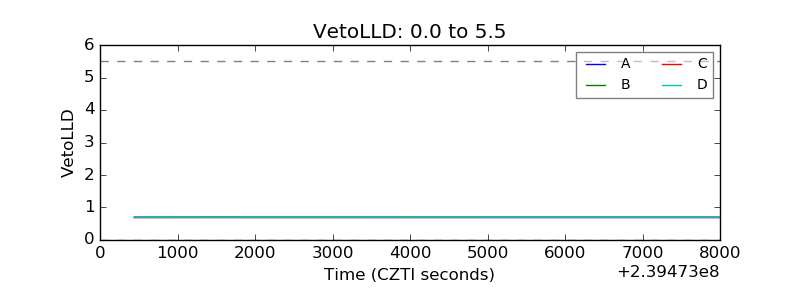 |
| Alpha Counter | 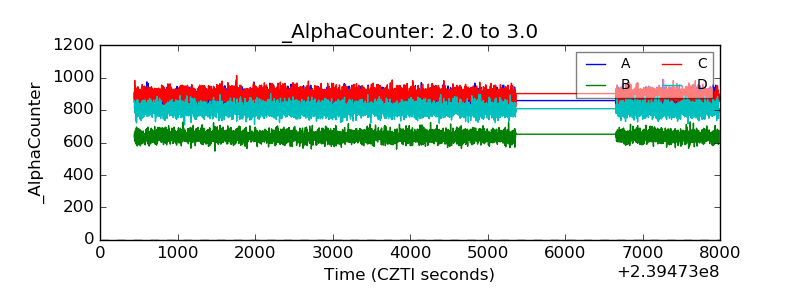 |
| _CPM_Rate | 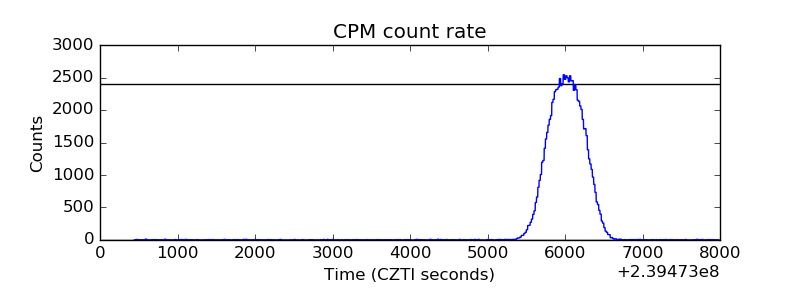 |
| CZT Counter | 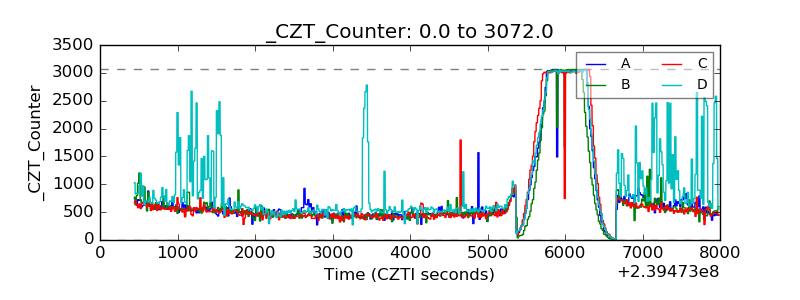 |
| +2.5 Volts monitor |  |
| +5 Volts monitor |  |
| _ROLL_ROT | 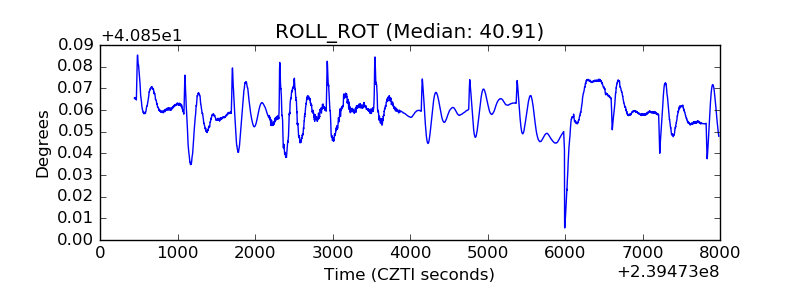 |
| _Roll_DEC | 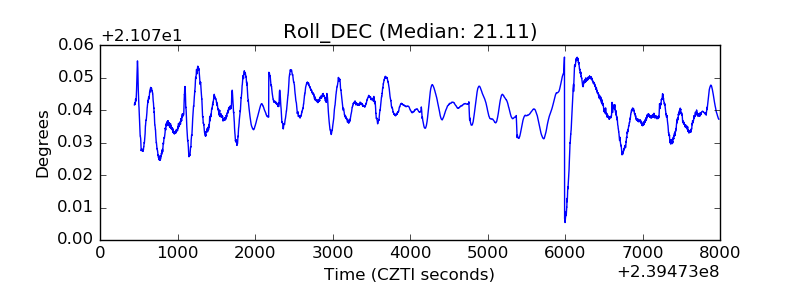 |
| _Roll_RA | 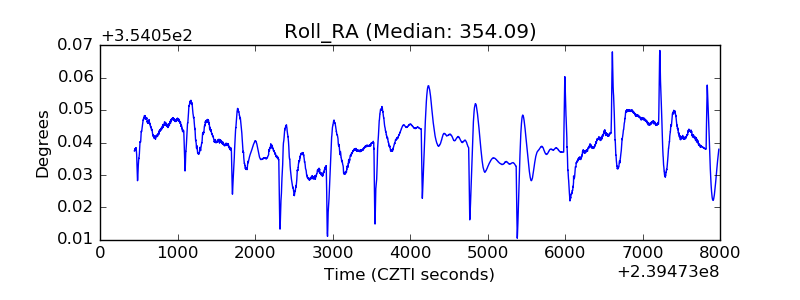 |
| Veto Counter | 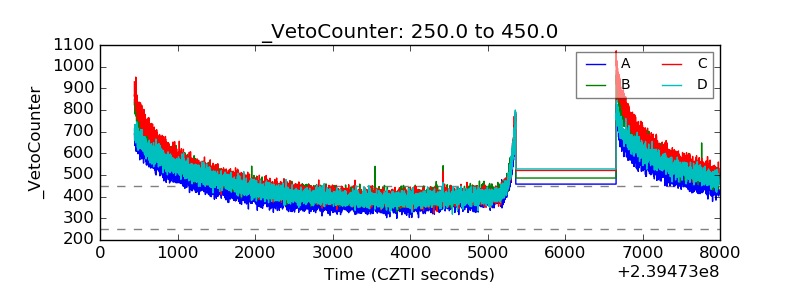 |