| Param | Original file | Final file |
|---|---|---|
| Filename | modeM0/AS1G07_002T02_9000001432_10001cztM0_level2.evt | modeM0/AS1G07_002T02_9000001432_10001cztM0_level2_quad_clean.evt |
| Size (bytes) | 775,673,280 | 167,590,080 |
| Size | 739.7 MB | 159.8 MB |
| Events in quadrant A | 5,232,205 | 1,102,318 |
| Events in quadrant B | 5,068,911 | 1,131,820 |
| Events in quadrant C | 4,834,194 | 1,117,998 |
| Events in quadrant D | 7,678,536 | 1,030,588 |
| Mode SS | |||
|---|---|---|---|
| Quadrant | BADHDUFLAG | Total packets | Discarded packets |
| A | 0 | 206 | 0 |
| B | 0 | 206 | 0 |
| C | 0 | 206 | 0 |
| D | 0 | 206 | 2 |
| Mode M0 | |||
|---|---|---|---|
| Quadrant | BADHDUFLAG | Total packets | Discarded packets |
| A | 0 | 22345 | 333 |
| B | 0 | 22028 | 325 |
| C | 0 | 21208 | 218 |
| D | 0 | 29921 | 808 |
| Mode M9 | |||
|---|---|---|---|
| Quadrant | BADHDUFLAG | Total packets | Discarded packets |
| A | 0 | 27 | 0 |
| B | 0 | 27 | 0 |
| C | 0 | 27 | 0 |
| D | 0 | 27 | 1 |
| Quadrant | Total seconds | Saturated seconds | Saturation percentage |
|---|---|---|---|
| A | 10008 | 94 | 0.939249% |
| B | 10004 | 132 | 1.319472% |
| C | 10040 | 84 | 0.836653% |
| D | 9956 | 728 | 7.312174% |
Noise dominated data is calculated using 1-second bins in cleaned event files. If a bin has >2000 counts, and if more than 50% of those come from <1% of pixels, then it is considered to be noise-dominated and hence unusable.
| Quadrant | # 1 sec bins | Bins with >0 counts | Bins with >2000 counts | High rate bins dominated by noise | Noise dominated (total time) | Noise dominated (detector-on time) | Marked lightcurve |
|---|---|---|---|---|---|---|---|
| A | 12790 | 10119 | 0 | 0 | 0.00% | 0.00% | 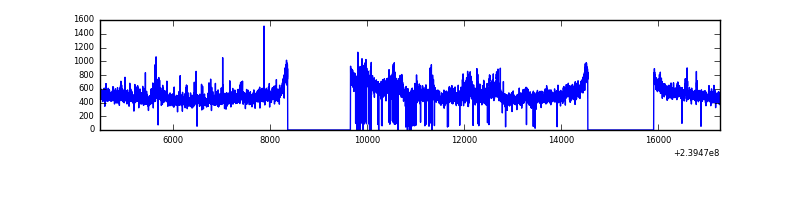 |
| B | 12790 | 10117 | 10 | 10 | 0.08% | 0.10% | 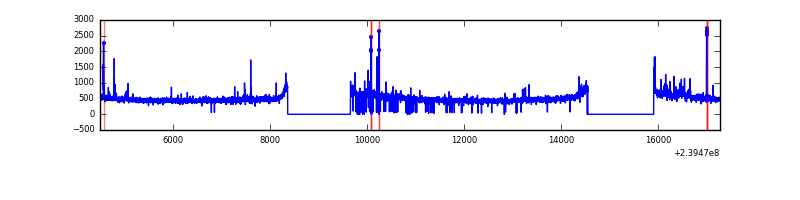 |
| C | 12790 | 10130 | 0 | 0 | 0.00% | 0.00% | 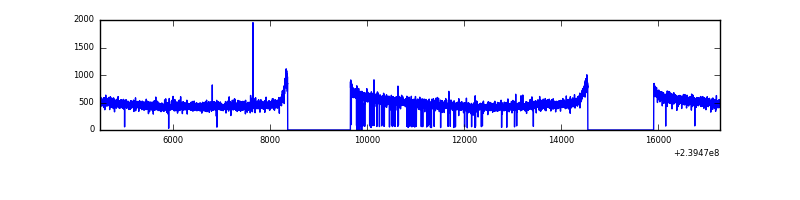 |
| D | 12790 | 10093 | 584 | 584 | 4.57% | 5.79% | 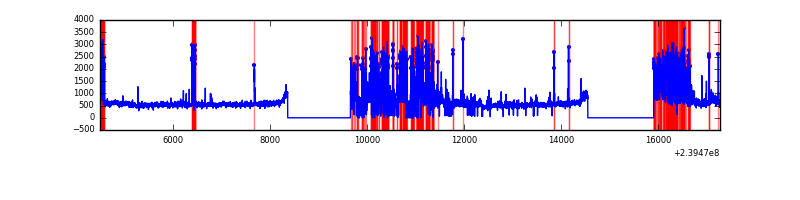 |
Top three noisy pixels from each quadrant. If the there are fewer than three noisy pixels in the level2.evt file, extra rows are filled as -1
| Pixel properties | Quadrant properties | ||||||
|---|---|---|---|---|---|---|---|
| Quadrant | DetID | PixID | Counts | Sigma | Mean | Median | Sigma |
| A | 8 | 15 | 442285 | 1783.62 | 1237 | 1216 | 247.3 |
| A | 14 | 111 | 23010 | 88.13 | 1237 | 1216 | 247.3 |
| A | 0 | 226 | 11297 | 40.77 | 1237 | 1216 | 247.3 |
| B | 4 | 239 | 52780 | 220.74 | 1253 | 1226 | 233.6 |
| B | 0 | 219 | 36234 | 149.89 | 1253 | 1226 | 233.6 |
| B | 0 | 214 | 32467 | 133.76 | 1253 | 1226 | 233.6 |
| C | 13 | 61 | 9006 | 27.2 | 1239 | 1247 | 285.2 |
| C | 14 | 234 | 3670 | 8.5 | 1239 | 1247 | 285.2 |
| C | 8 | 222 | 3642 | 8.4 | 1239 | 1247 | 285.2 |
| D | 12 | 233 | 1395903 | 4917.67 | 1181 | 1154 | 283.6 |
| D | 1 | 52 | 873508 | 3075.78 | 1181 | 1154 | 283.6 |
| D | 8 | 195 | 854894 | 3010.15 | 1181 | 1154 | 283.6 |
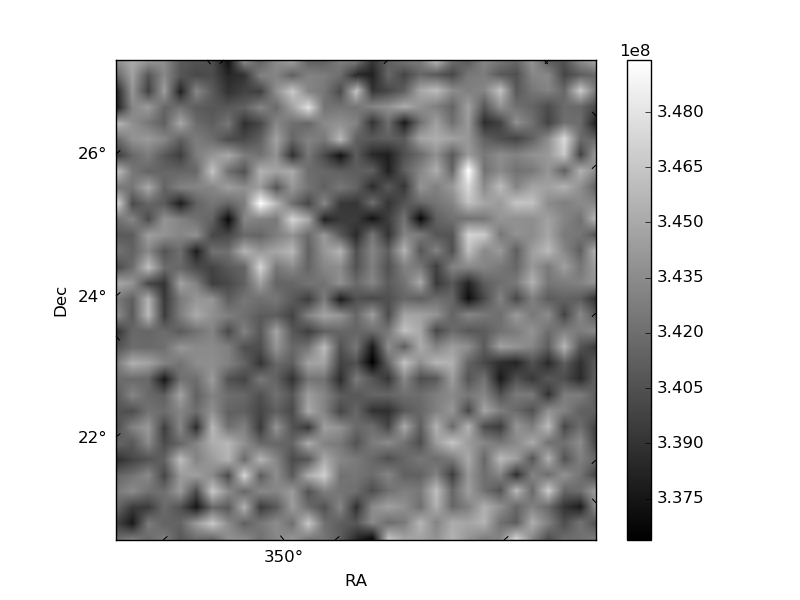
Histogram calculated using DETX and DETY for each event in the final _common_clean file
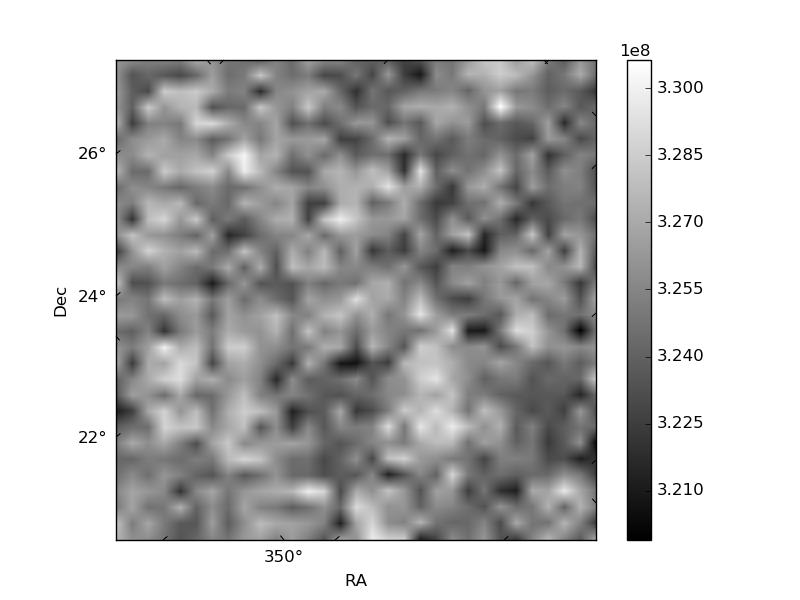
| Quadrant A | 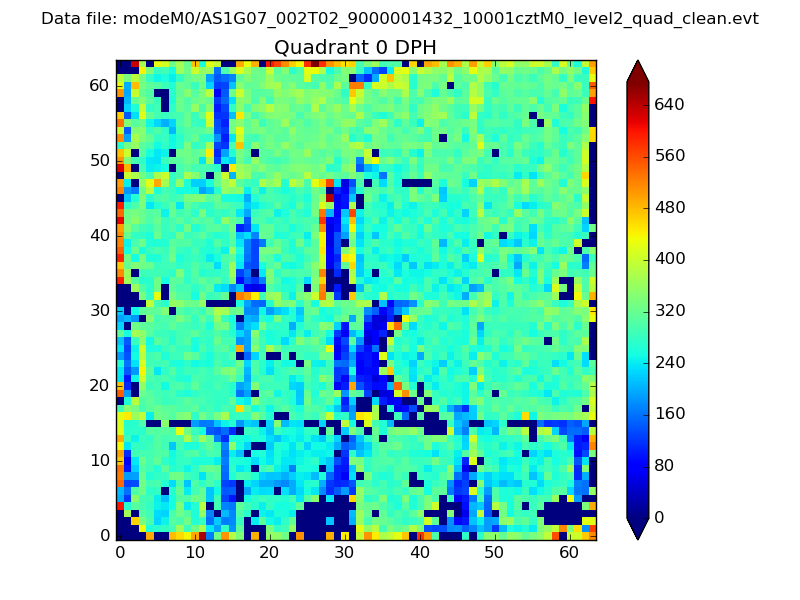 |
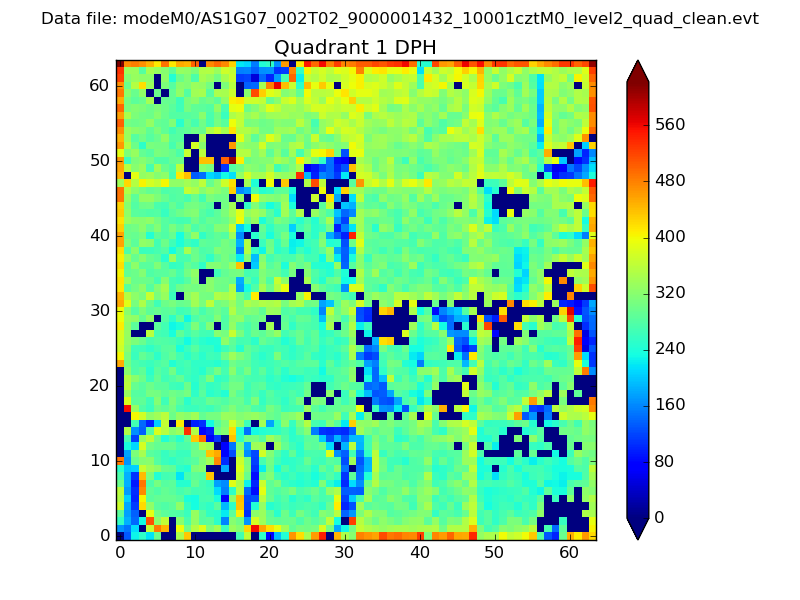 |
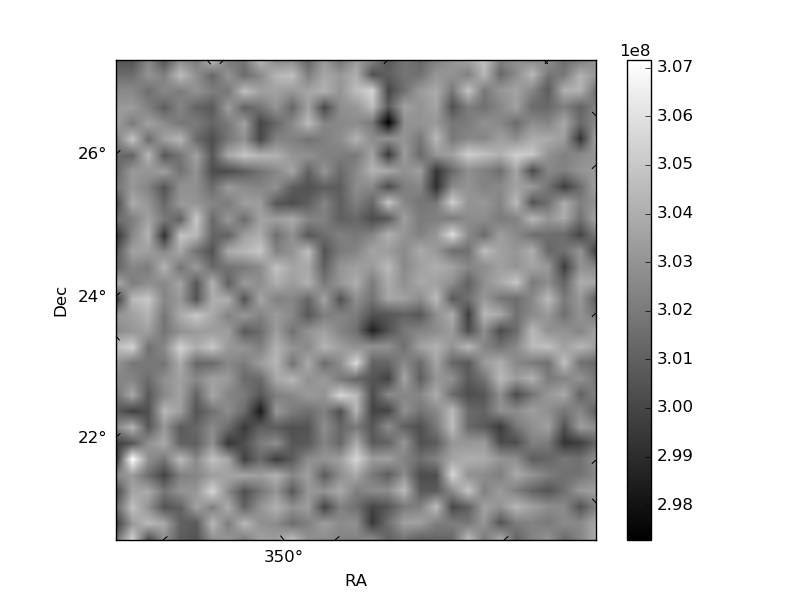
Quadrant B |
|---|---|---|---|
| Quadrant D | 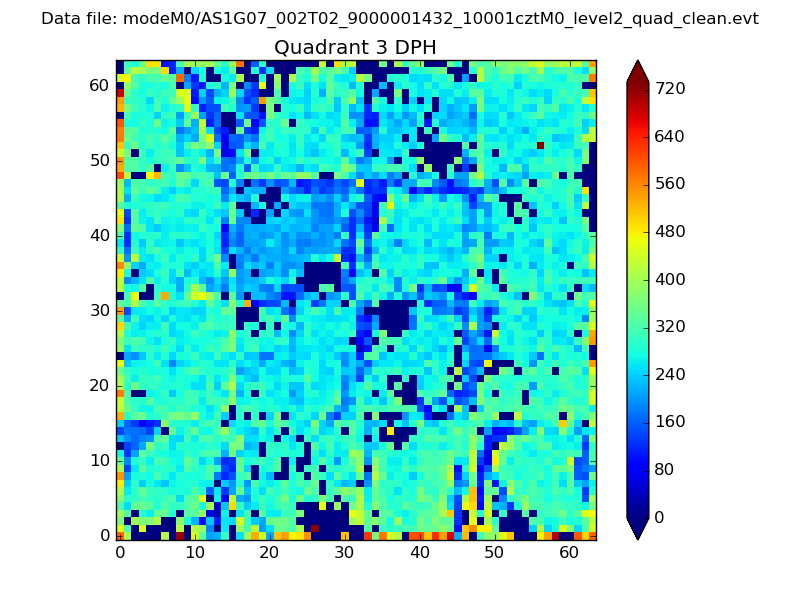 |
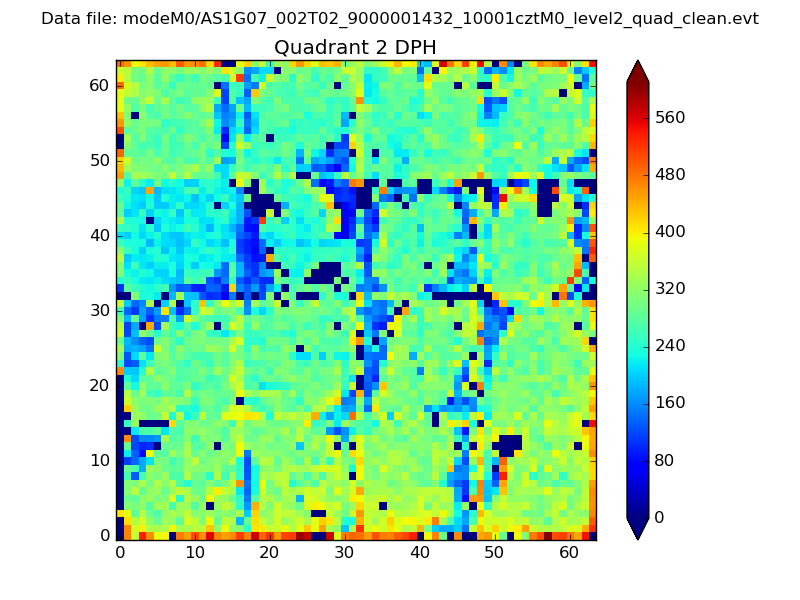 |
Quadrant C |
| Plot type | Count rate plots | Images |
|---|---|---|
| Comparison with Poisson distribution Blue bars denote a histogram of data divided into 1 sec bins. Red curve is a Poisson curve with rate = median count rate of data. |
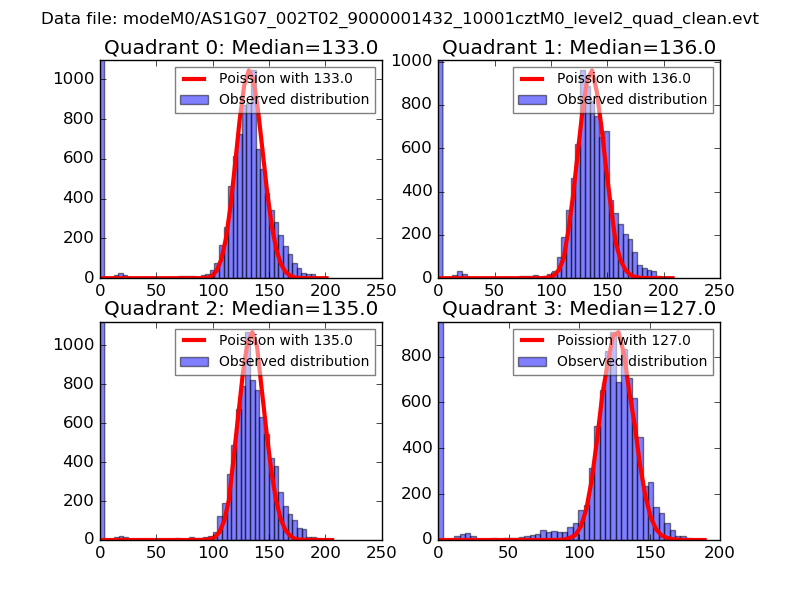 |
 |
| Quadrant-wise count rates Data is divided into 100 sec bins |
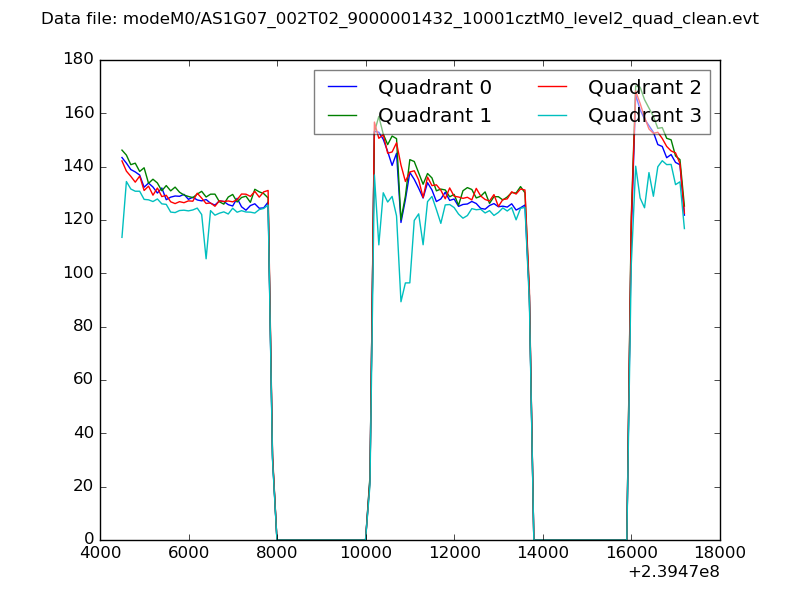 |
|
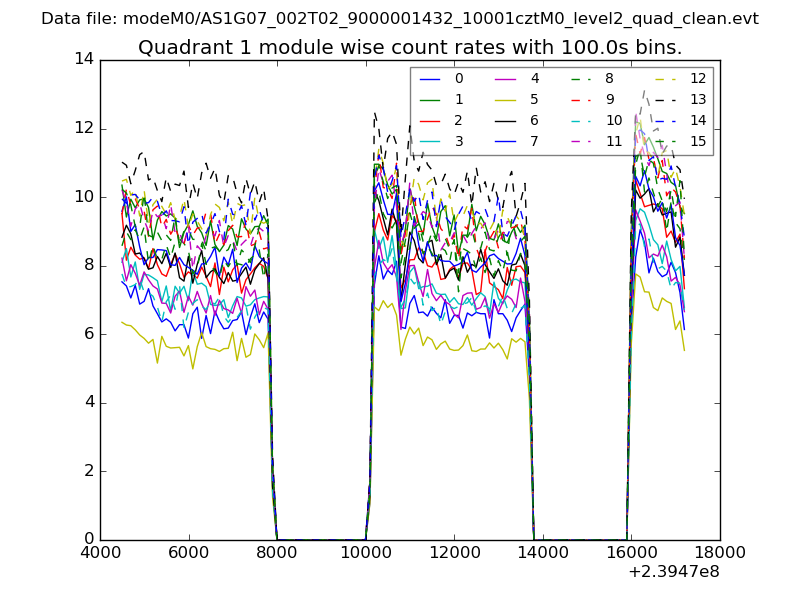
| Module-wise count rates for Quadrant A Data is divided into 100 sec bins |
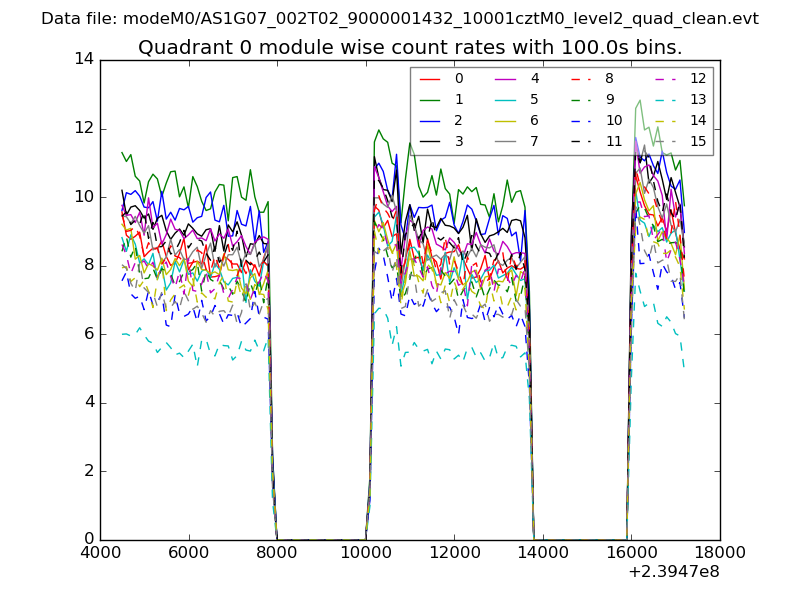 |
 |
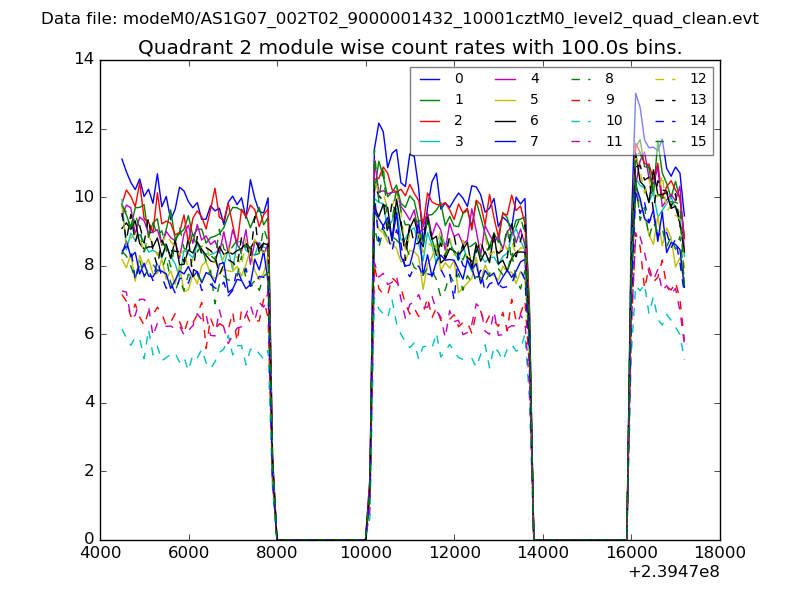
| Module-wise count rates for Quadrant B Data is divided into 100 sec bins |
 |
 |
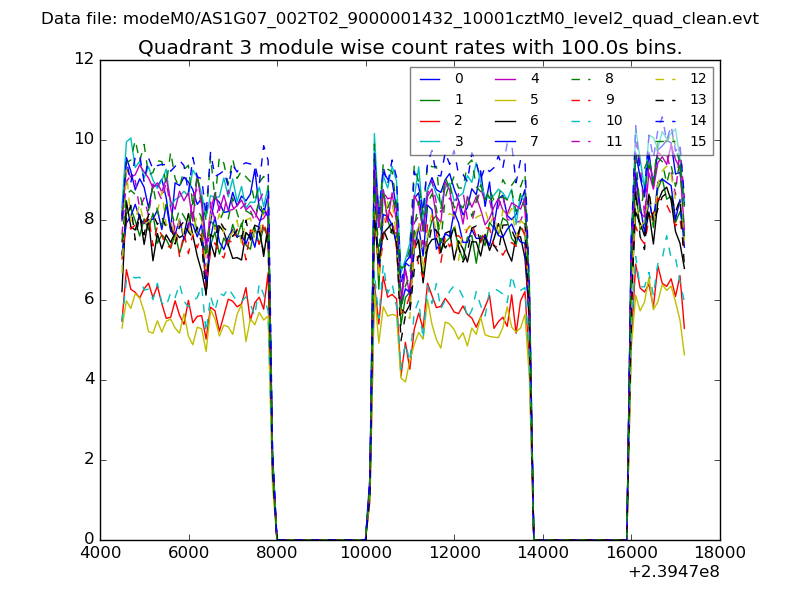
| Module-wise count rates for Quadrant C Data is divided into 100 sec bins |
 |
 |
| Module-wise count rates for Quadrant D Data is divided into 100 sec bins |
 |
 |
| Parameter | Plot |
|---|---|
| CZT HV Monitor | 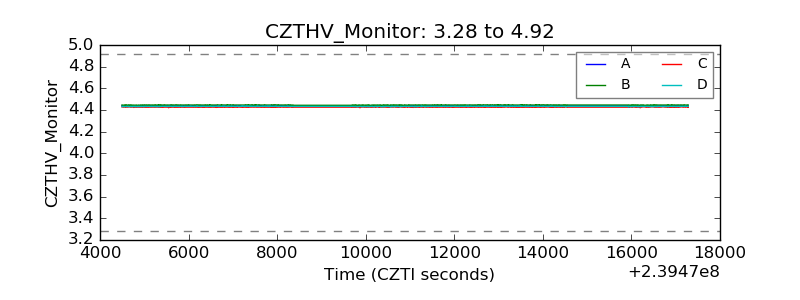 |
| D_VDD | 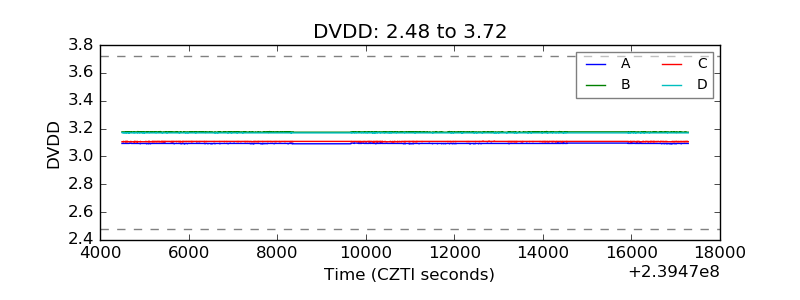 |
| Temperature 1 | 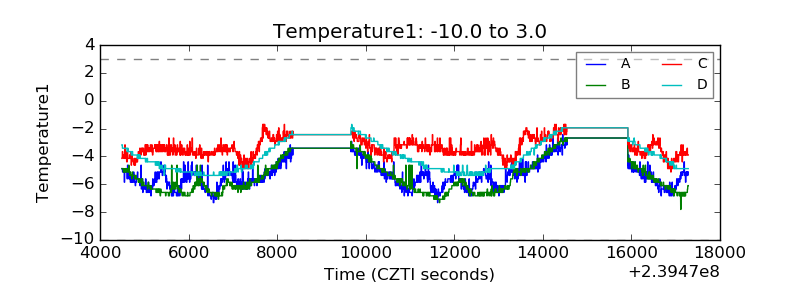 |
| Veto HV Monitor | 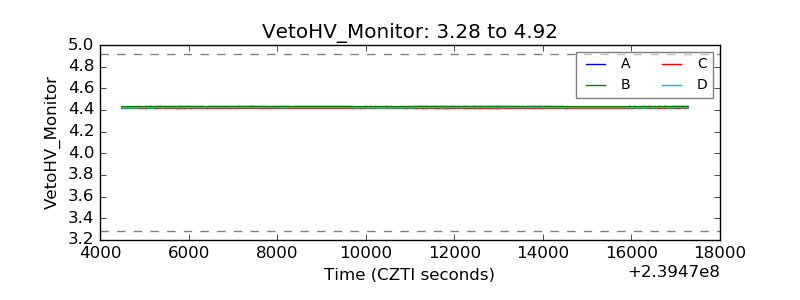 |
| Veto LLD | 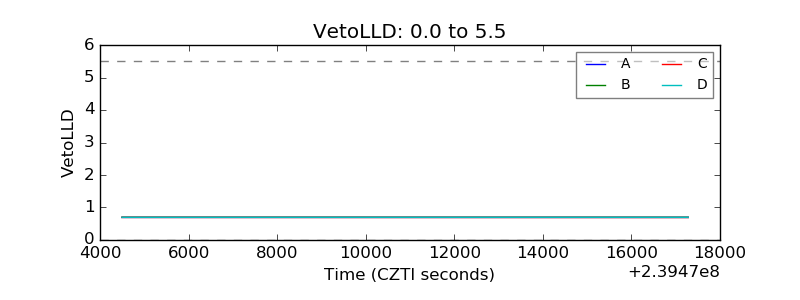 |
| Alpha Counter | 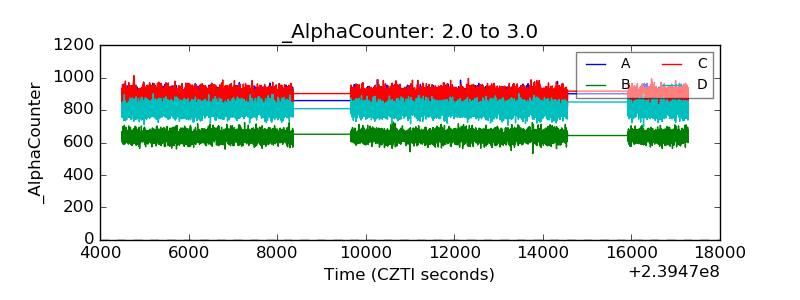 |
| _CPM_Rate | 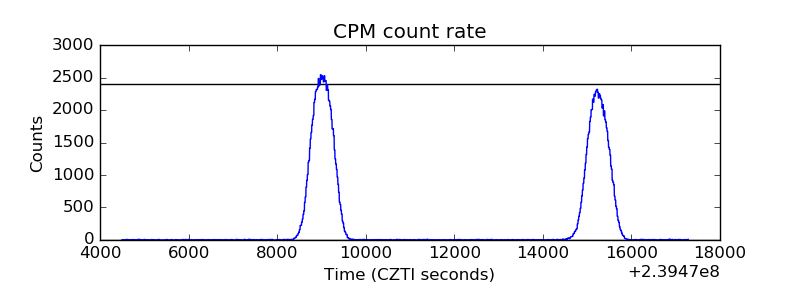 |
| CZT Counter | 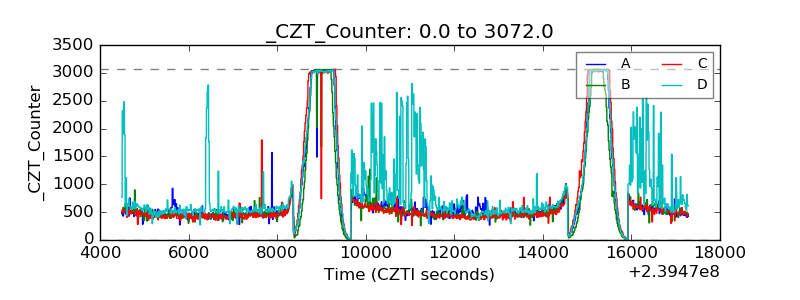 |
| +2.5 Volts monitor |  |
| +5 Volts monitor |  |
| _ROLL_ROT | 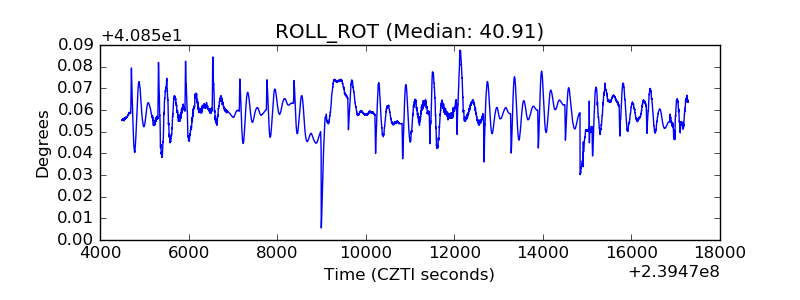 |
| _Roll_DEC | 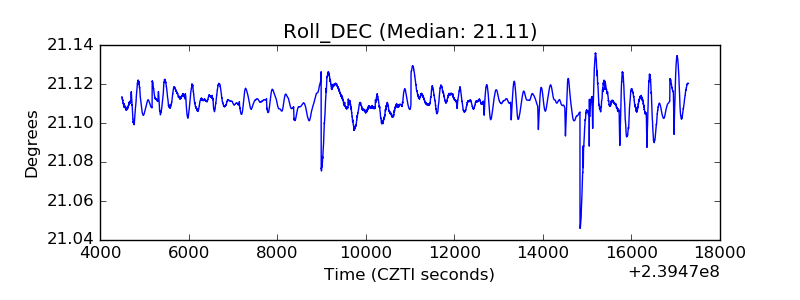 |
| _Roll_RA |  |
| Veto Counter | 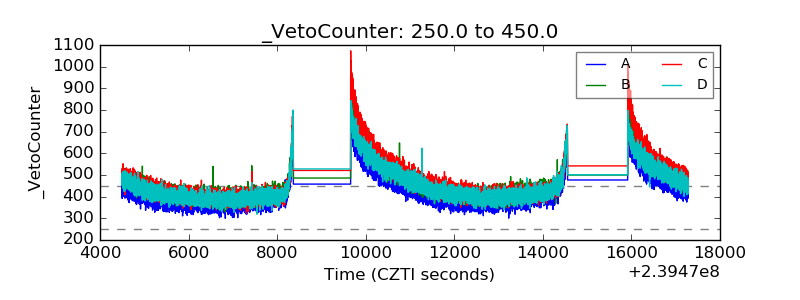 |