| Param | Original file | Final file |
|---|---|---|
| Filename | modeM0/AS1G07_002T02_9000001432_10004cztM0_level2.evt | modeM0/AS1G07_002T02_9000001432_10004cztM0_level2_quad_clean.evt |
| Size (bytes) | 482,238,720 | 86,339,520 |
| Size | 459.9 MB | 82.3 MB |
| Events in quadrant A | 3,620,964 | 535,947 |
| Events in quadrant B | 3,145,741 | 554,789 |
| Events in quadrant C | 3,007,381 | 547,315 |
| Events in quadrant D | 4,382,282 | 516,416 |
| Mode SS | |||
|---|---|---|---|
| Quadrant | BADHDUFLAG | Total packets | Discarded packets |
| A | 0 | 140 | 6 |
| B | 0 | 140 | 2 |
| C | 0 | 140 | 4 |
| D | 0 | 140 | 6 |
| Mode M0 | |||
|---|---|---|---|
| Quadrant | BADHDUFLAG | Total packets | Discarded packets |
| A | 0 | 15879 | 654 |
| B | 0 | 14369 | 469 |
| C | 0 | 14098 | 456 |
| D | 0 | 18203 | 677 |
| Mode M9 | |||
|---|---|---|---|
| Quadrant | BADHDUFLAG | Total packets | Discarded packets |
| A | 0 | 17 | 0 |
| B | 0 | 17 | 0 |
| C | 0 | 17 | 0 |
| D | 0 | 18 | 0 |
| Quadrant | Total seconds | Saturated seconds | Saturation percentage |
|---|---|---|---|
| A | 6583 | 135 | 2.050737% |
| B | 6593 | 78 | 1.183073% |
| C | 6601 | 41 | 0.621118% |
| D | 6574 | 100 | 1.521144% |
Noise dominated data is calculated using 1-second bins in cleaned event files. If a bin has >2000 counts, and if more than 50% of those come from <1% of pixels, then it is considered to be noise-dominated and hence unusable.
| Quadrant | # 1 sec bins | Bins with >0 counts | Bins with >2000 counts | High rate bins dominated by noise | Noise dominated (total time) | Noise dominated (detector-on time) | Marked lightcurve |
|---|---|---|---|---|---|---|---|
| A | 7674 | 6784 | 51 | 51 | 0.66% | 0.75% | 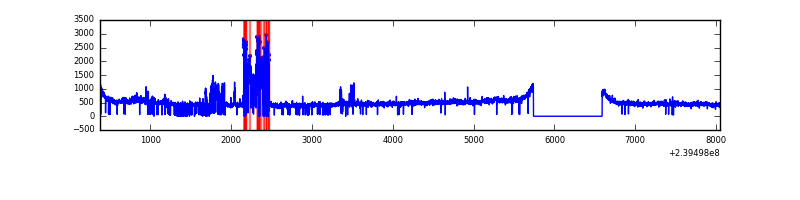 |
| B | 7674 | 6792 | 0 | 0 | 0.00% | 0.00% | 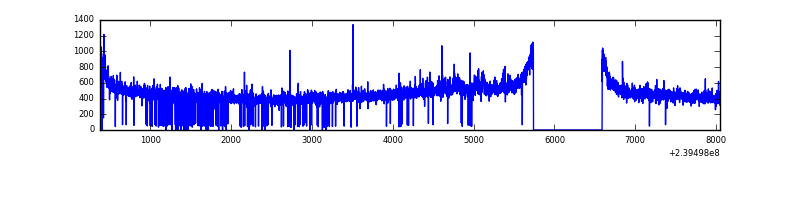 |
| C | 7674 | 6801 | 0 | 0 | 0.00% | 0.00% | 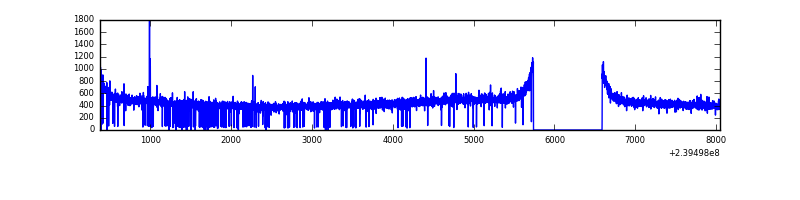 |
| D | 7674 | 6787 | 37 | 37 | 0.48% | 0.55% | 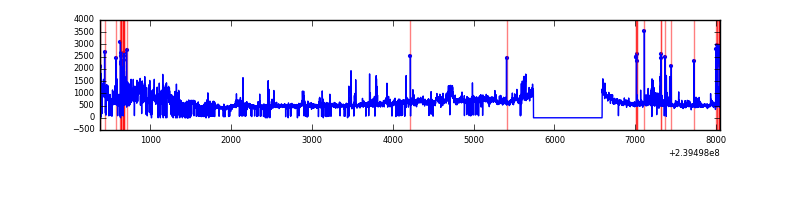 |
Top three noisy pixels from each quadrant. If the there are fewer than three noisy pixels in the level2.evt file, extra rows are filled as -1
| Pixel properties | Quadrant properties | ||||||
|---|---|---|---|---|---|---|---|
| Quadrant | DetID | PixID | Counts | Sigma | Mean | Median | Sigma |
| A | 8 | 15 | 614876 | 3834.02 | 780 | 765 | 160.2 |
| A | 13 | 251 | 7315 | 40.89 | 780 | 765 | 160.2 |
| A | 0 | 226 | 7102 | 39.56 | 780 | 765 | 160.2 |
| B | 0 | 219 | 55699 | 362.73 | 788 | 770 | 151.4 |
| B | 12 | 111 | 17387 | 109.73 | 788 | 770 | 151.4 |
| B | 11 | 111 | 14125 | 88.19 | 788 | 770 | 151.4 |
| C | 5 | 128 | 10642 | 54.73 | 768 | 771 | 180.3 |
| C | 13 | 61 | 5699 | 27.32 | 768 | 771 | 180.3 |
| C | 14 | 67 | 3498 | 15.12 | 768 | 771 | 180.3 |
| D | 8 | 195 | 528932 | 2797.78 | 754 | 735 | 188.8 |
| D | 2 | 16 | 491095 | 2597.36 | 754 | 735 | 188.8 |
| D | 1 | 52 | 235623 | 1244.17 | 754 | 735 | 188.8 |
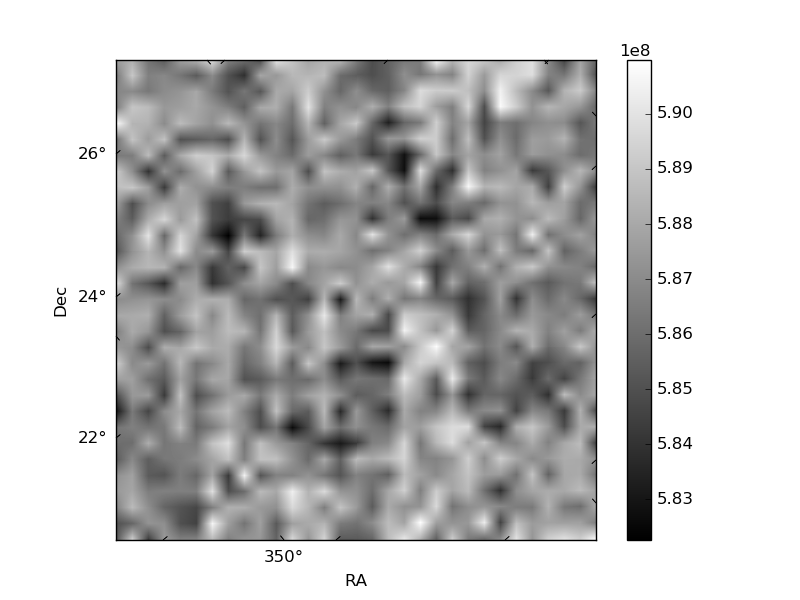
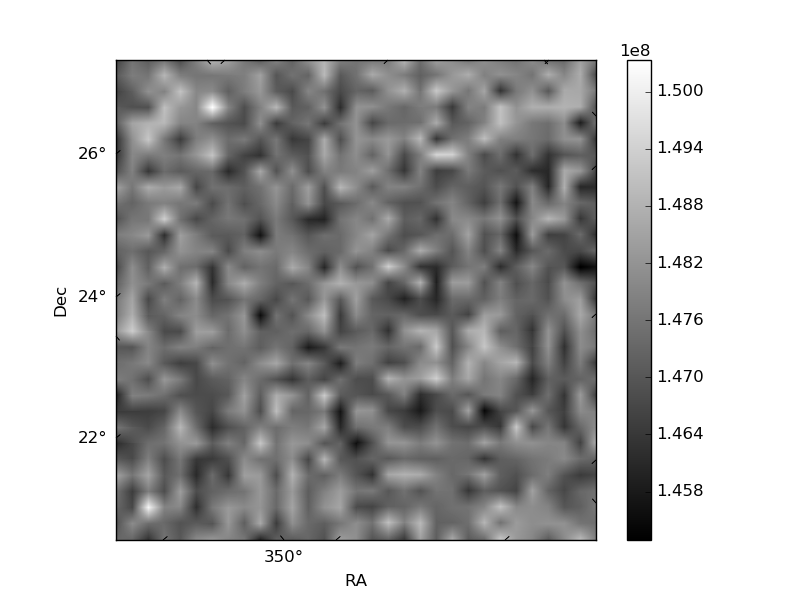
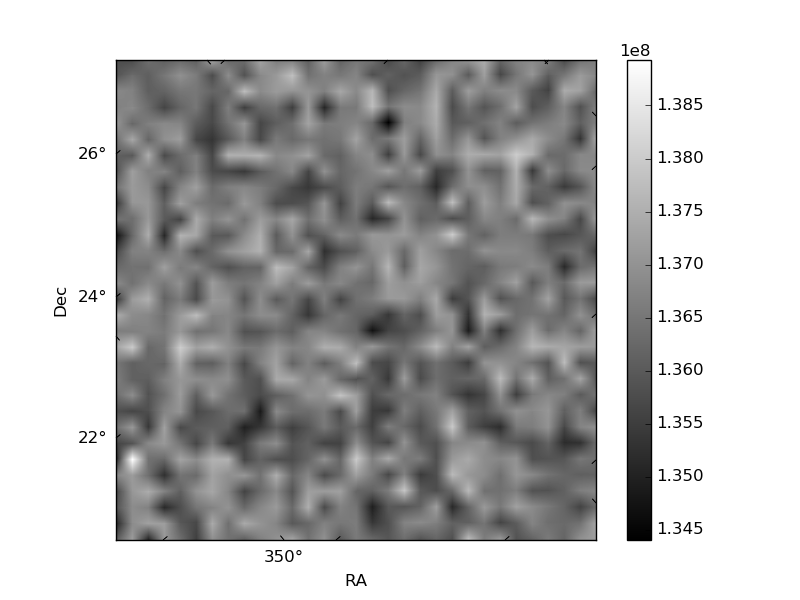
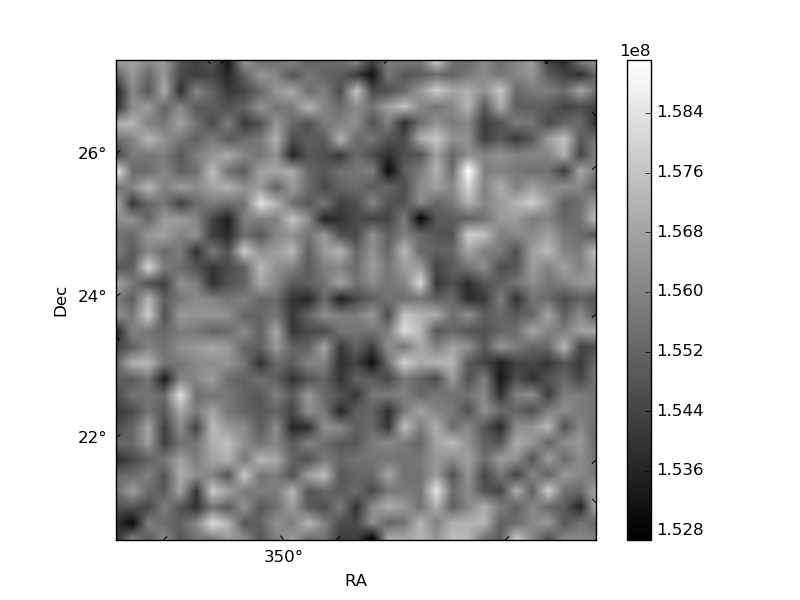
Histogram calculated using DETX and DETY for each event in the final _common_clean file
| Quadrant A | 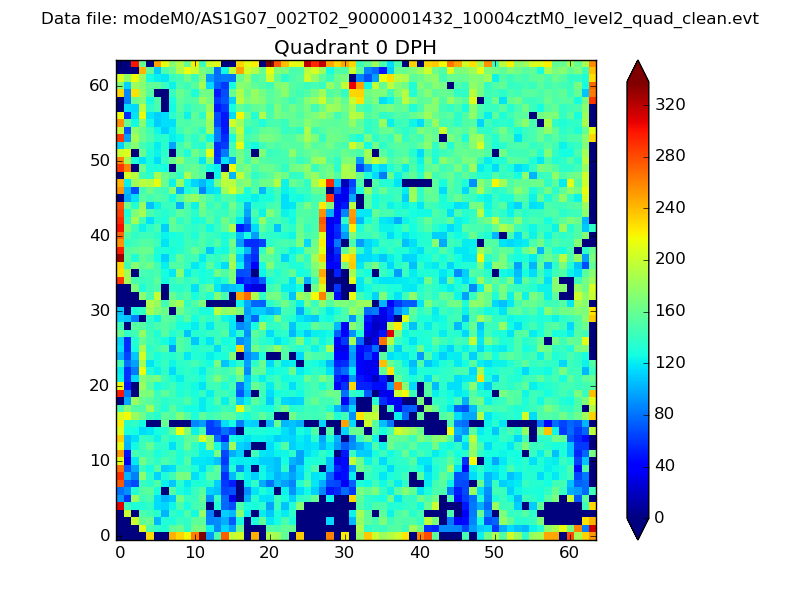 |
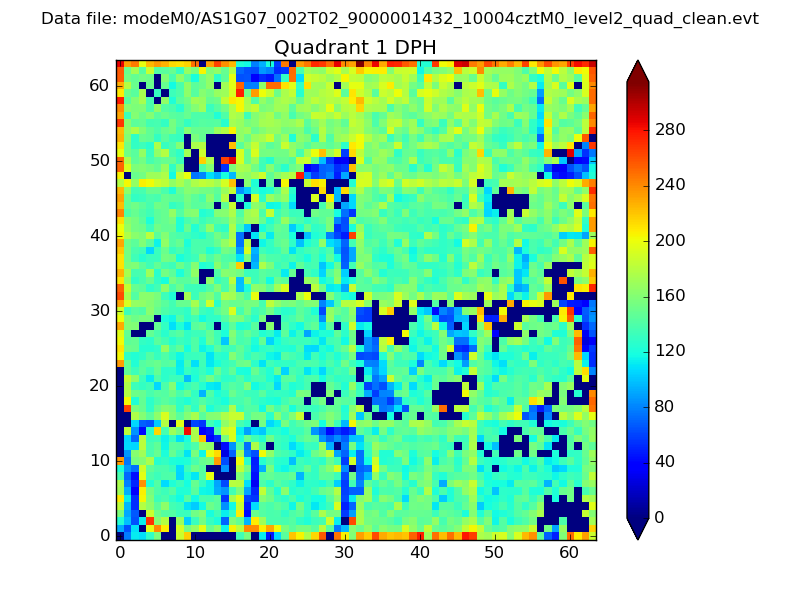 |
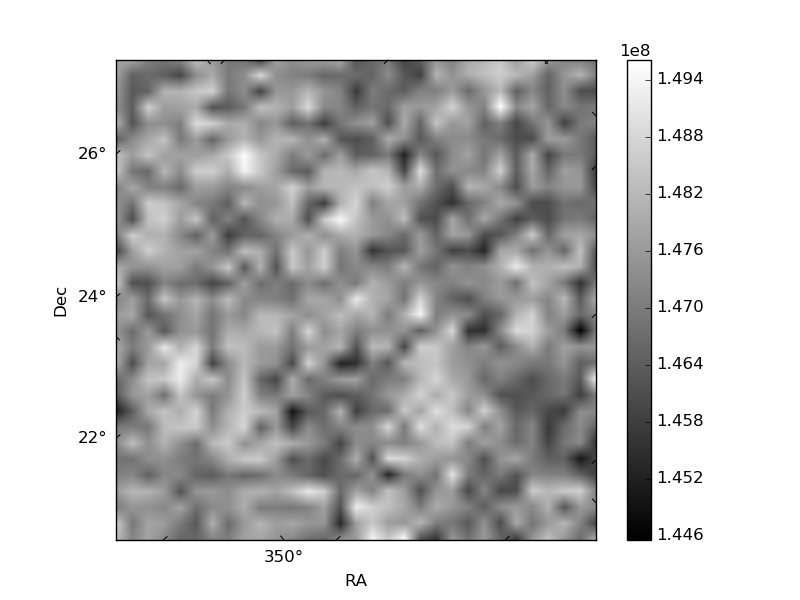
Quadrant B |
|---|---|---|---|
| Quadrant D | 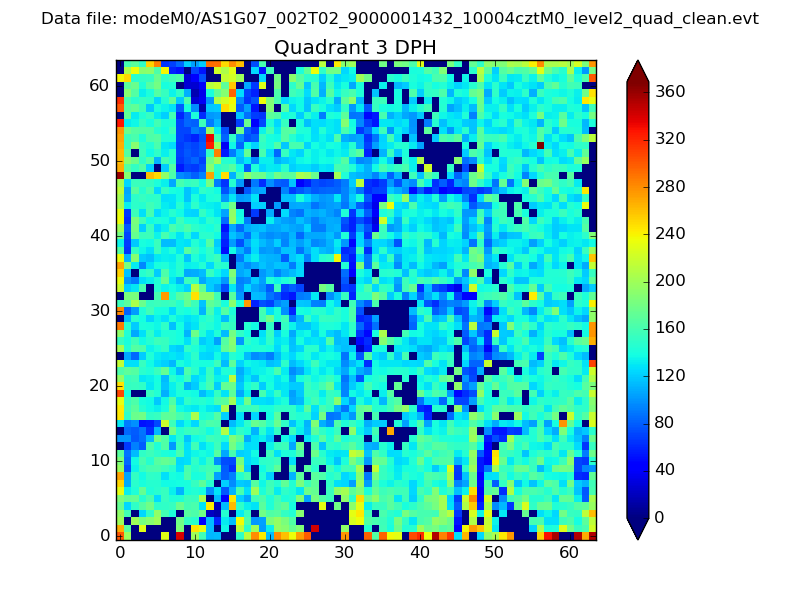 |
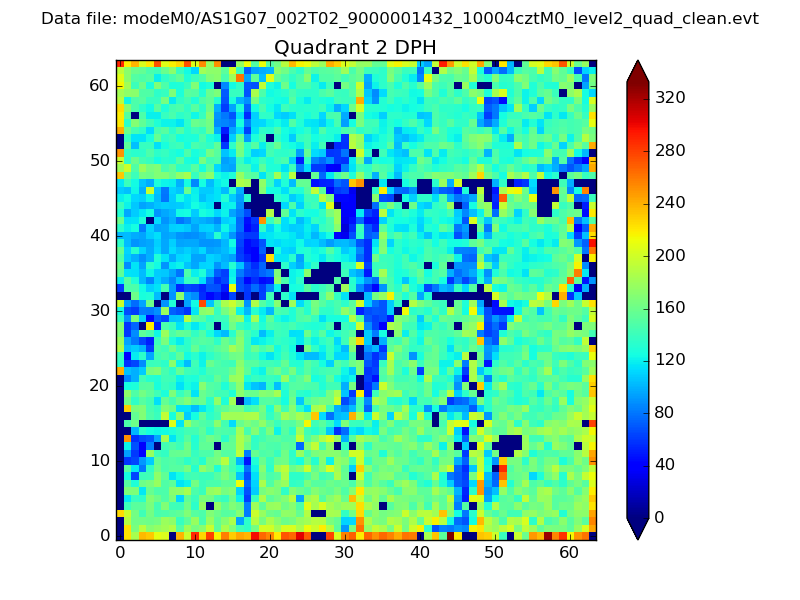 |
Quadrant C |
| Plot type | Count rate plots | Images |
|---|---|---|
| Comparison with Poisson distribution Blue bars denote a histogram of data divided into 1 sec bins. Red curve is a Poisson curve with rate = median count rate of data. |
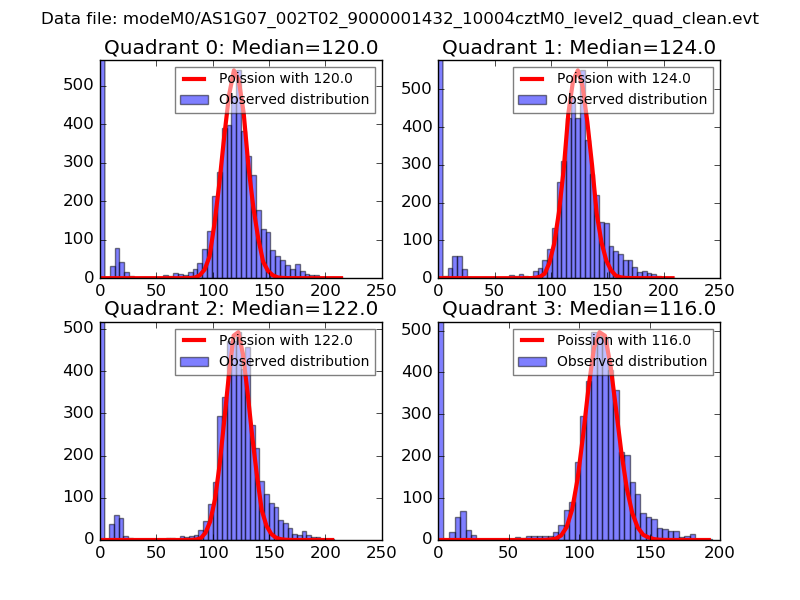 |
 |
| Quadrant-wise count rates Data is divided into 100 sec bins |
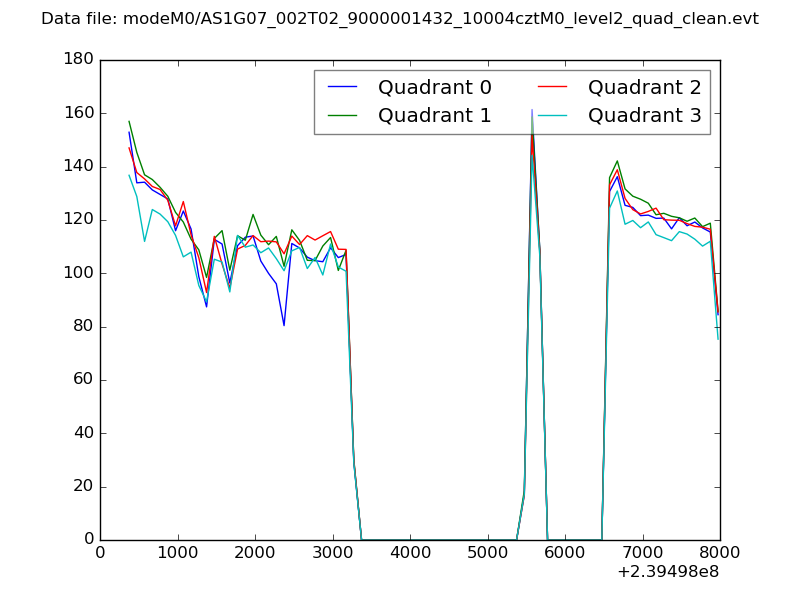 |
|
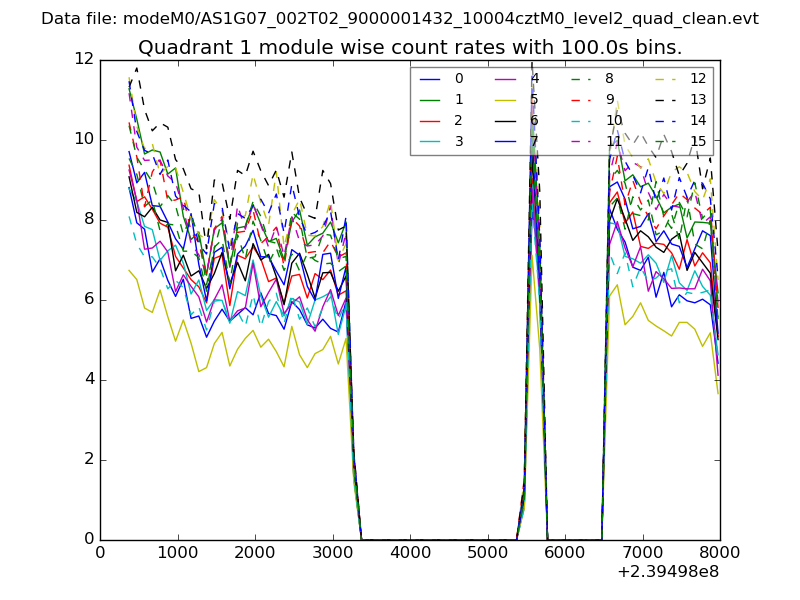
| Module-wise count rates for Quadrant A Data is divided into 100 sec bins |
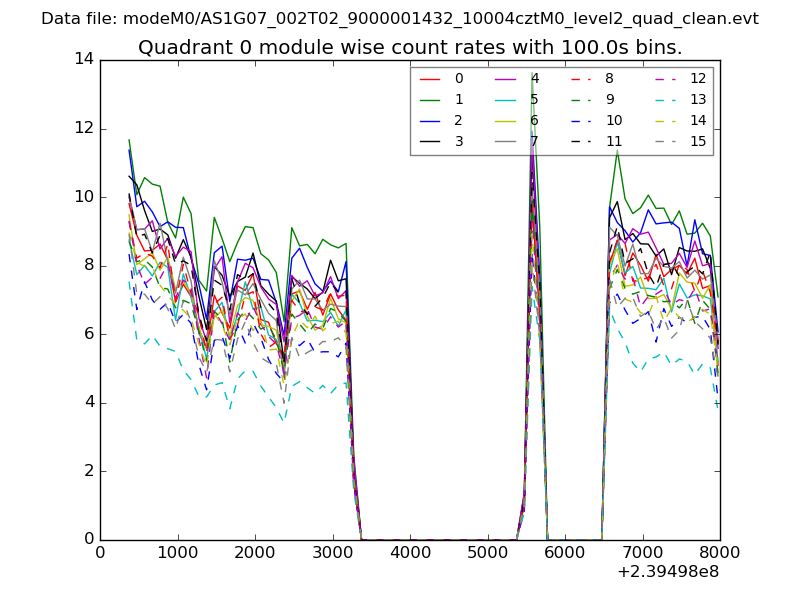 |
 |
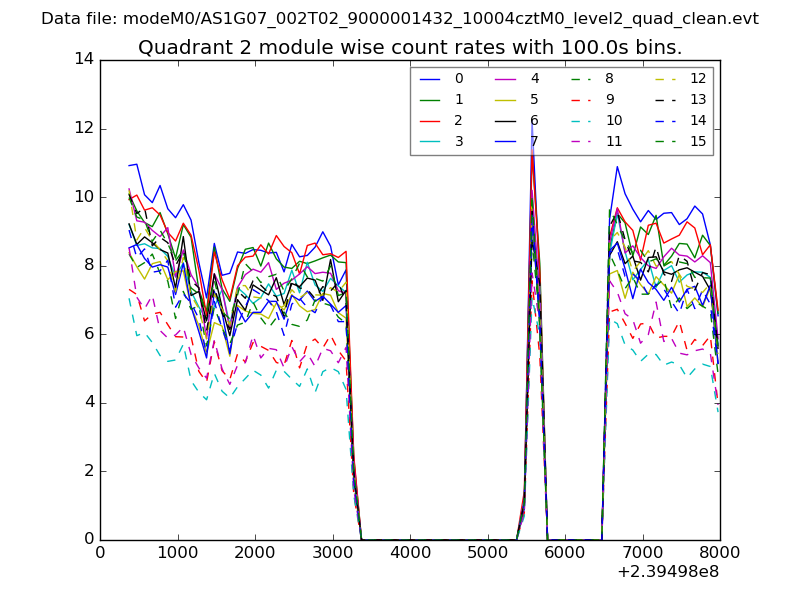
| Module-wise count rates for Quadrant B Data is divided into 100 sec bins |
 |
 |
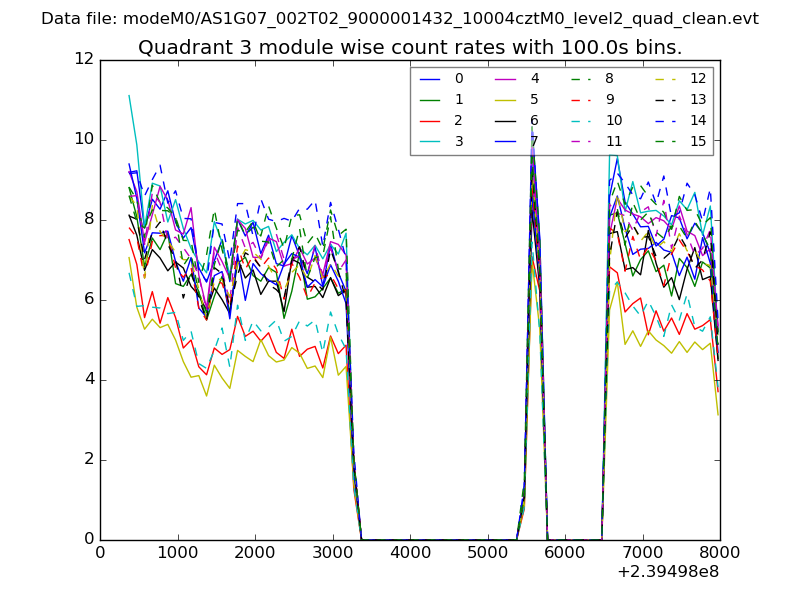
| Module-wise count rates for Quadrant C Data is divided into 100 sec bins |
 |
 |
| Module-wise count rates for Quadrant D Data is divided into 100 sec bins |
 |
 |
| Parameter | Plot |
|---|---|
| CZT HV Monitor |  |
| D_VDD | 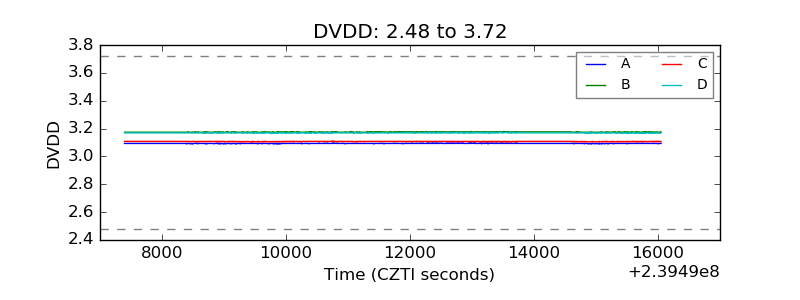 |
| Temperature 1 | 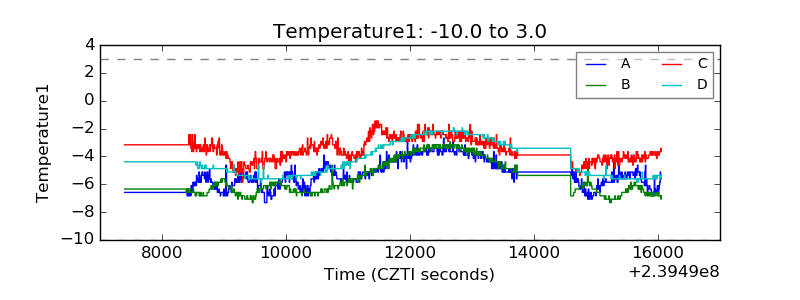 |
| Veto HV Monitor | 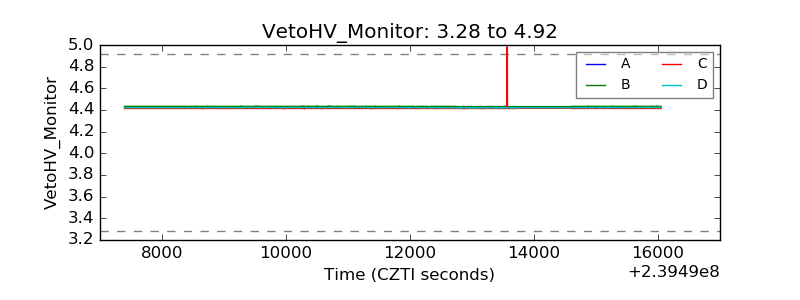 |
| Veto LLD | 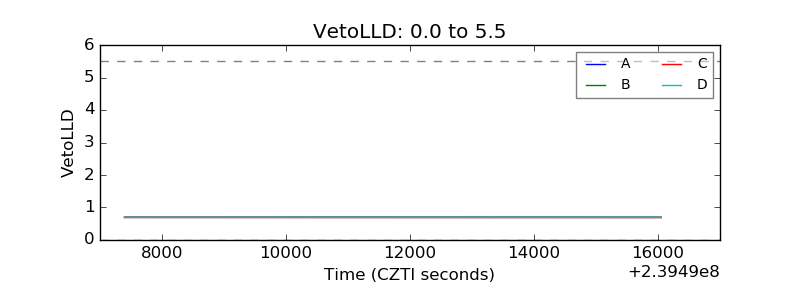 |
| Alpha Counter | 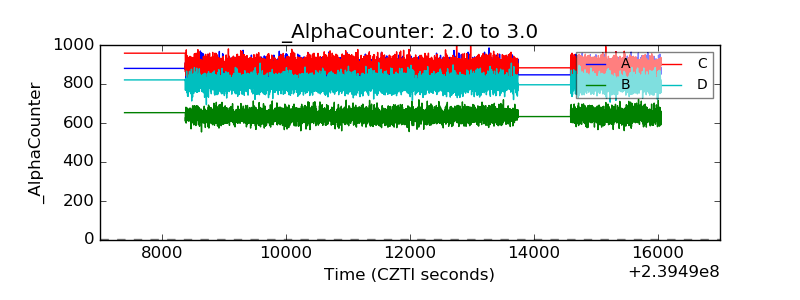 |
| _CPM_Rate | 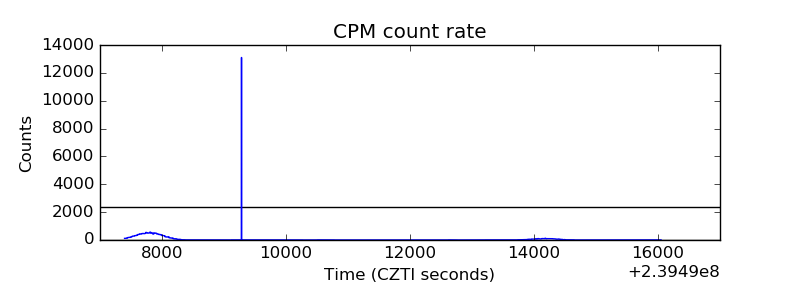 |
| CZT Counter | 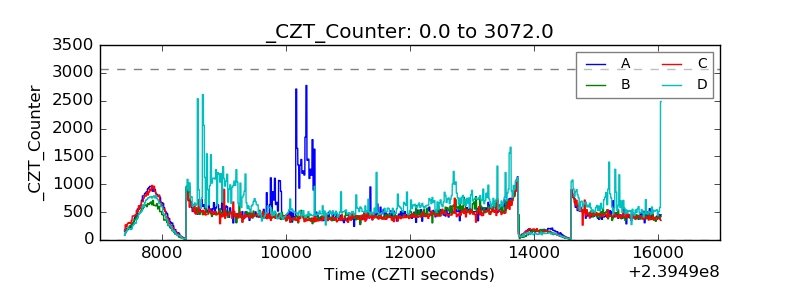 |
| +2.5 Volts monitor |  |
| +5 Volts monitor |  |
| _ROLL_ROT |  |
| _Roll_DEC | 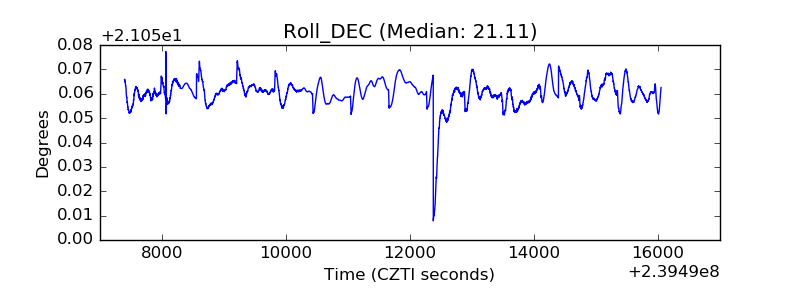 |
| _Roll_RA | 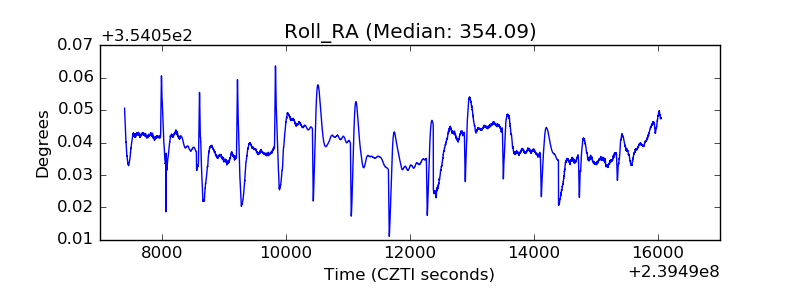 |
| Veto Counter | 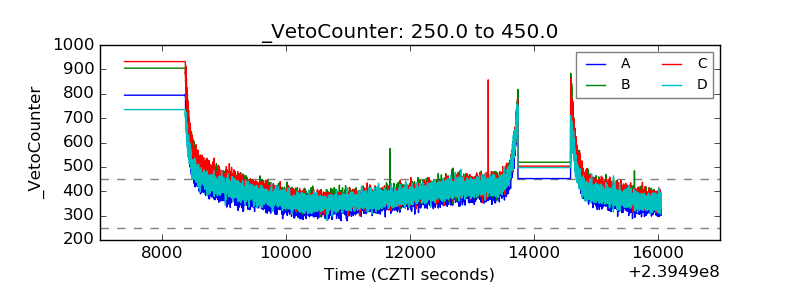 |