| Param | Original file | Final file |
|---|---|---|
| Filename | modeM0/AS1G07_002T02_9000001432_10006cztM0_level2.evt | modeM0/AS1G07_002T02_9000001432_10006cztM0_level2_quad_clean.evt |
| Size (bytes) | 47,053,440 | 9,964,800 |
| Size | 44.9 MB | 9.5 MB |
| Events in quadrant A | 358,744 | 63,099 |
| Events in quadrant B | 390,318 | 72,946 |
| Events in quadrant C | 356,705 | 68,874 |
| Events in quadrant D | 268,512 | 40,320 |
| Mode SS | |||
|---|---|---|---|
| Quadrant | BADHDUFLAG | Total packets | Discarded packets |
| A | 0 | 169 | 147 |
| B | 0 | 167 | 153 |
| C | 0 | 170 | 152 |
| D | 0 | 170 | 152 |
| Mode M0 | |||
|---|---|---|---|
| Quadrant | BADHDUFLAG | Total packets | Discarded packets |
| A | 0 | 17511 | 16015 |
| B | 0 | 17345 | 15689 |
| C | 0 | 17065 | 15520 |
| D | 0 | 24543 | 23478 |
| Mode M9 | |||
|---|---|---|---|
| Quadrant | BADHDUFLAG | Total packets | Discarded packets |
| A | 0 | 6 | 4 |
| B | 0 | 6 | 4 |
| C | 0 | 6 | 5 |
| D | 0 | 6 | 4 |
| Quadrant | Total seconds | Saturated seconds | Saturation percentage |
|---|---|---|---|
| A | 706 | 10 | 1.416431% |
| B | 792 | 17 | 2.146465% |
| C | 752 | 5 | 0.664894% |
| D | 415 | 3 | 0.722892% |
Noise dominated data is calculated using 1-second bins in cleaned event files. If a bin has >2000 counts, and if more than 50% of those come from <1% of pixels, then it is considered to be noise-dominated and hence unusable.
| Quadrant | # 1 sec bins | Bins with >0 counts | Bins with >2000 counts | High rate bins dominated by noise | Noise dominated (total time) | Noise dominated (detector-on time) | Marked lightcurve |
|---|---|---|---|---|---|---|---|
| A | 9067 | 1238 | 0 | 0 | 0.00% | 0.00% | 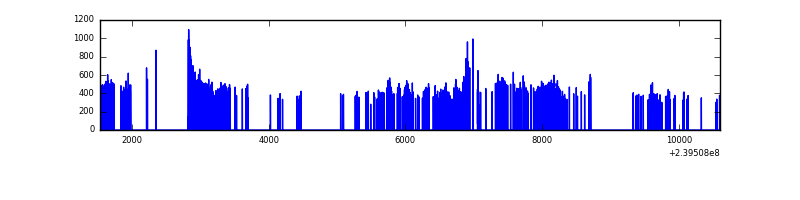 |
| B | 9047 | 1393 | 0 | 0 | 0.00% | 0.00% | 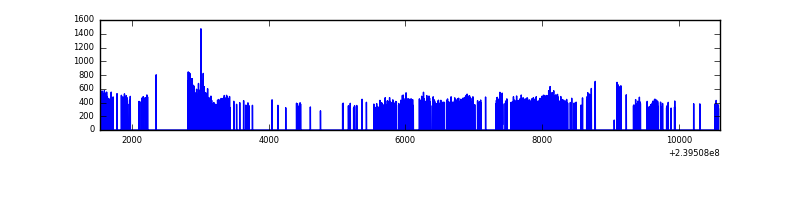 |
| C | 9069 | 1327 | 0 | 0 | 0.00% | 0.00% | 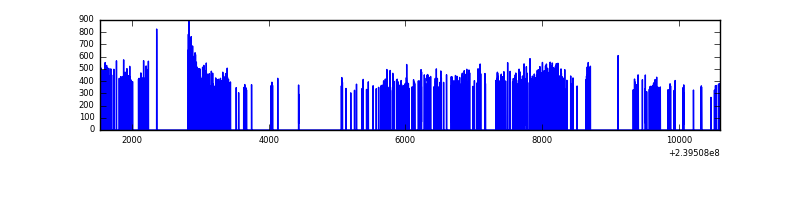 |
| D | 9067 | 745 | 0 | 0 | 0.00% | 0.00% | 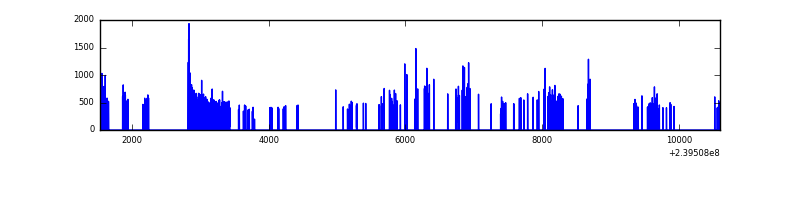 |
Top three noisy pixels from each quadrant. If the there are fewer than three noisy pixels in the level2.evt file, extra rows are filled as -1
| Pixel properties | Quadrant properties | ||||||
|---|---|---|---|---|---|---|---|
| Quadrant | DetID | PixID | Counts | Sigma | Mean | Median | Sigma |
| A | 8 | 15 | 27093 | 1373.65 | 86 | 84 | 19.7 |
| A | 0 | 226 | 751 | 33.92 | 86 | 84 | 19.7 |
| A | 12 | 194 | 709 | 31.79 | 86 | 84 | 19.7 |
| B | 10 | 252 | 4782 | 218.74 | 98 | 95 | 21.4 |
| B | 0 | 187 | 2497 | 112.09 | 98 | 95 | 21.4 |
| B | 12 | 111 | 2237 | 99.95 | 98 | 95 | 21.4 |
| C | 13 | 61 | 664 | 24.36 | 91 | 91 | 23.5 |
| C | 14 | 67 | 425 | 14.2 | 91 | 91 | 23.5 |
| C | 8 | 222 | 266 | 7.44 | 91 | 91 | 23.5 |
| D | 8 | 195 | 33381 | 2377.96 | 48 | 47 | 14.0 |
| D | 2 | 16 | 18316 | 1303.26 | 48 | 47 | 14.0 |
| D | 1 | 52 | 18303 | 1302.34 | 48 | 47 | 14.0 |
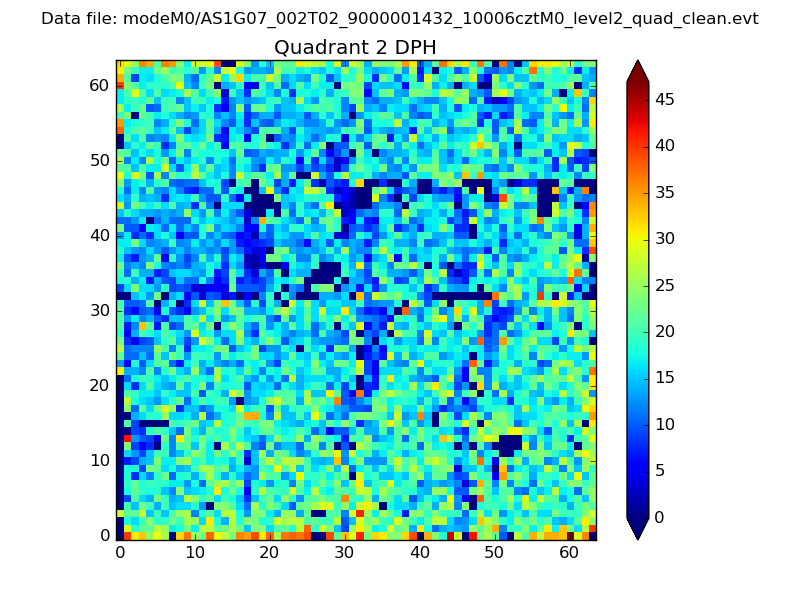
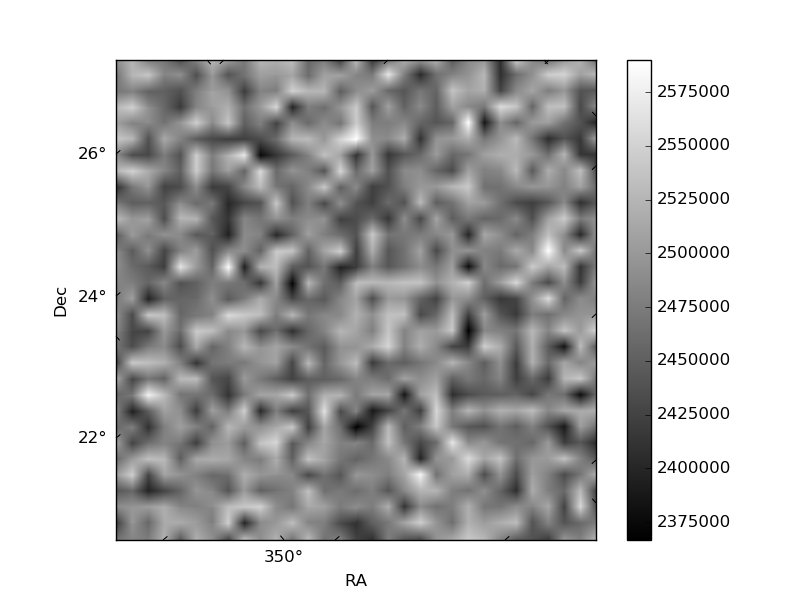
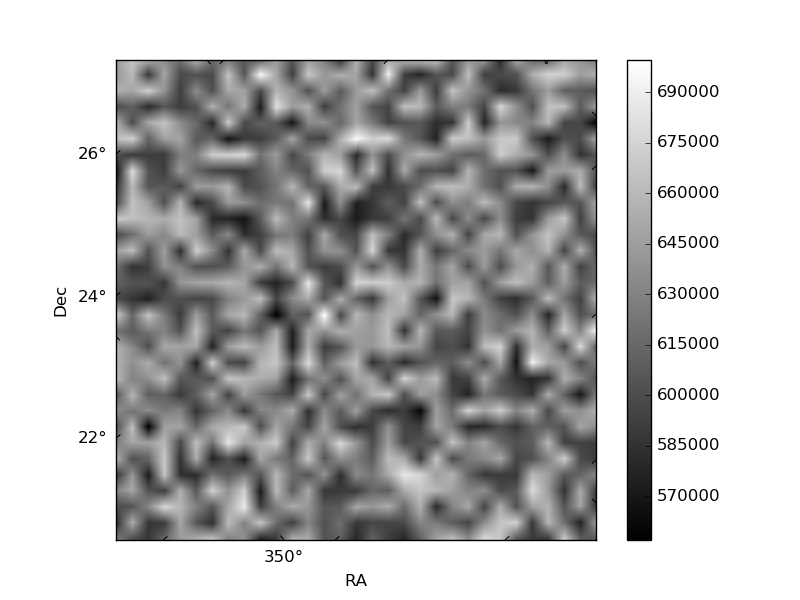
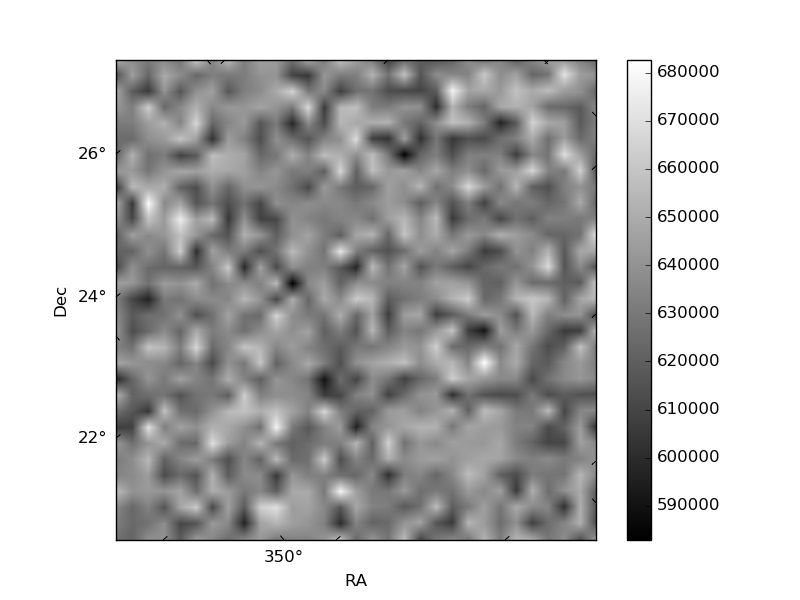
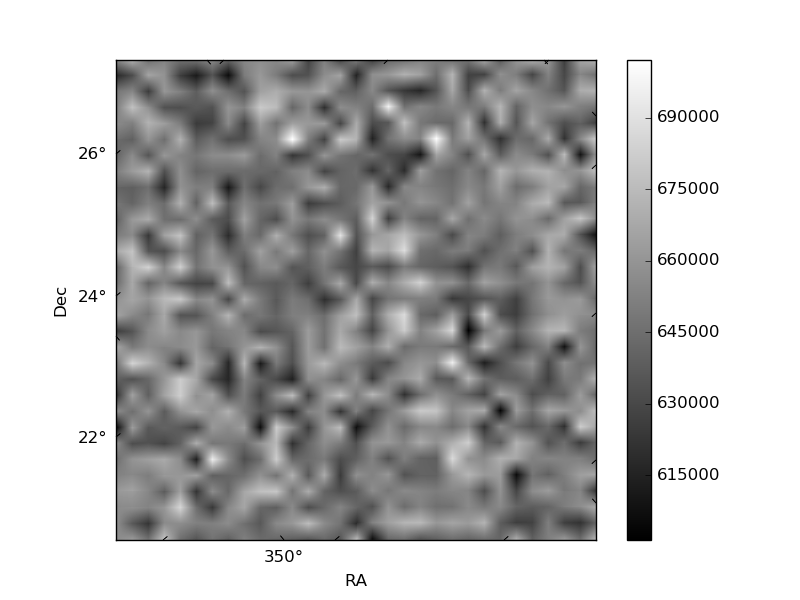
Histogram calculated using DETX and DETY for each event in the final _common_clean file
| Quadrant A | 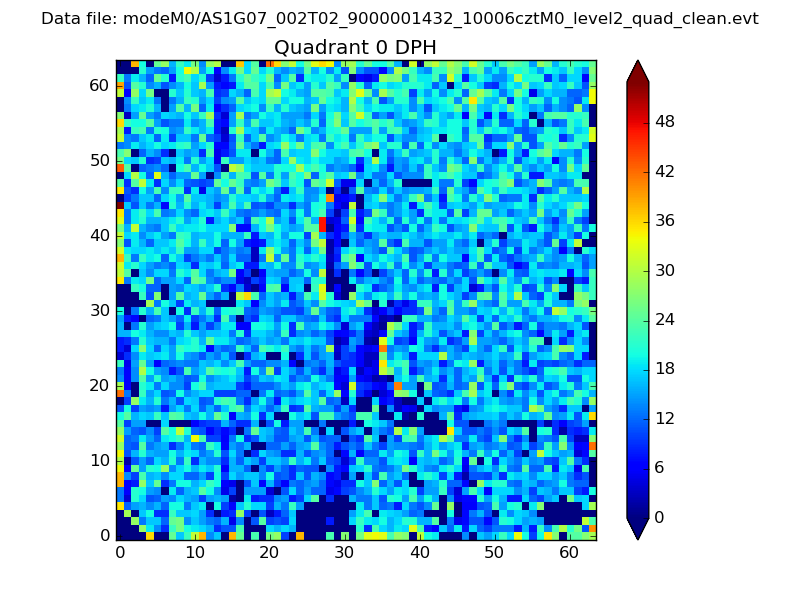 |
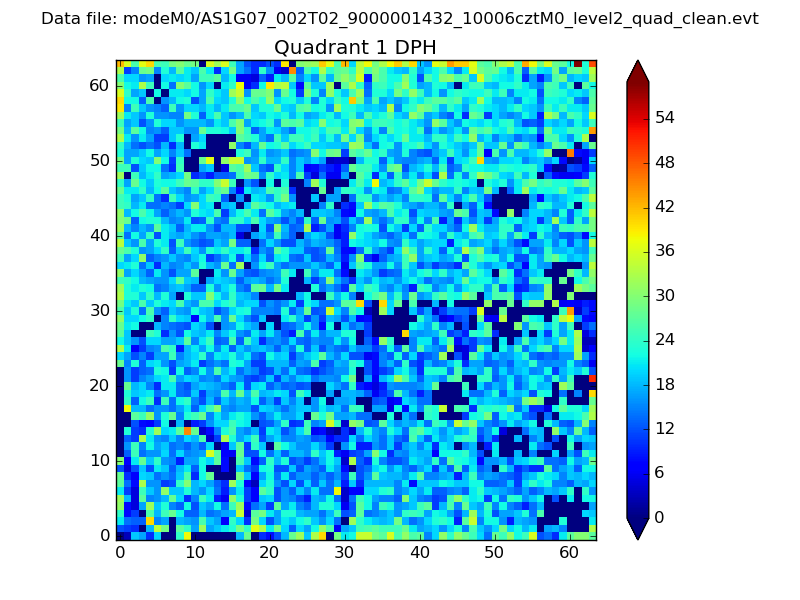 |
Quadrant B |
|---|---|---|---|
| Quadrant D | 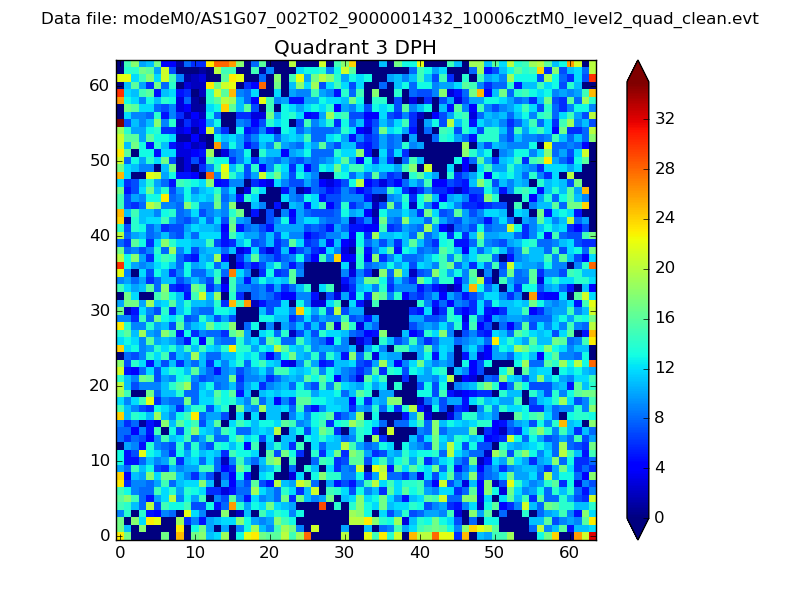 |
 |
Quadrant C |
| Plot type | Count rate plots | Images |
|---|---|---|
| Comparison with Poisson distribution Blue bars denote a histogram of data divided into 1 sec bins. Red curve is a Poisson curve with rate = median count rate of data. |
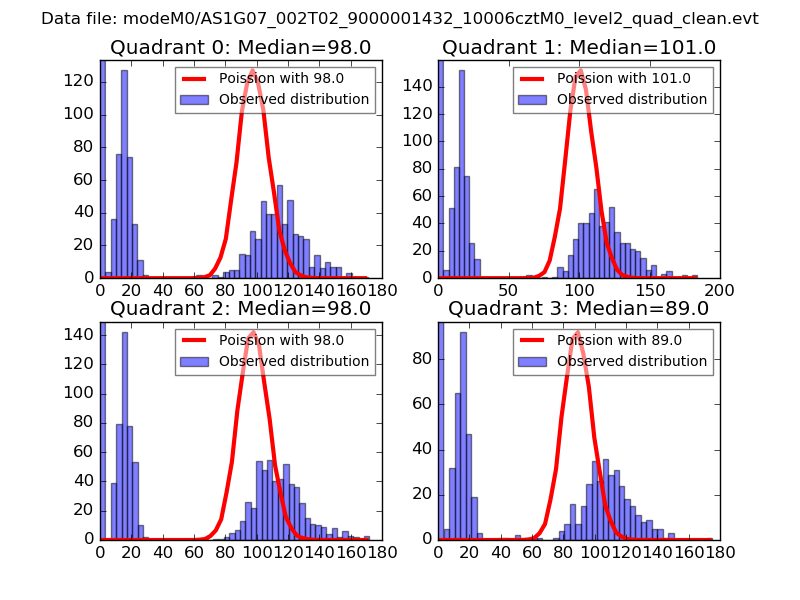 |
 |
| Quadrant-wise count rates Data is divided into 100 sec bins |
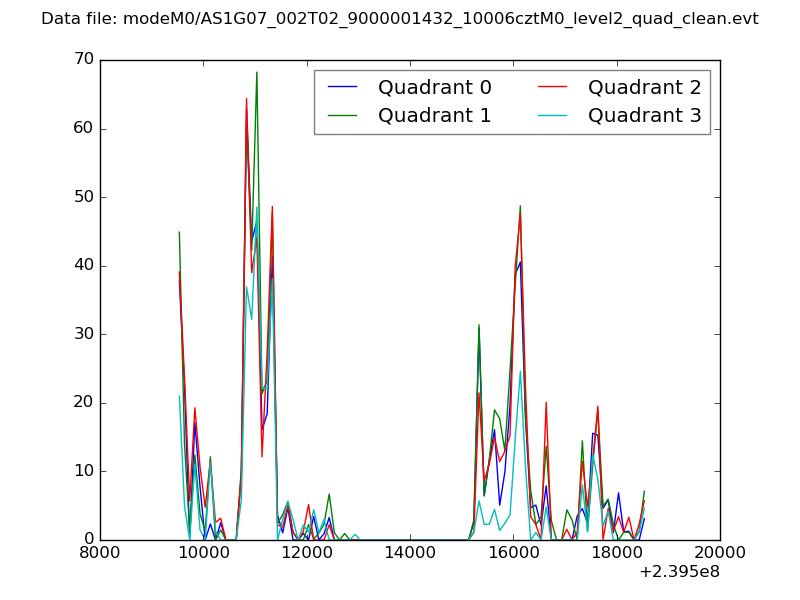 |
|
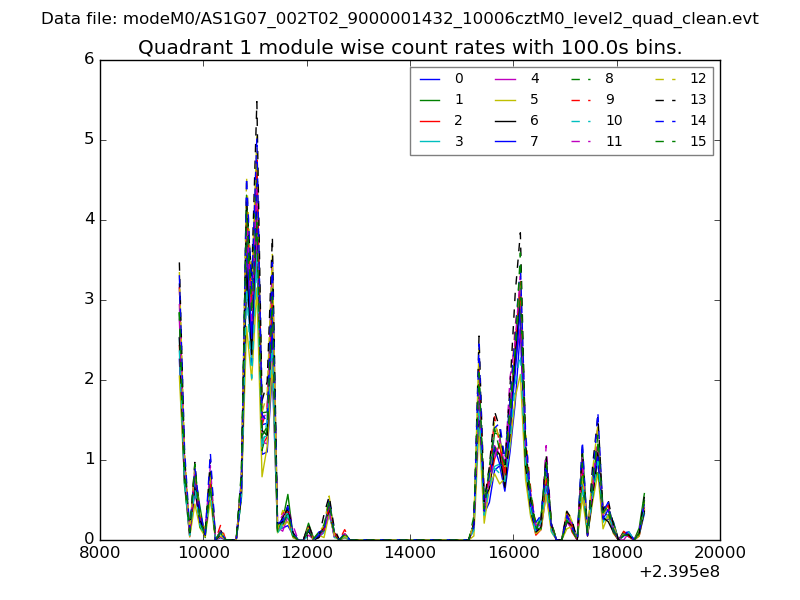
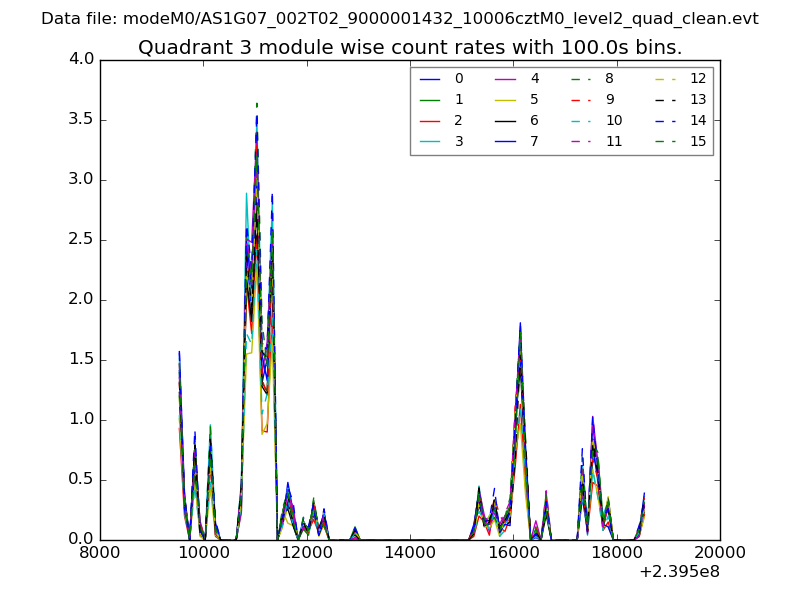
| Module-wise count rates for Quadrant A Data is divided into 100 sec bins |
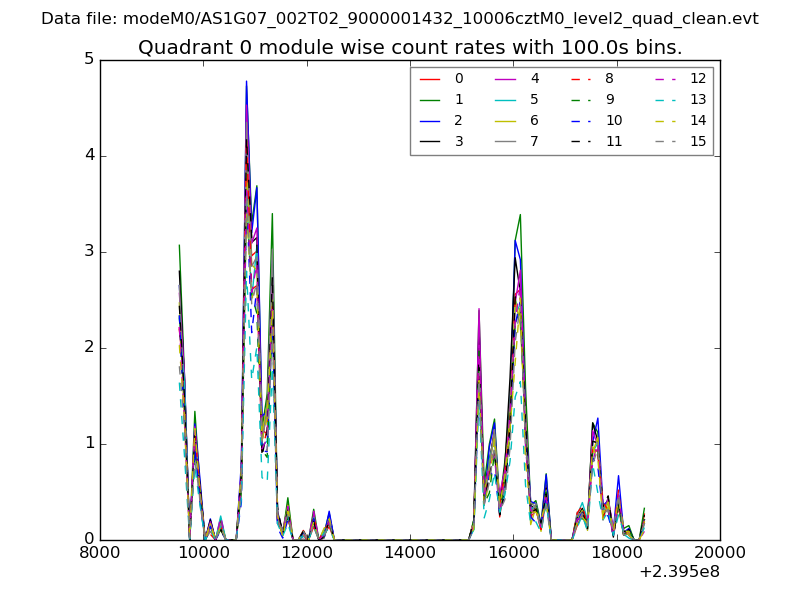 |
 |
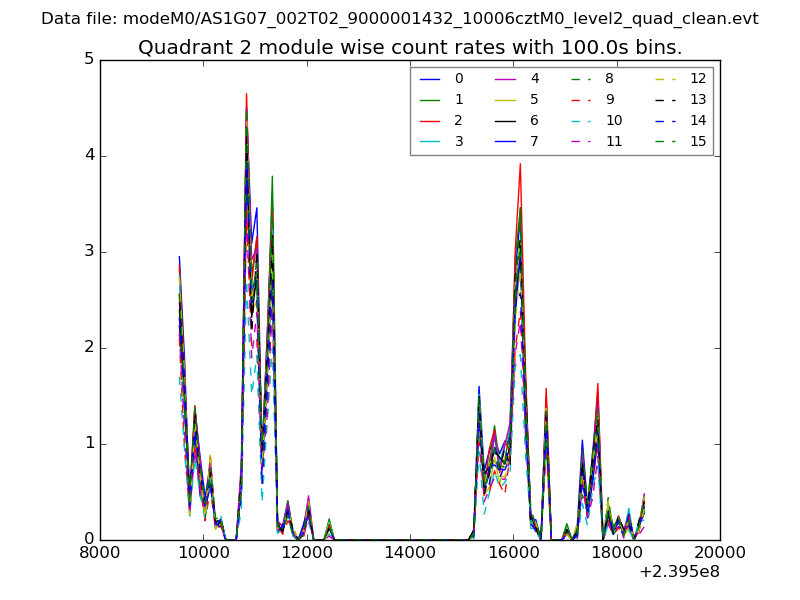
| Module-wise count rates for Quadrant B Data is divided into 100 sec bins |
 |
 |
| Module-wise count rates for Quadrant C Data is divided into 100 sec bins |
 |
 |
| Module-wise count rates for Quadrant D Data is divided into 100 sec bins |
 |
 |
| Parameter | Plot |
|---|---|
| CZT HV Monitor | 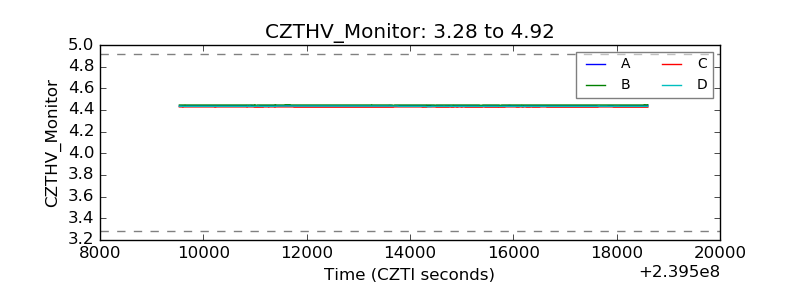 |
| D_VDD | 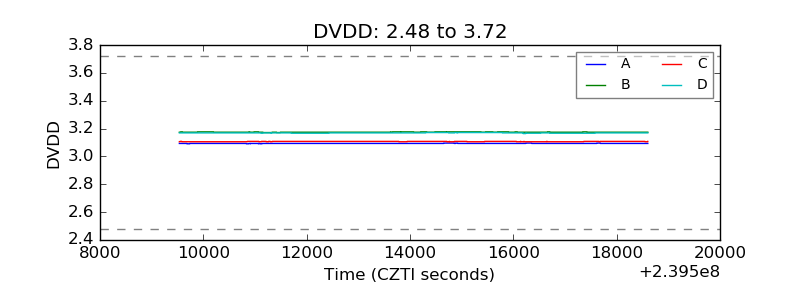 |
| Temperature 1 |  |
| Veto HV Monitor | 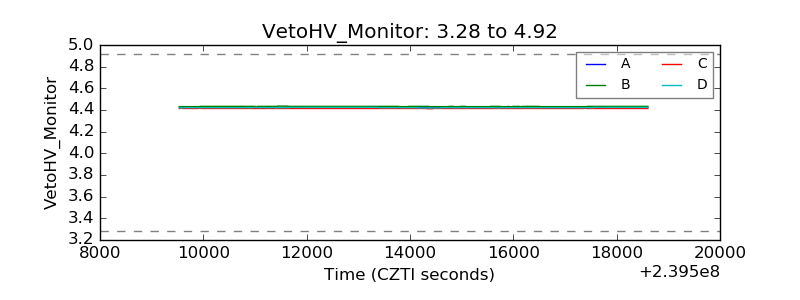 |
| Veto LLD |  |
| Alpha Counter | 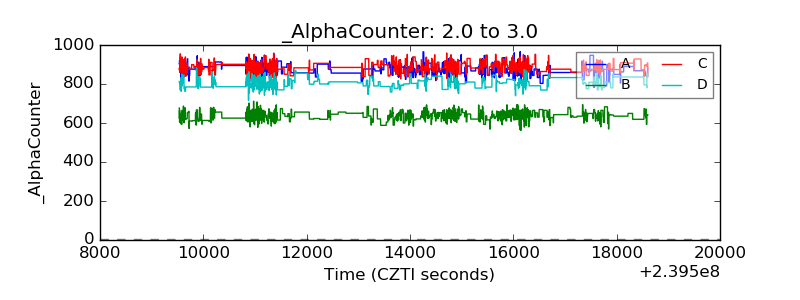 |
| _CPM_Rate | 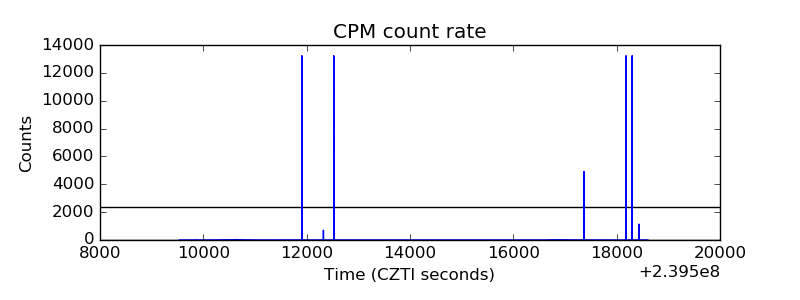 |
| CZT Counter | 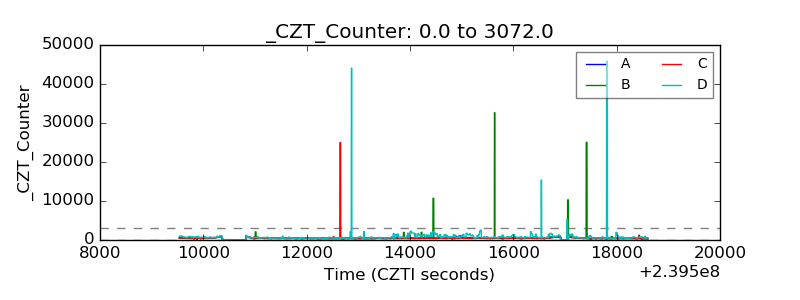 |
| +2.5 Volts monitor |  |
| +5 Volts monitor | 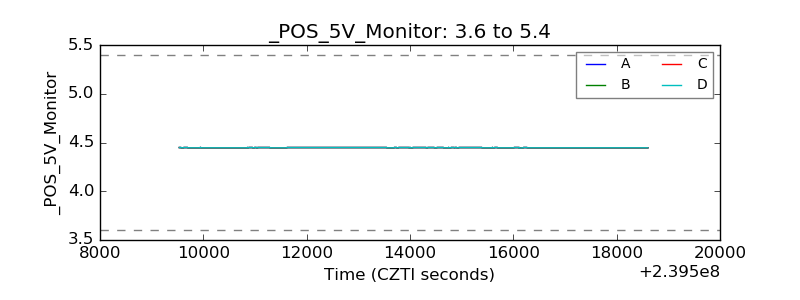 |
| _ROLL_ROT | 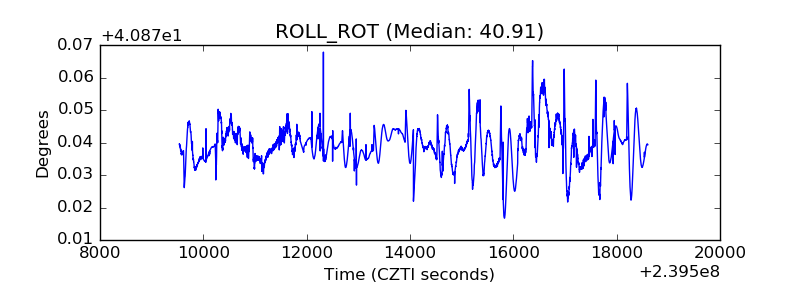 |
| _Roll_DEC | 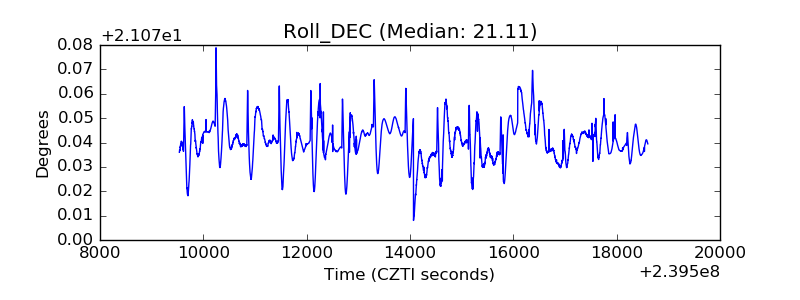 |
| _Roll_RA | 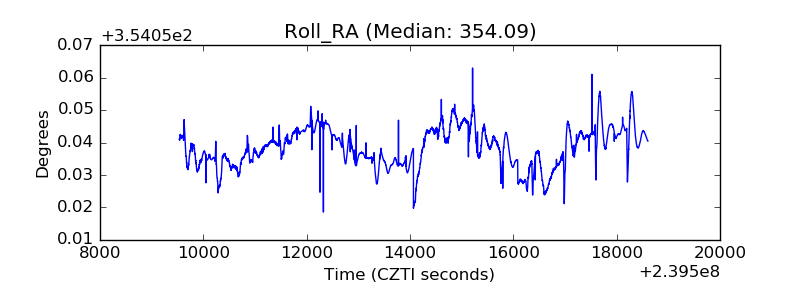 |
| Veto Counter | 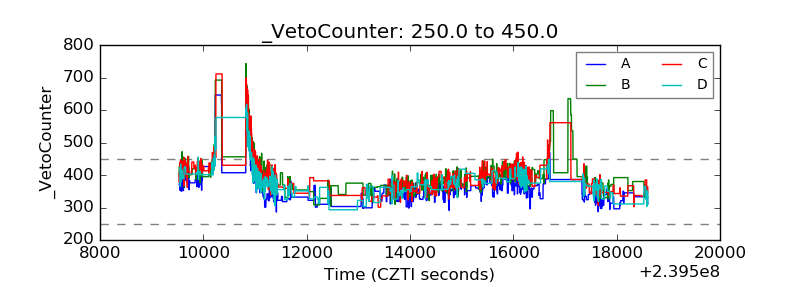 |