| Param | Original file | Final file |
|---|---|---|
| Filename | modeM0/AS1G07_002T02_9000001432_10007cztM0_level2.evt | modeM0/AS1G07_002T02_9000001432_10007cztM0_level2_quad_clean.evt |
| Size (bytes) | 439,113,600 | 73,175,040 |
| Size | 418.8 MB | 69.8 MB |
| Events in quadrant A | 2,906,038 | 458,304 |
| Events in quadrant B | 2,847,668 | 466,308 |
| Events in quadrant C | 2,723,187 | 458,522 |
| Events in quadrant D | 4,399,777 | 400,147 |
| Mode SS | |||
|---|---|---|---|
| Quadrant | BADHDUFLAG | Total packets | Discarded packets |
| A | 0 | 168 | 25 |
| B | 0 | 170 | 42 |
| C | 0 | 169 | 38 |
| D | 0 | 170 | 46 |
| Mode M0 | |||
|---|---|---|---|
| Quadrant | BADHDUFLAG | Total packets | Discarded packets |
| A | 0 | 16986 | 4154 |
| B | 0 | 17066 | 4259 |
| C | 0 | 16829 | 4149 |
| D | 0 | 24256 | 7309 |
| Mode M9 | |||
|---|---|---|---|
| Quadrant | BADHDUFLAG | Total packets | Discarded packets |
| A | 0 | 5 | 4 |
| B | 0 | 4 | 0 |
| C | 0 | 4 | 1 |
| D | 0 | 4 | 0 |
| Quadrant | Total seconds | Saturated seconds | Saturation percentage |
|---|---|---|---|
| A | 6269 | 98 | 1.563248% |
| B | 6224 | 104 | 1.670951% |
| C | 6243 | 52 | 0.832933% |
| D | 5867 | 294 | 5.011079% |
Noise dominated data is calculated using 1-second bins in cleaned event files. If a bin has >2000 counts, and if more than 50% of those come from <1% of pixels, then it is considered to be noise-dominated and hence unusable.
| Quadrant | # 1 sec bins | Bins with >0 counts | Bins with >2000 counts | High rate bins dominated by noise | Noise dominated (total time) | Noise dominated (detector-on time) | Marked lightcurve |
|---|---|---|---|---|---|---|---|
| A | 8642 | 7241 | 0 | 0 | 0.00% | 0.00% | 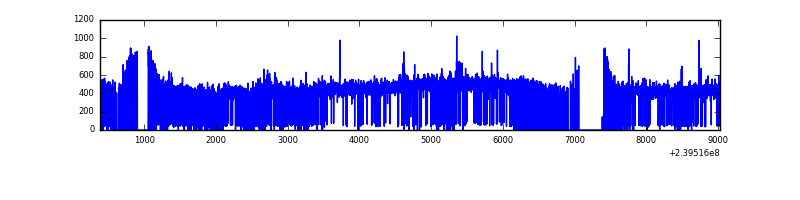 |
| B | 8642 | 7257 | 0 | 0 | 0.00% | 0.00% | 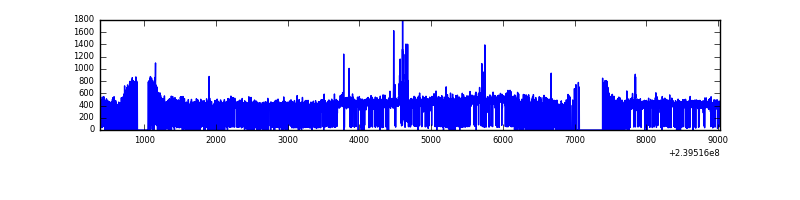 |
| C | 8642 | 7274 | 0 | 0 | 0.00% | 0.00% | 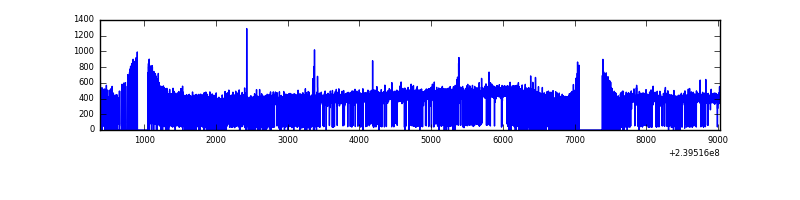 |
| D | 8642 | 6951 | 171 | 171 | 1.98% | 2.46% | 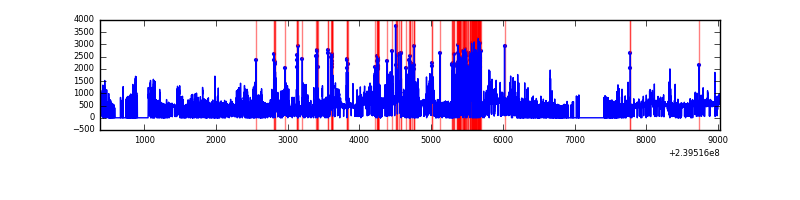 |
Top three noisy pixels from each quadrant. If the there are fewer than three noisy pixels in the level2.evt file, extra rows are filled as -1
| Pixel properties | Quadrant properties | ||||||
|---|---|---|---|---|---|---|---|
| Quadrant | DetID | PixID | Counts | Sigma | Mean | Median | Sigma |
| A | 8 | 15 | 108289 | 726.77 | 718 | 700 | 148.0 |
| A | 13 | 14 | 26248 | 172.58 | 718 | 700 | 148.0 |
| A | 0 | 226 | 6498 | 39.17 | 718 | 700 | 148.0 |
| B | 4 | 81 | 33295 | 233.08 | 713 | 694 | 139.9 |
| B | 0 | 219 | 16140 | 110.43 | 713 | 694 | 139.9 |
| B | 12 | 111 | 15990 | 109.36 | 713 | 694 | 139.9 |
| C | 13 | 61 | 5155 | 27.43 | 695 | 699 | 162.4 |
| C | 14 | 128 | 4474 | 23.24 | 695 | 699 | 162.4 |
| C | 14 | 67 | 3923 | 19.85 | 695 | 699 | 162.4 |
| D | 8 | 195 | 430166 | 2640.69 | 638 | 622 | 162.7 |
| D | 1 | 52 | 401861 | 2466.68 | 638 | 622 | 162.7 |
| D | 12 | 110 | 395149 | 2425.42 | 638 | 622 | 162.7 |
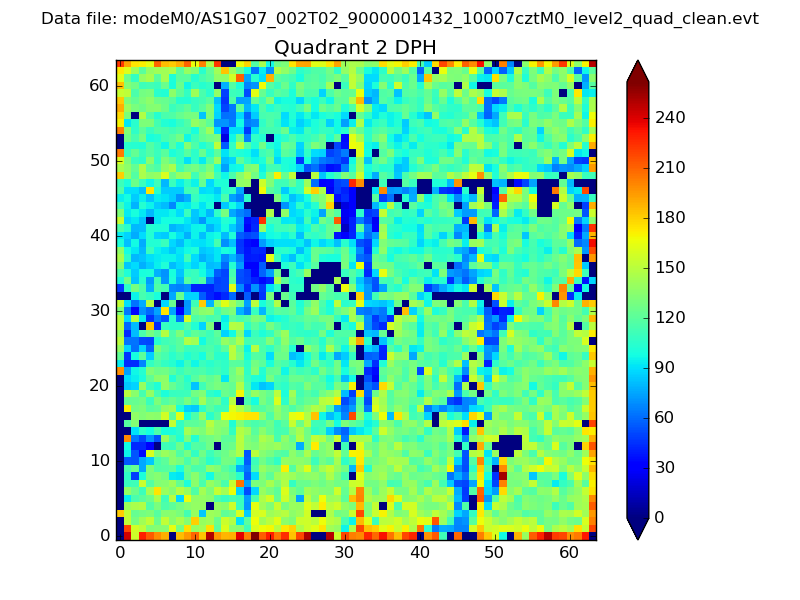
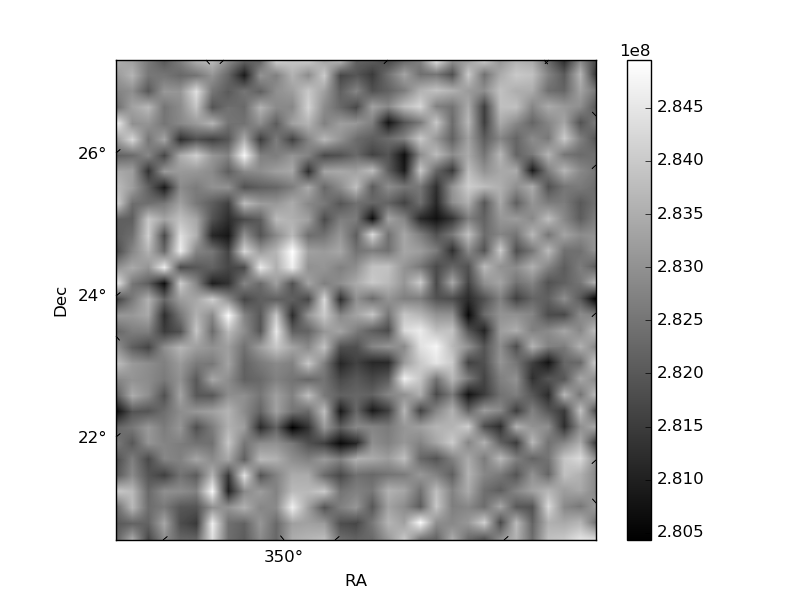
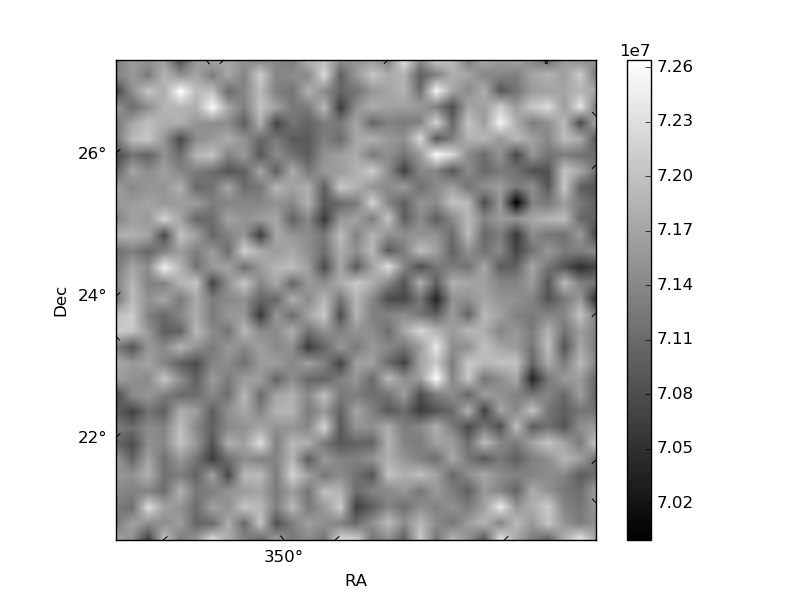
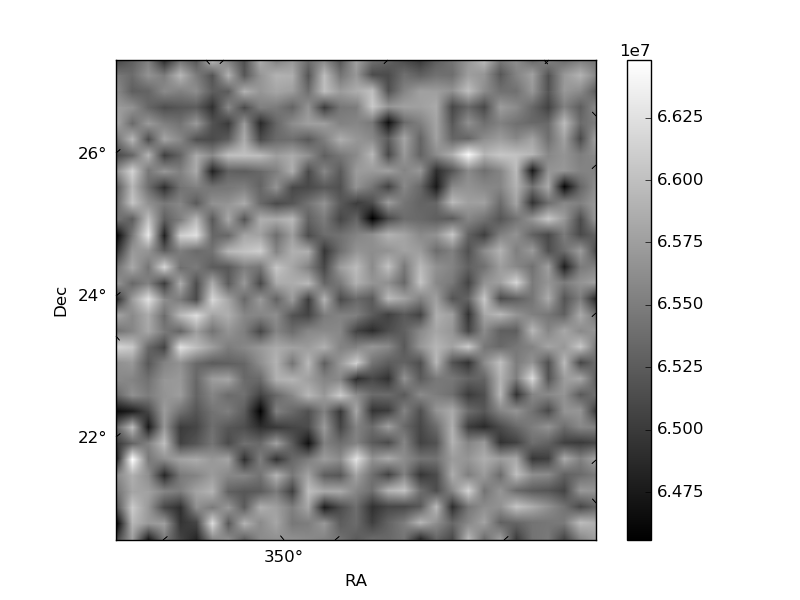
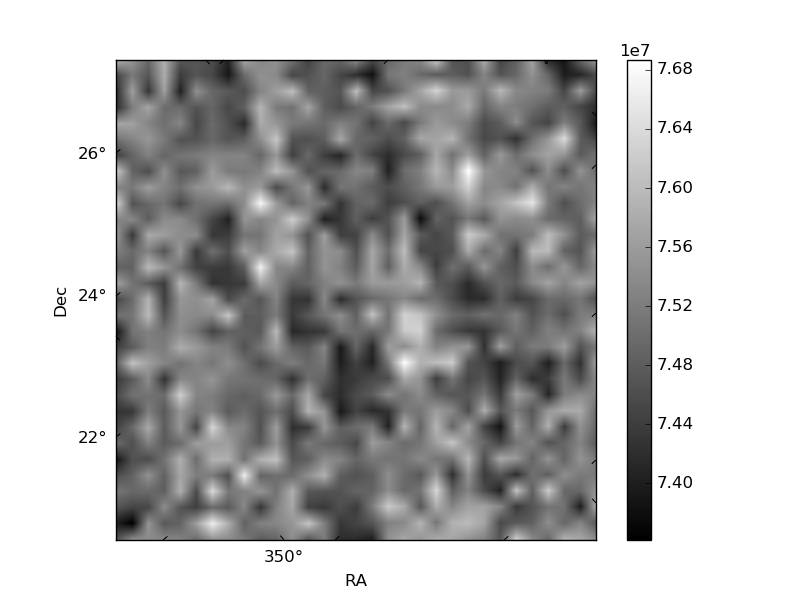
Histogram calculated using DETX and DETY for each event in the final _common_clean file
| Quadrant A | 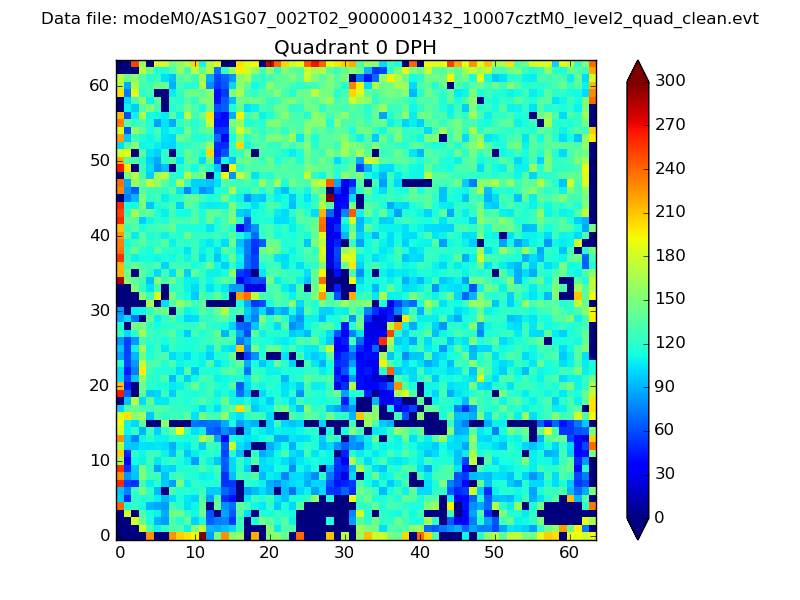 |
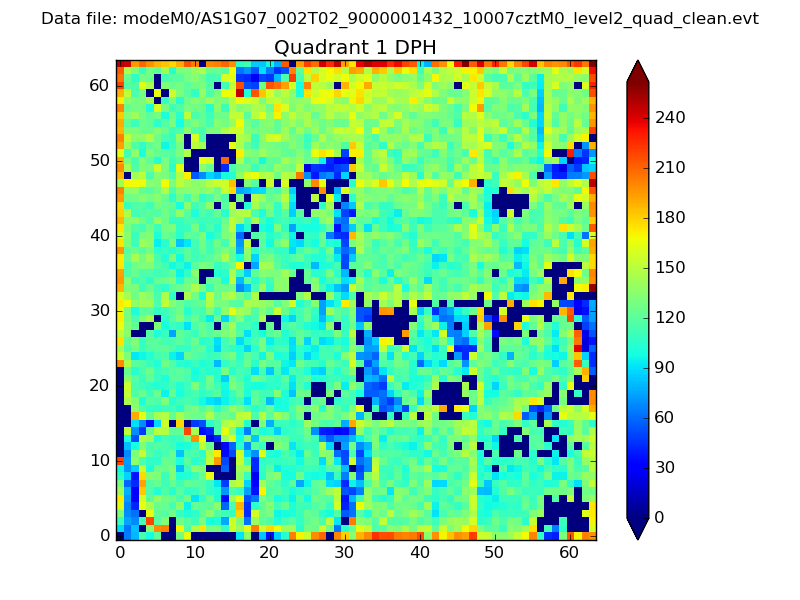 |
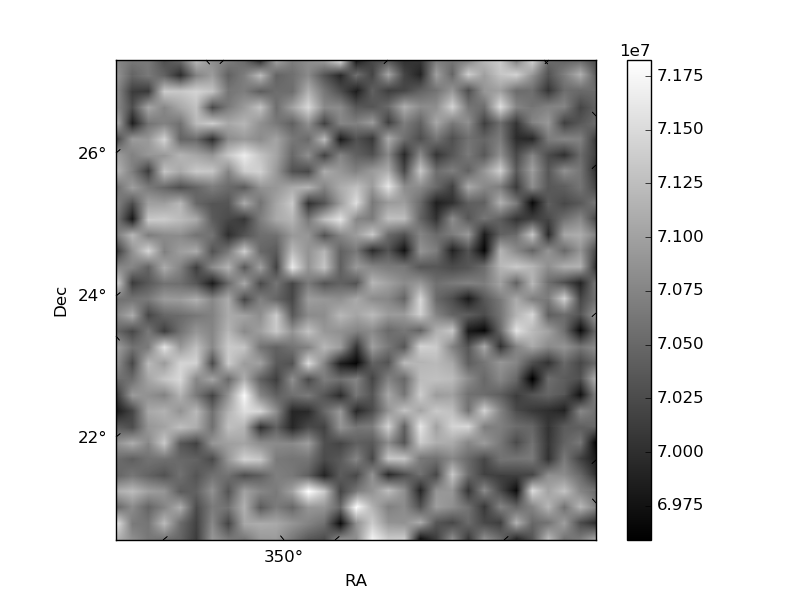
Quadrant B |
|---|---|---|---|
| Quadrant D | 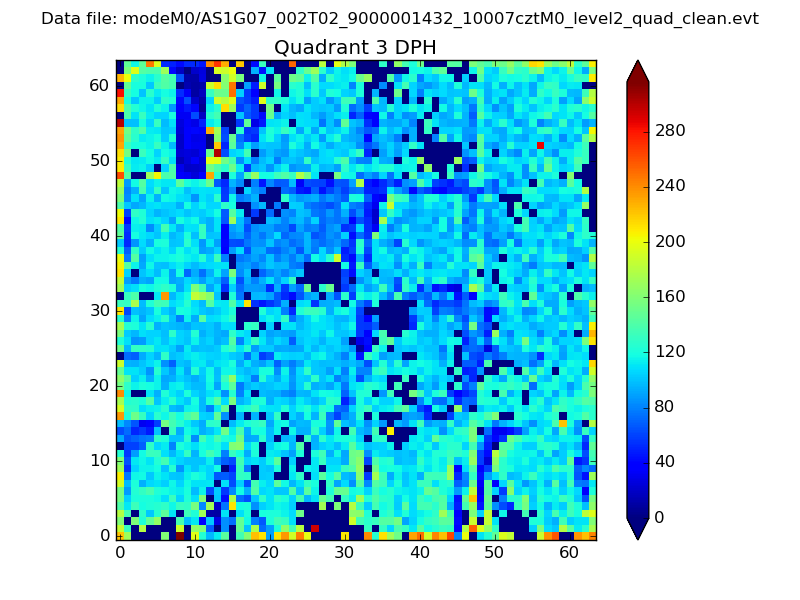 |
 |
Quadrant C |
| Plot type | Count rate plots | Images |
|---|---|---|
| Comparison with Poisson distribution Blue bars denote a histogram of data divided into 1 sec bins. Red curve is a Poisson curve with rate = median count rate of data. |
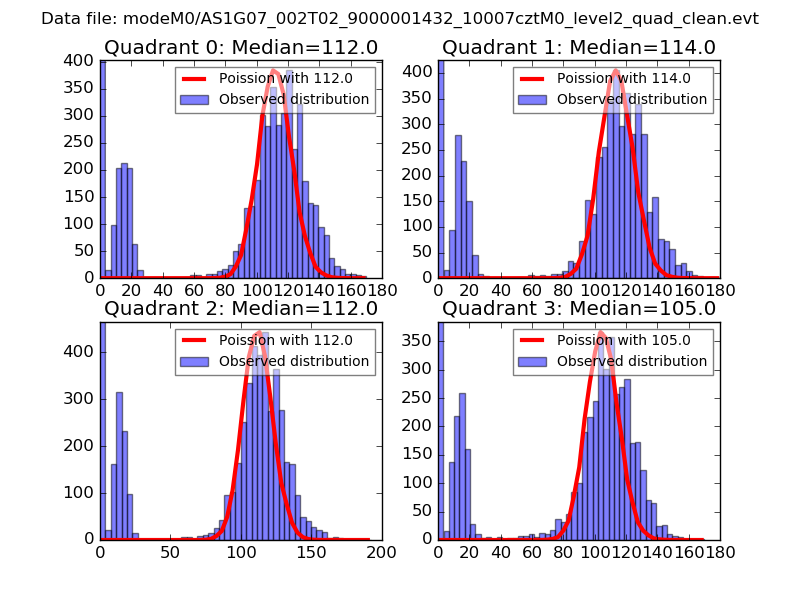 |
 |
| Quadrant-wise count rates Data is divided into 100 sec bins |
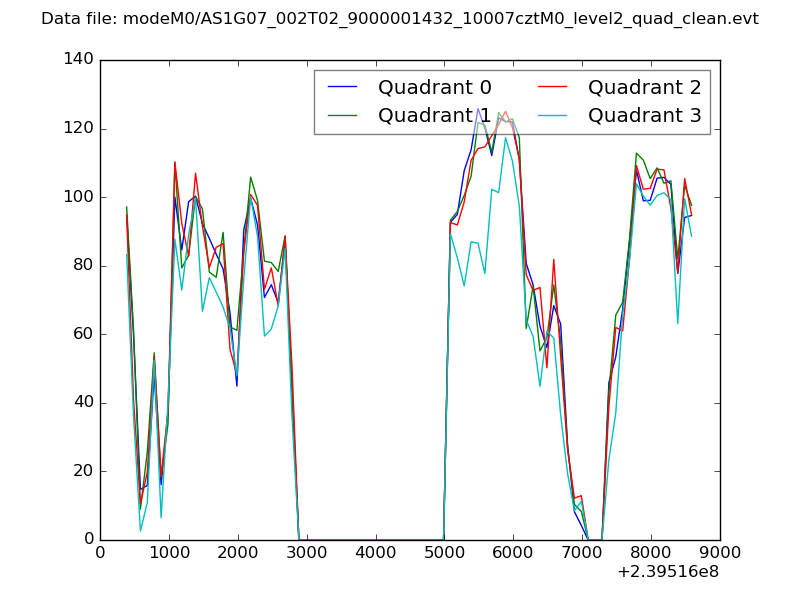 |
|
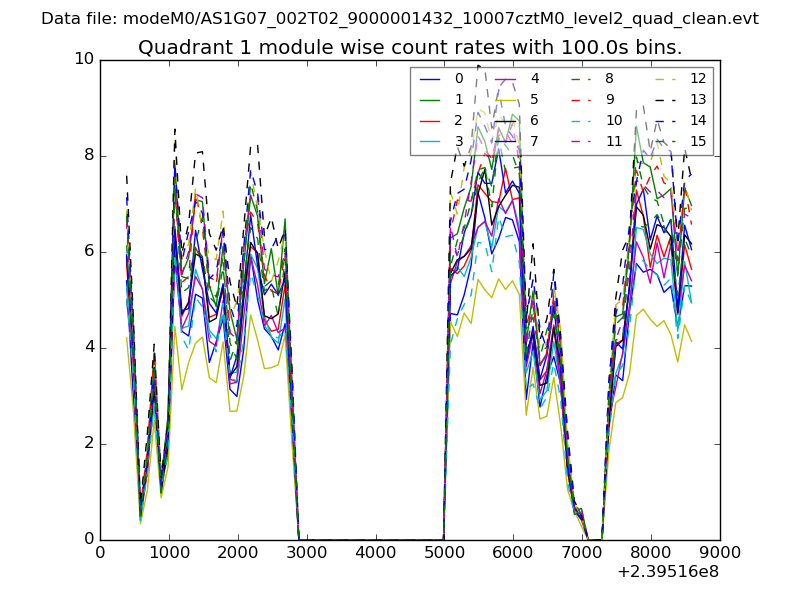
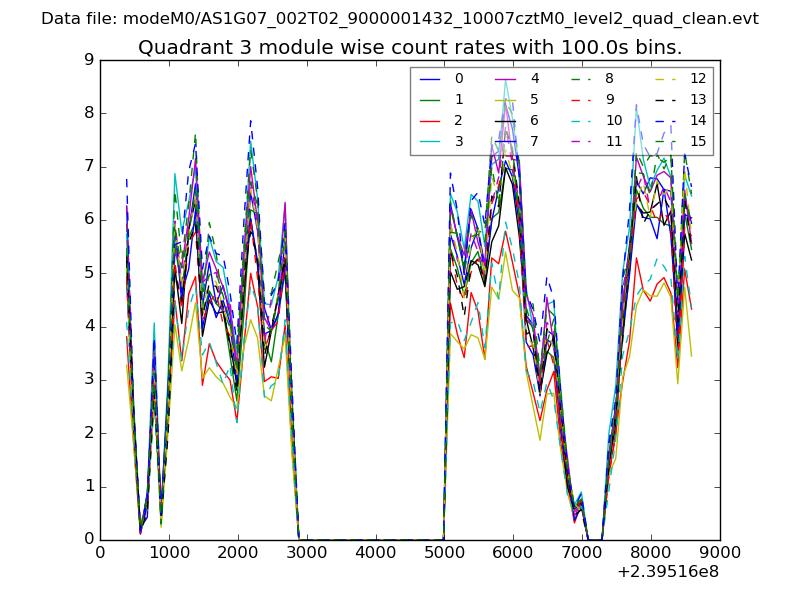
| Module-wise count rates for Quadrant A Data is divided into 100 sec bins |
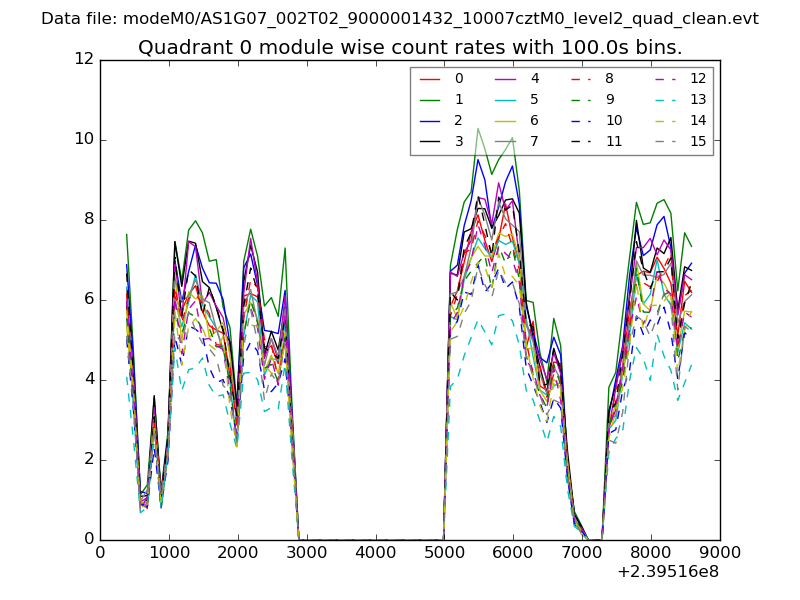 |
 |
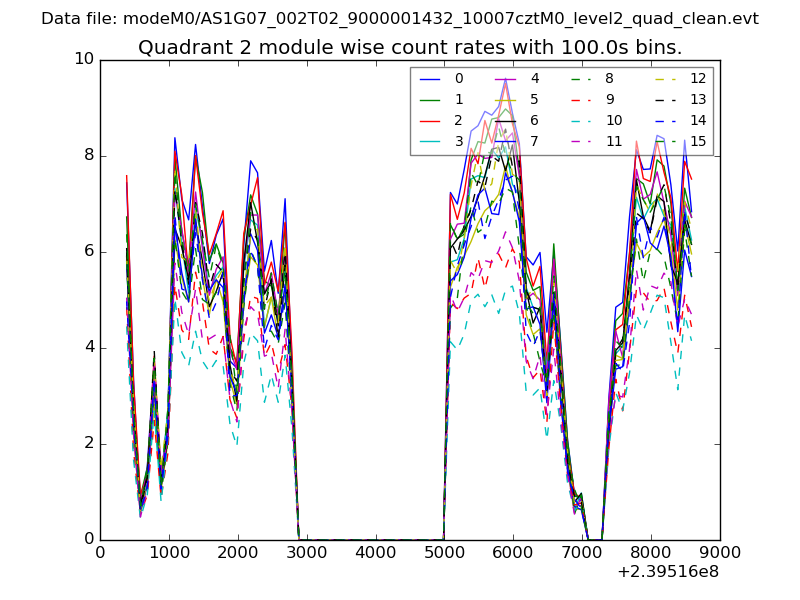
| Module-wise count rates for Quadrant B Data is divided into 100 sec bins |
 |
 |
| Module-wise count rates for Quadrant C Data is divided into 100 sec bins |
 |
 |
| Module-wise count rates for Quadrant D Data is divided into 100 sec bins |
 |
 |
| Parameter | Plot |
|---|---|
| CZT HV Monitor | 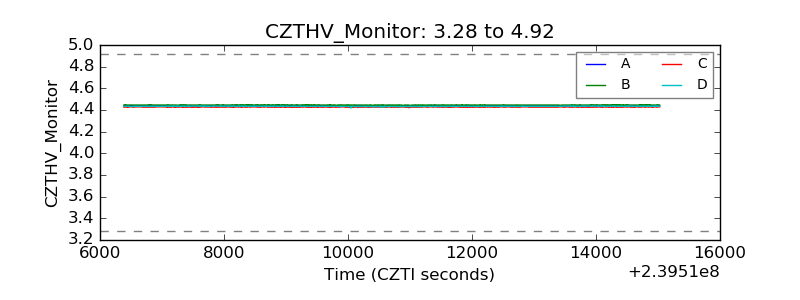 |
| D_VDD | 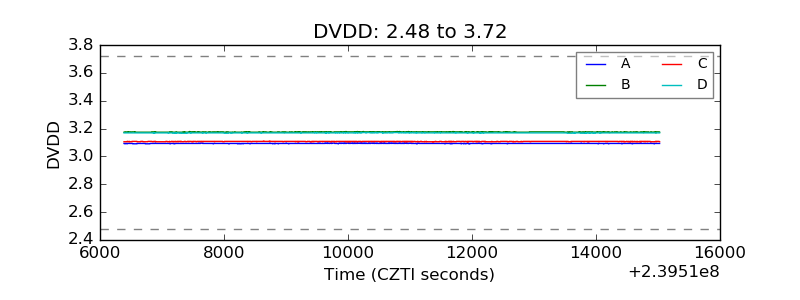 |
| Temperature 1 | 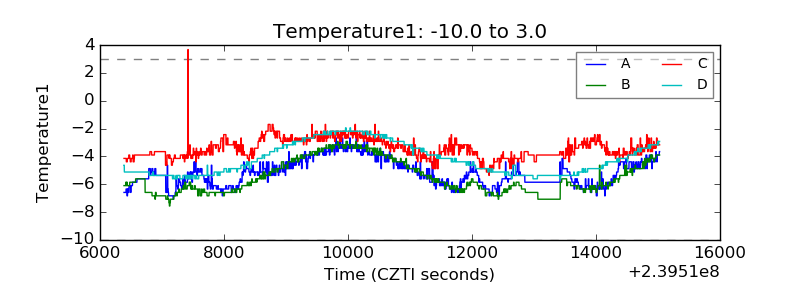 |
| Veto HV Monitor | 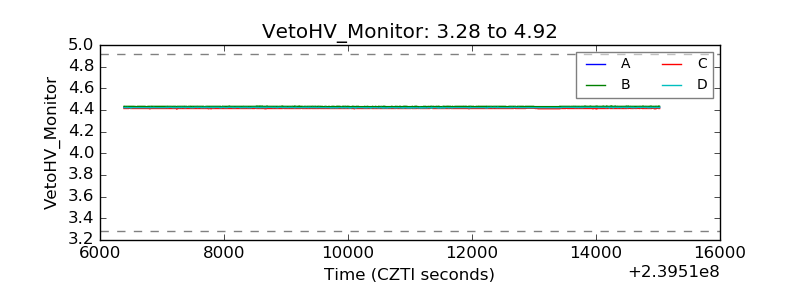 |
| Veto LLD |  |
| Alpha Counter | 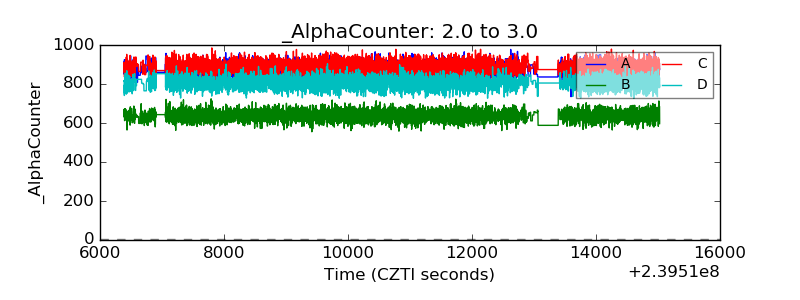 |
| _CPM_Rate | 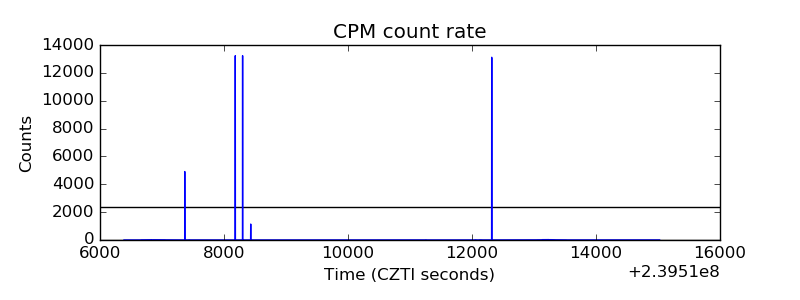 |
| CZT Counter | 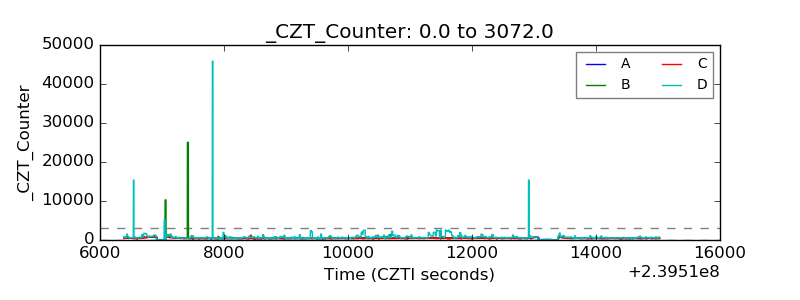 |
| +2.5 Volts monitor |  |
| +5 Volts monitor |  |
| _ROLL_ROT | 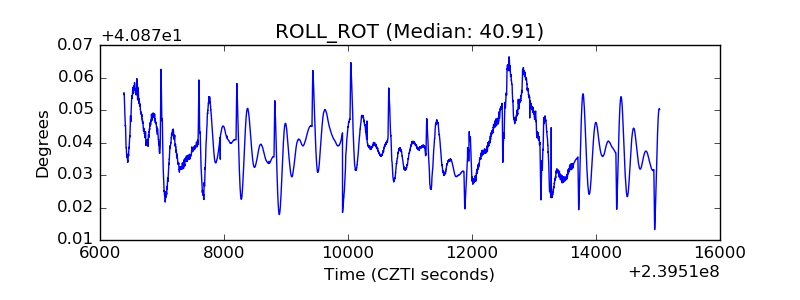 |
| _Roll_DEC | 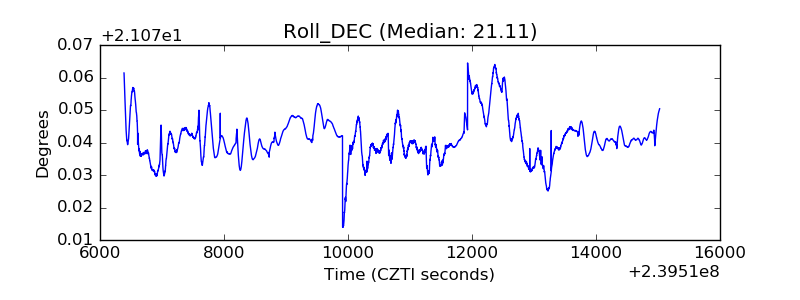 |
| _Roll_RA | 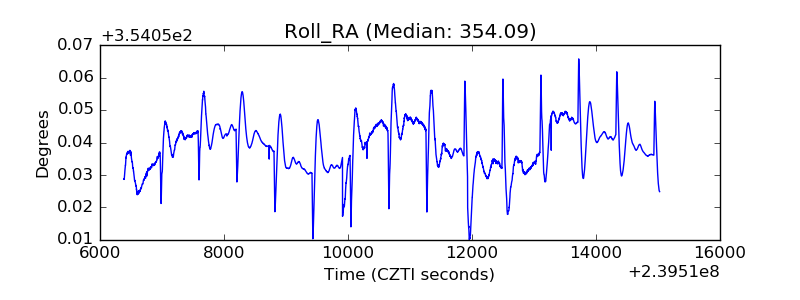 |
| Veto Counter | 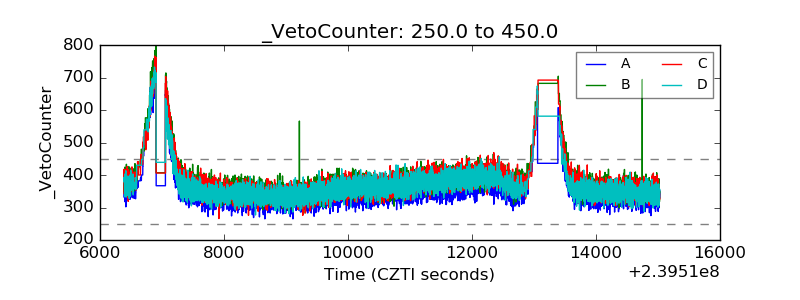 |