| Param | Original file | Final file |
|---|---|---|
| Filename | modeM0/AS1G07_002T02_9000001432_10009cztM0_level2.evt | modeM0/AS1G07_002T02_9000001432_10009cztM0_level2_quad_clean.evt |
| Size (bytes) | 364,901,760 | 59,973,120 |
| Size | 348.0 MB | 57.2 MB |
| Events in quadrant A | 2,535,180 | 365,473 |
| Events in quadrant B | 2,507,335 | 371,321 |
| Events in quadrant C | 2,374,055 | 365,818 |
| Events in quadrant D | 3,267,087 | 336,737 |
| Mode SS | |||
|---|---|---|---|
| Quadrant | BADHDUFLAG | Total packets | Discarded packets |
| A | 0 | 148 | 36 |
| B | 0 | 149 | 41 |
| C | 0 | 148 | 42 |
| D | 0 | 149 | 38 |
| Mode M0 | |||
|---|---|---|---|
| Quadrant | BADHDUFLAG | Total packets | Discarded packets |
| A | 0 | 15135 | 3959 |
| B | 0 | 15339 | 4131 |
| C | 0 | 15072 | 4022 |
| D | 0 | 19000 | 5935 |
| Mode M9 | |||
|---|---|---|---|
| Quadrant | BADHDUFLAG | Total packets | Discarded packets |
| A | 0 | 4 | 0 |
| B | 0 | 4 | 0 |
| C | 0 | 4 | 0 |
| D | 0 | 4 | 0 |
| Quadrant | Total seconds | Saturated seconds | Saturation percentage |
|---|---|---|---|
| A | 5462 | 85 | 1.556207% |
| B | 5436 | 93 | 1.710817% |
| C | 5425 | 54 | 0.995392% |
| D | 5122 | 111 | 2.167122% |
Noise dominated data is calculated using 1-second bins in cleaned event files. If a bin has >2000 counts, and if more than 50% of those come from <1% of pixels, then it is considered to be noise-dominated and hence unusable.
| Quadrant | # 1 sec bins | Bins with >0 counts | Bins with >2000 counts | High rate bins dominated by noise | Noise dominated (total time) | Noise dominated (detector-on time) | Marked lightcurve |
|---|---|---|---|---|---|---|---|
| A | 7882 | 6375 | 0 | 0 | 0.00% | 0.00% | 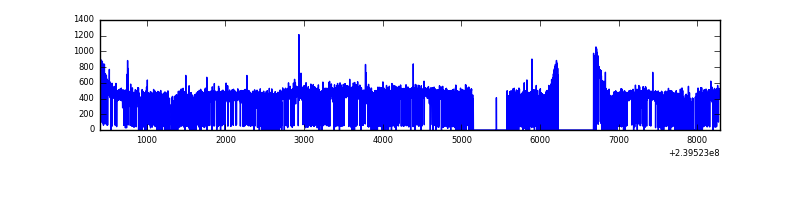 |
| B | 7883 | 6315 | 6 | 6 | 0.08% | 0.10% | 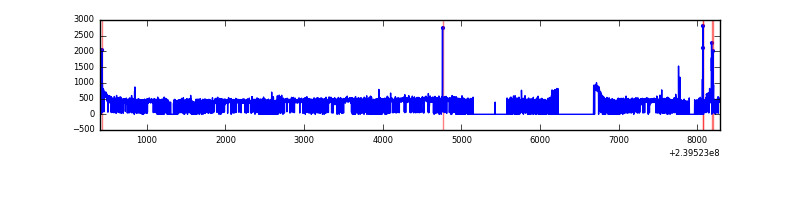 |
| C | 7883 | 6371 | 0 | 0 | 0.00% | 0.00% | 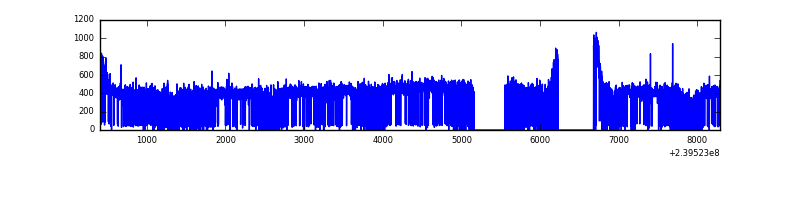 |
| D | 7883 | 6140 | 32 | 32 | 0.41% | 0.52% | 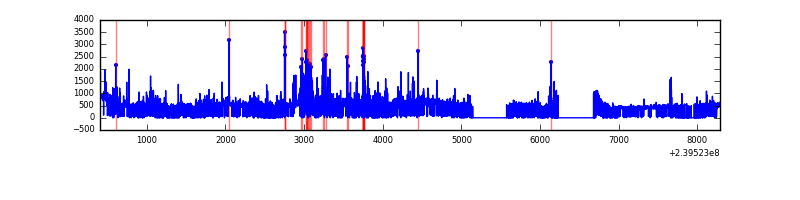 |
Top three noisy pixels from each quadrant. If the there are fewer than three noisy pixels in the level2.evt file, extra rows are filled as -1
| Pixel properties | Quadrant properties | ||||||
|---|---|---|---|---|---|---|---|
| Quadrant | DetID | PixID | Counts | Sigma | Mean | Median | Sigma |
| A | 8 | 15 | 90369 | 683.69 | 632 | 616 | 131.3 |
| A | 0 | 226 | 5606 | 38.01 | 632 | 616 | 131.3 |
| A | 12 | 194 | 5202 | 34.93 | 632 | 616 | 131.3 |
| B | 4 | 81 | 33104 | 263.16 | 627 | 610 | 123.5 |
| B | 12 | 111 | 13971 | 108.21 | 627 | 610 | 123.5 |
| B | 4 | 173 | 13796 | 106.79 | 627 | 610 | 123.5 |
| C | 13 | 61 | 4522 | 27.49 | 607 | 608 | 142.4 |
| C | 8 | 222 | 2920 | 16.24 | 607 | 608 | 142.4 |
| C | 5 | 128 | 1692 | 7.61 | 607 | 608 | 142.4 |
| D | 1 | 52 | 477776 | 3272.92 | 569 | 555 | 145.8 |
| D | 8 | 195 | 413224 | 2830.2 | 569 | 555 | 145.8 |
| D | 10 | 118 | 75857 | 516.44 | 569 | 555 | 145.8 |
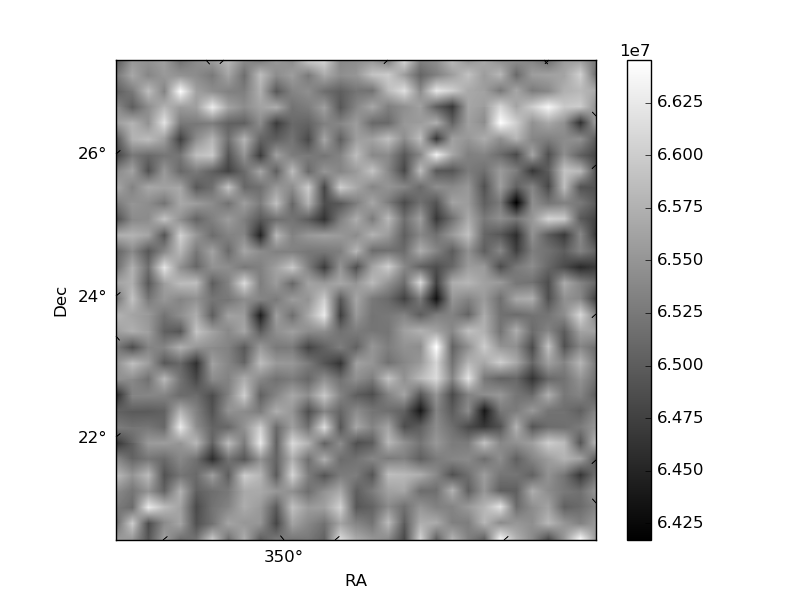
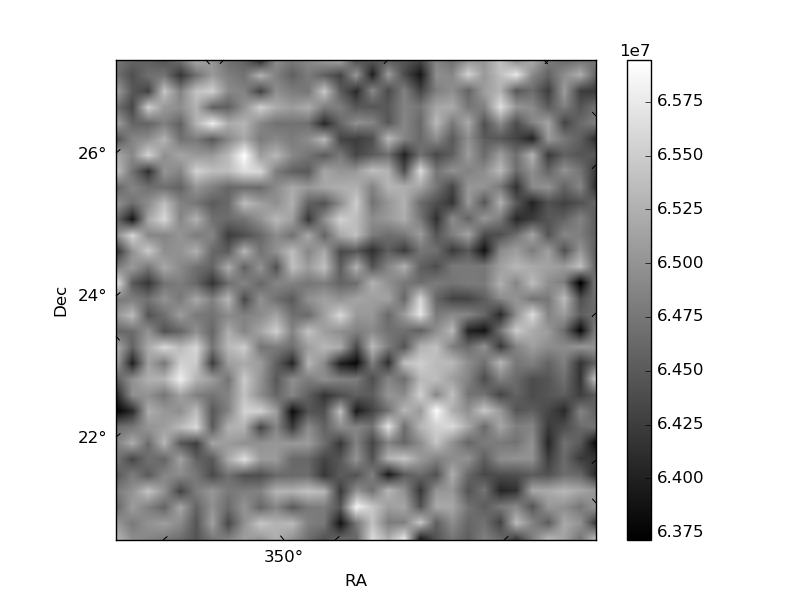
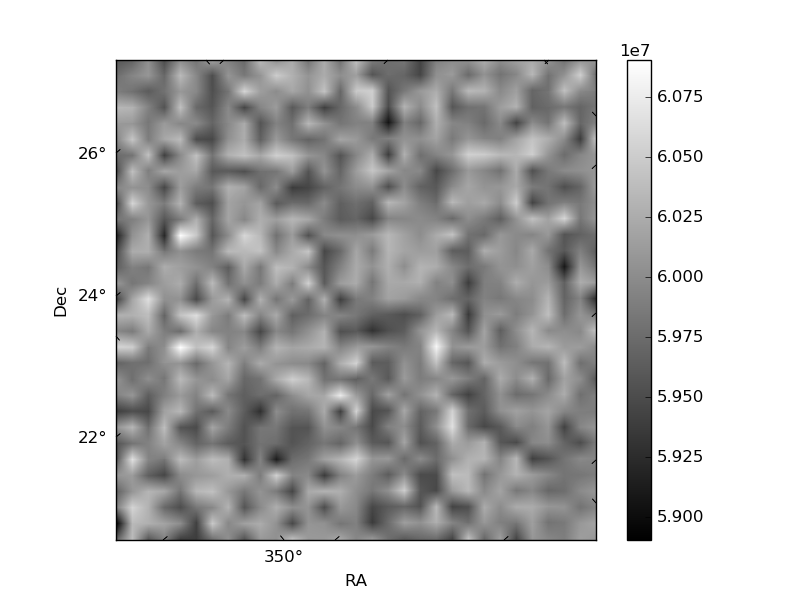
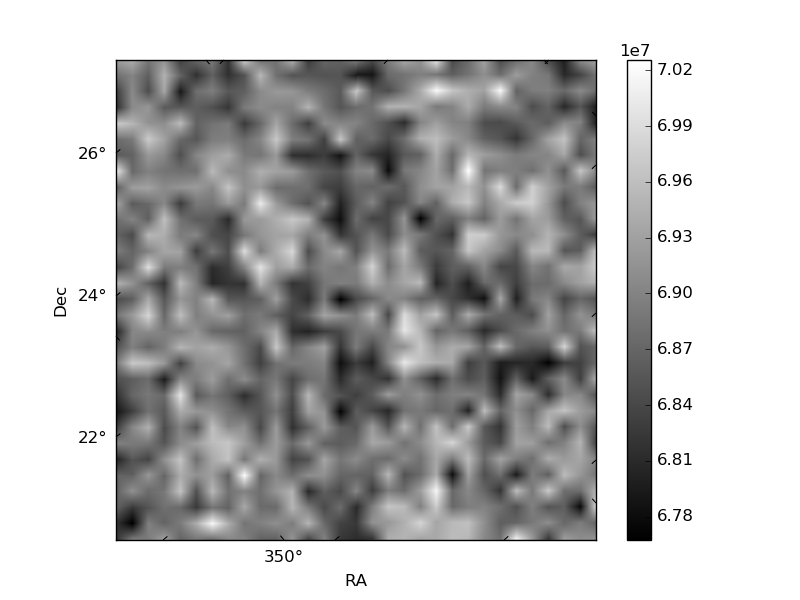
Histogram calculated using DETX and DETY for each event in the final _common_clean file
| Quadrant A | 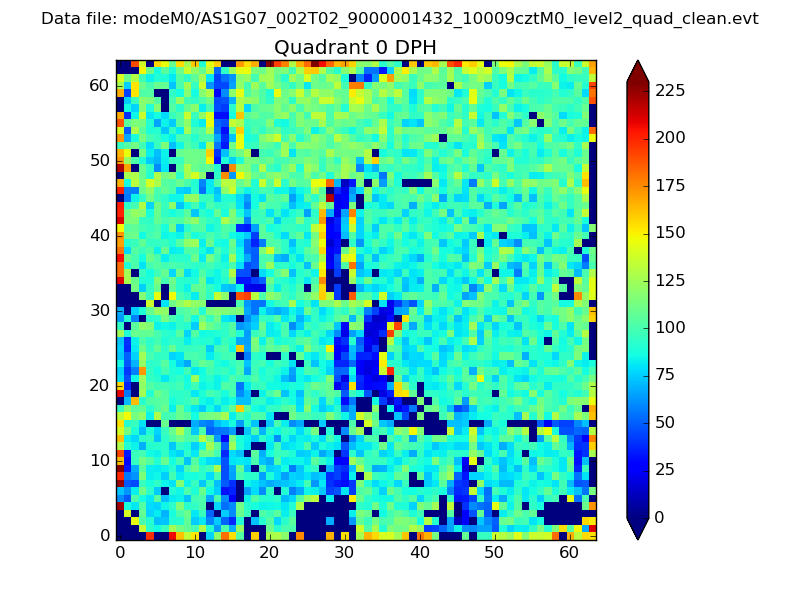 |
 |
Quadrant B |
|---|---|---|---|
| Quadrant D |  |
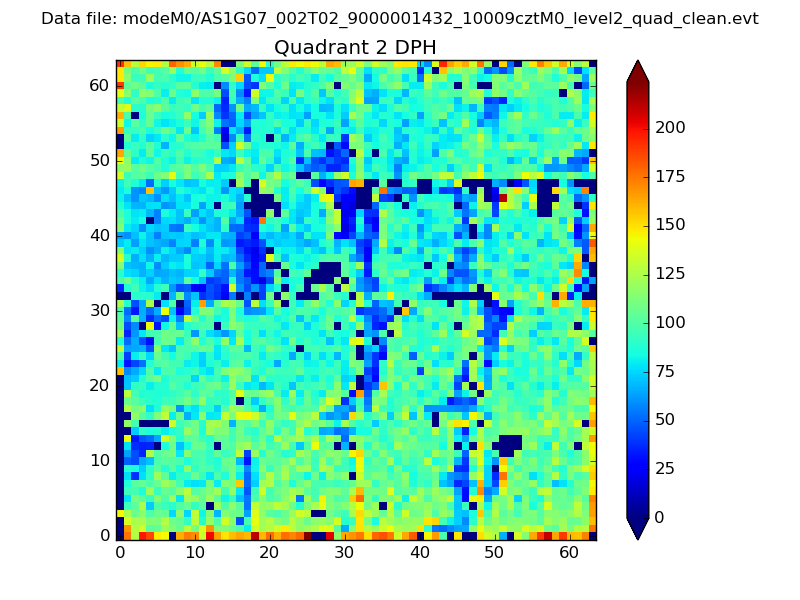 |
Quadrant C |
| Plot type | Count rate plots | Images |
|---|---|---|
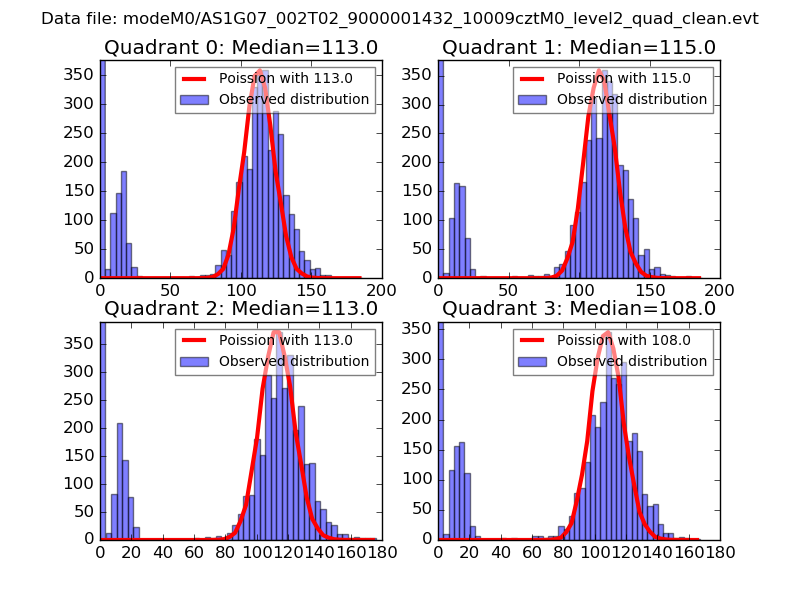
| Comparison with Poisson distribution Blue bars denote a histogram of data divided into 1 sec bins. Red curve is a Poisson curve with rate = median count rate of data. |
 |
 |
| Quadrant-wise count rates Data is divided into 100 sec bins |
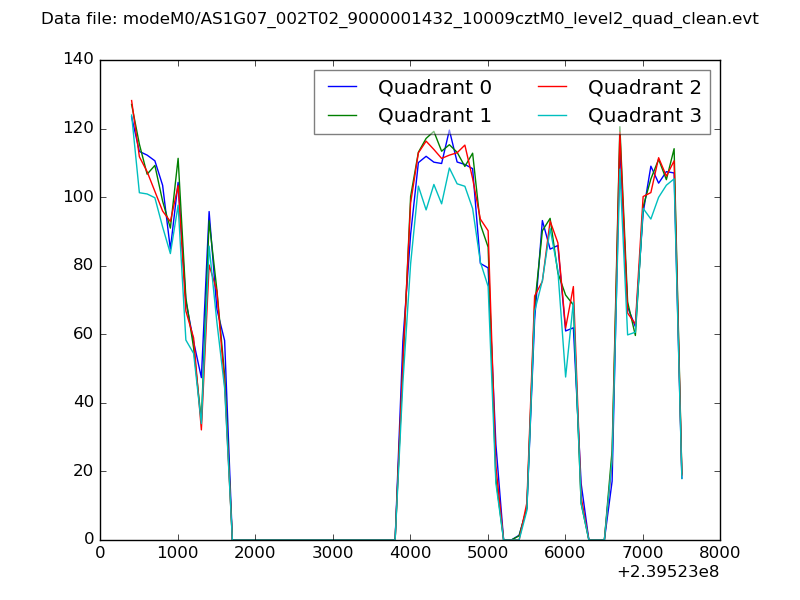 |
|
| Module-wise count rates for Quadrant A Data is divided into 100 sec bins |
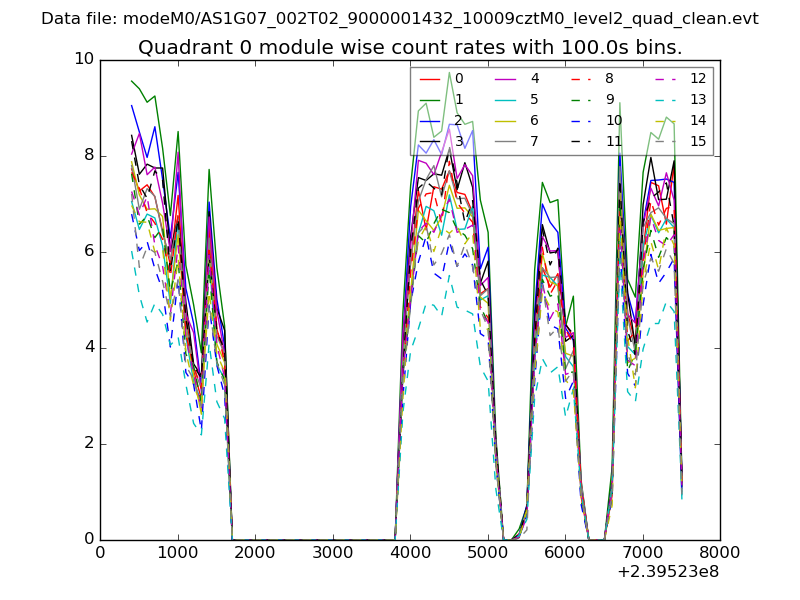 |
 |
| Module-wise count rates for Quadrant B Data is divided into 100 sec bins |
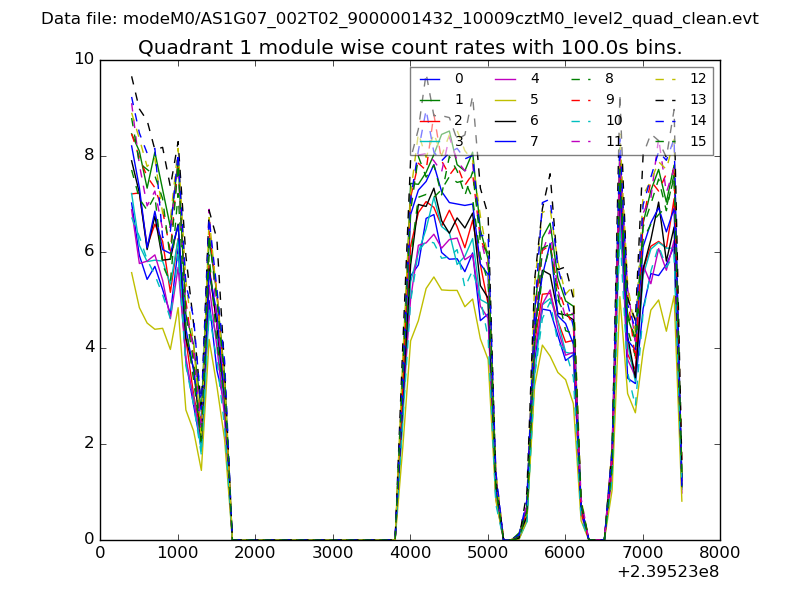 |
 |
| Module-wise count rates for Quadrant C Data is divided into 100 sec bins |
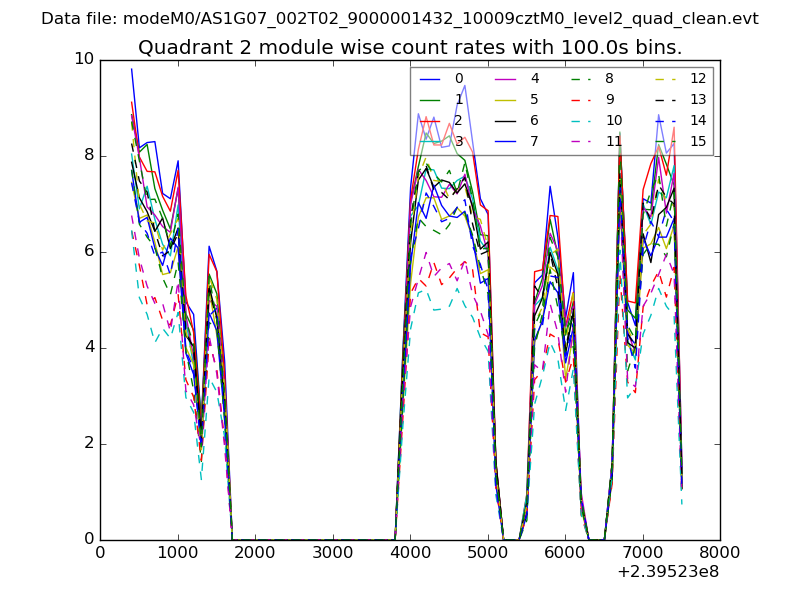 |
 |
| Module-wise count rates for Quadrant D Data is divided into 100 sec bins |
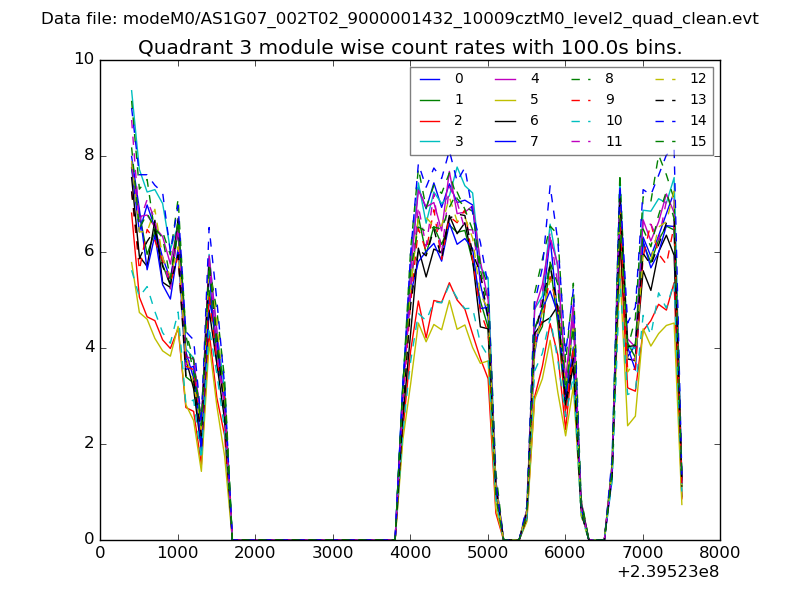 |
 |
| Parameter | Plot |
|---|---|
| CZT HV Monitor | 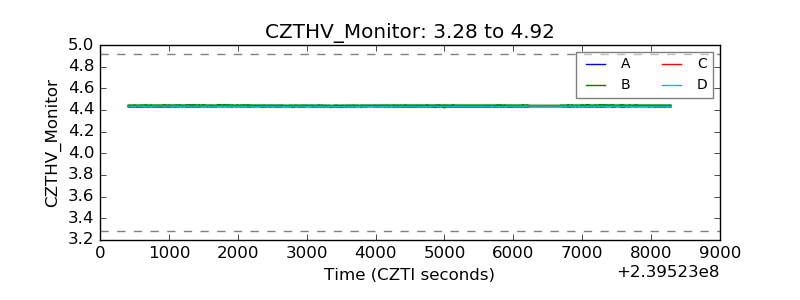 |
| D_VDD |  |
| Temperature 1 | 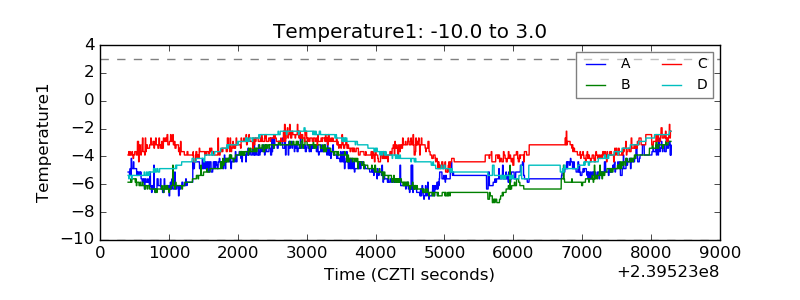 |
| Veto HV Monitor | 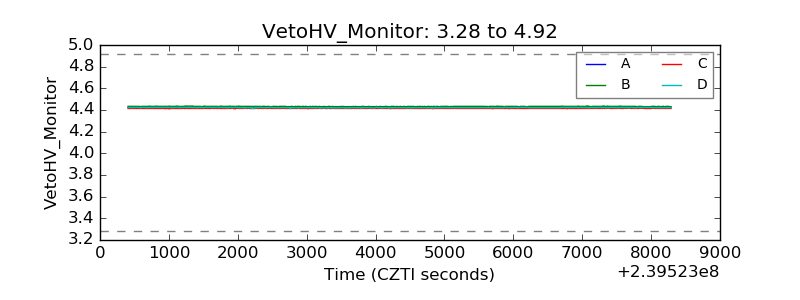 |
| Veto LLD | 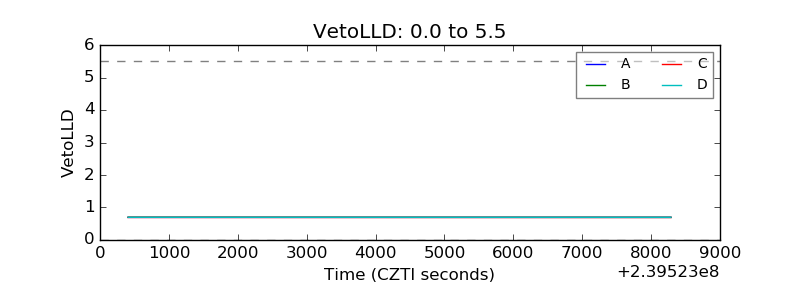 |
| Alpha Counter | 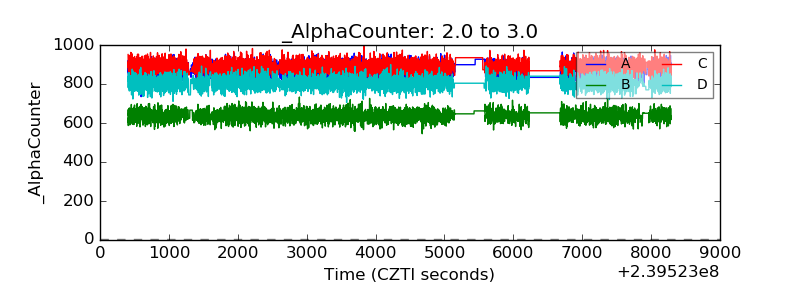 |
| _CPM_Rate | 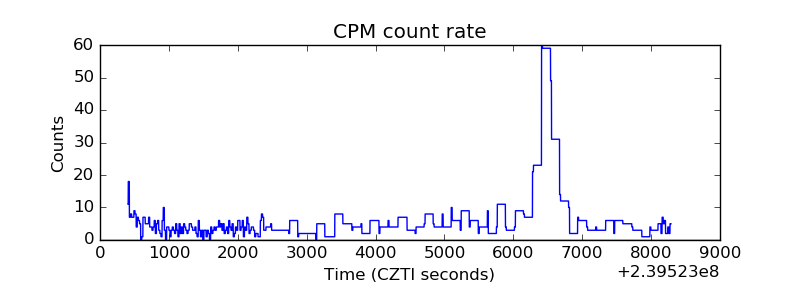 |
| CZT Counter | 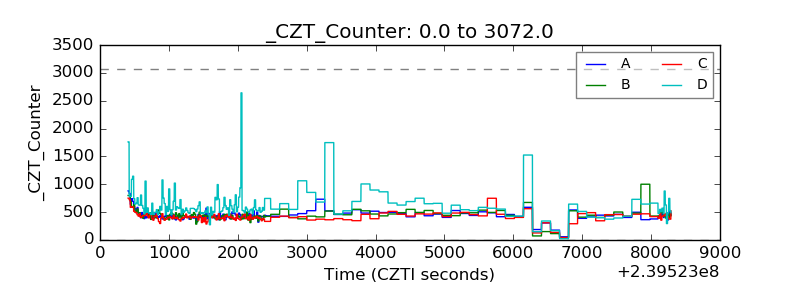 |
| +2.5 Volts monitor |  |
| +5 Volts monitor |  |
| _ROLL_ROT | 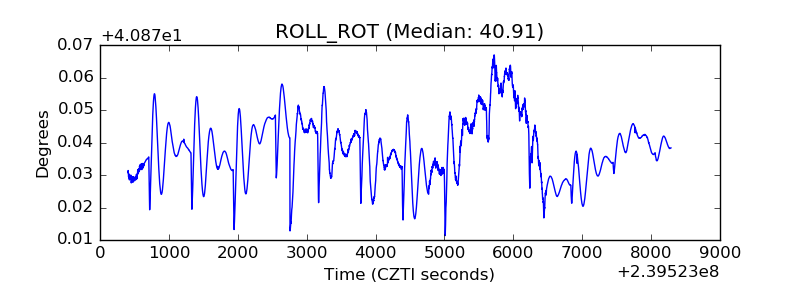 |
| _Roll_DEC | 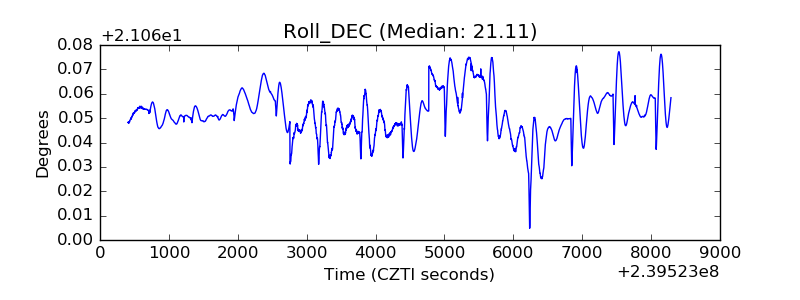 |
| _Roll_RA | 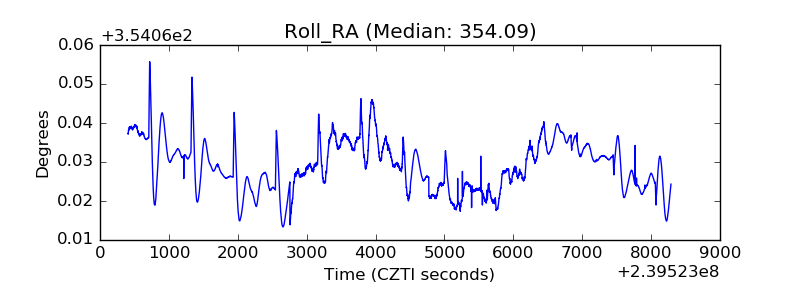 |
| Veto Counter | 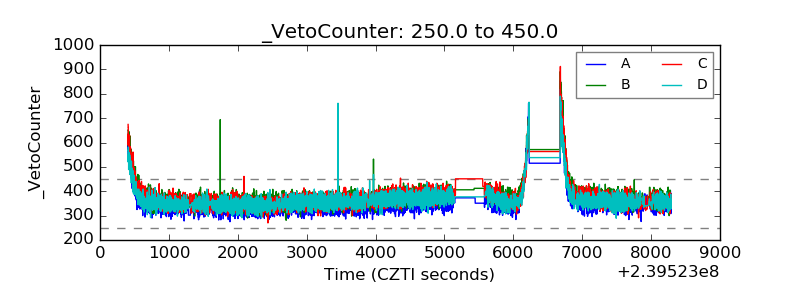 |