| Param | Original file | Final file |
|---|---|---|
| Filename | modeM0/AS1G07_002T02_9000001432_10010cztM0_level2.evt | modeM0/AS1G07_002T02_9000001432_10010cztM0_level2_quad_clean.evt |
| Size (bytes) | 104,993,280 | 8,856,000 |
| Size | 100.1 MB | 8.4 MB |
| Events in quadrant A | 688,545 | 41,439 |
| Events in quadrant B | 724,704 | 40,642 |
| Events in quadrant C | 651,604 | 39,635 |
| Events in quadrant D | 1,007,631 | 32,498 |
| Mode SS | |||
|---|---|---|---|
| Quadrant | BADHDUFLAG | Total packets | Discarded packets |
| A | 0 | 51 | 15 |
| B | 0 | 52 | 22 |
| C | 0 | 51 | 19 |
| D | 0 | 51 | 19 |
| Mode M0 | |||
|---|---|---|---|
| Quadrant | BADHDUFLAG | Total packets | Discarded packets |
| A | 0 | 5118 | 2025 |
| B | 0 | 5271 | 2110 |
| C | 0 | 5075 | 1975 |
| D | 0 | 7017 | 3068 |
| Quadrant | Total seconds | Saturated seconds | Saturation percentage |
|---|---|---|---|
| A | 1541 | 1 | 0.064893% |
| B | 1541 | 3 | 0.194679% |
| C | 1550 | 0 | 0.000000% |
| D | 1457 | 31 | 2.127660% |
Noise dominated data is calculated using 1-second bins in cleaned event files. If a bin has >2000 counts, and if more than 50% of those come from <1% of pixels, then it is considered to be noise-dominated and hence unusable.
| Quadrant | # 1 sec bins | Bins with >0 counts | Bins with >2000 counts | High rate bins dominated by noise | Noise dominated (total time) | Noise dominated (detector-on time) | Marked lightcurve |
|---|---|---|---|---|---|---|---|
| A | 2518 | 1865 | 0 | 0 | 0.00% | 0.00% | 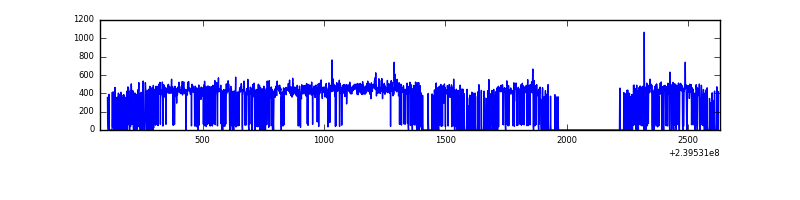 |
| B | 2551 | 1884 | 1 | 1 | 0.04% | 0.05% | 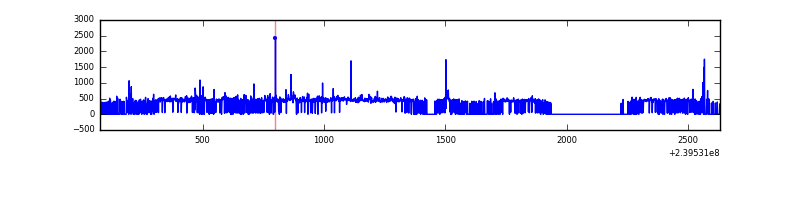 |
| C | 2537 | 1852 | 0 | 0 | 0.00% | 0.00% | 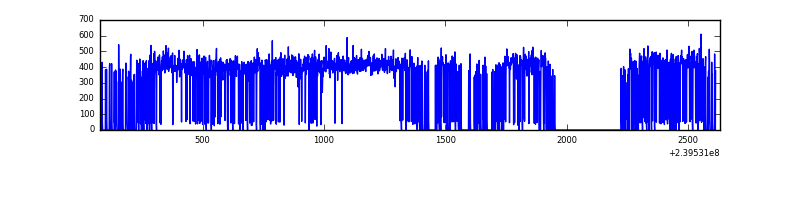 |
| D | 2537 | 1763 | 26 | 26 | 1.02% | 1.47% | 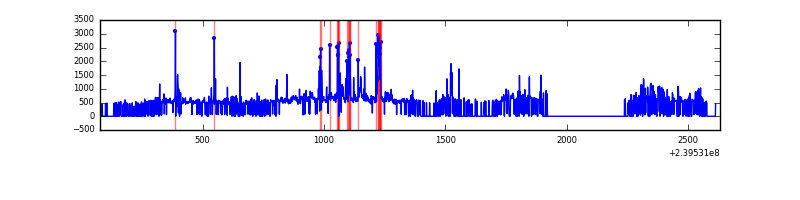 |
Top three noisy pixels from each quadrant. If the there are fewer than three noisy pixels in the level2.evt file, extra rows are filled as -1
| Pixel properties | Quadrant properties | ||||||
|---|---|---|---|---|---|---|---|
| Quadrant | DetID | PixID | Counts | Sigma | Mean | Median | Sigma |
| A | 8 | 15 | 13467 | 353.46 | 174 | 169 | 37.6 |
| A | 15 | 239 | 2288 | 56.32 | 174 | 169 | 37.6 |
| A | 13 | 251 | 2144 | 52.5 | 174 | 169 | 37.6 |
| B | 0 | 214 | 41543 | 1177.5 | 172 | 168 | 35.1 |
| B | 4 | 173 | 5527 | 152.51 | 172 | 168 | 35.1 |
| B | 12 | 111 | 3539 | 95.94 | 172 | 168 | 35.1 |
| C | 13 | 61 | 1246 | 26.58 | 166 | 167 | 40.6 |
| C | 14 | 67 | 842 | 16.63 | 166 | 167 | 40.6 |
| C | 8 | 222 | 469 | 7.44 | 166 | 167 | 40.6 |
| D | 8 | 195 | 147150 | 3659.54 | 156 | 152 | 40.2 |
| D | 10 | 118 | 112322 | 2792.49 | 156 | 152 | 40.2 |
| D | 2 | 16 | 98008 | 2436.14 | 156 | 152 | 40.2 |
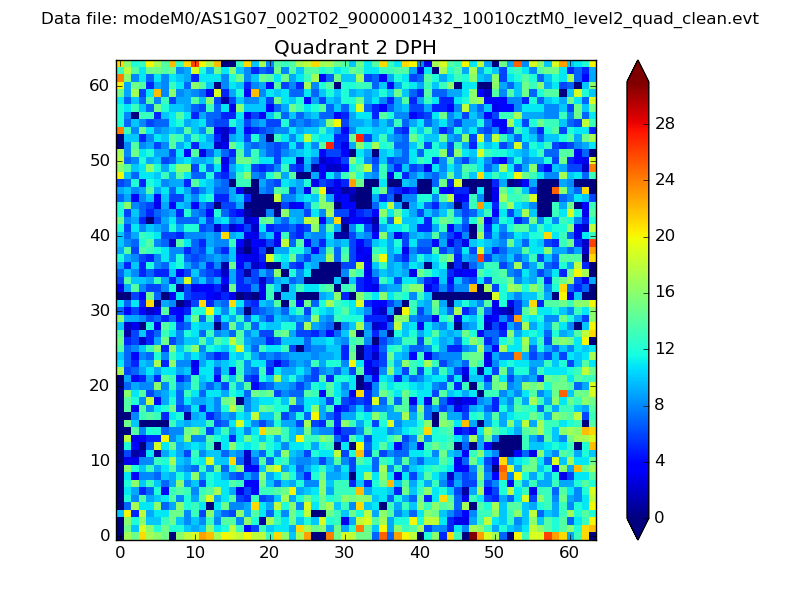
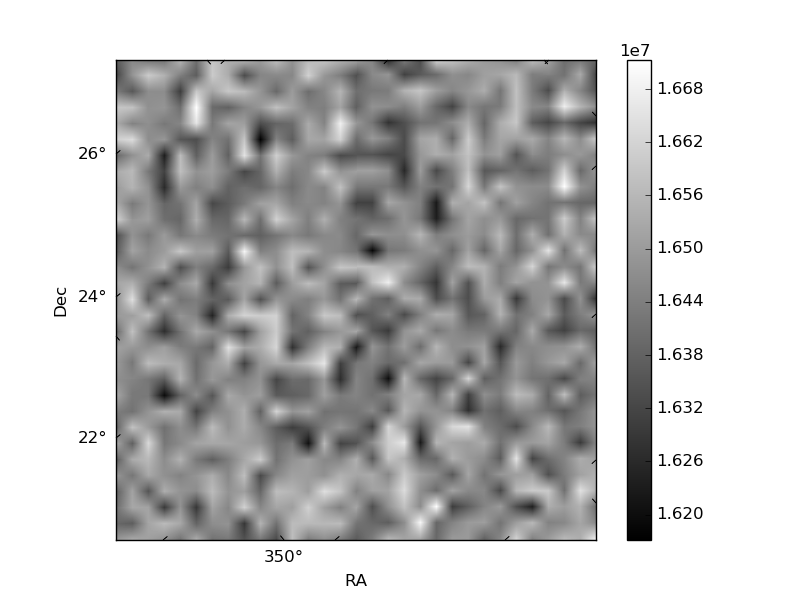
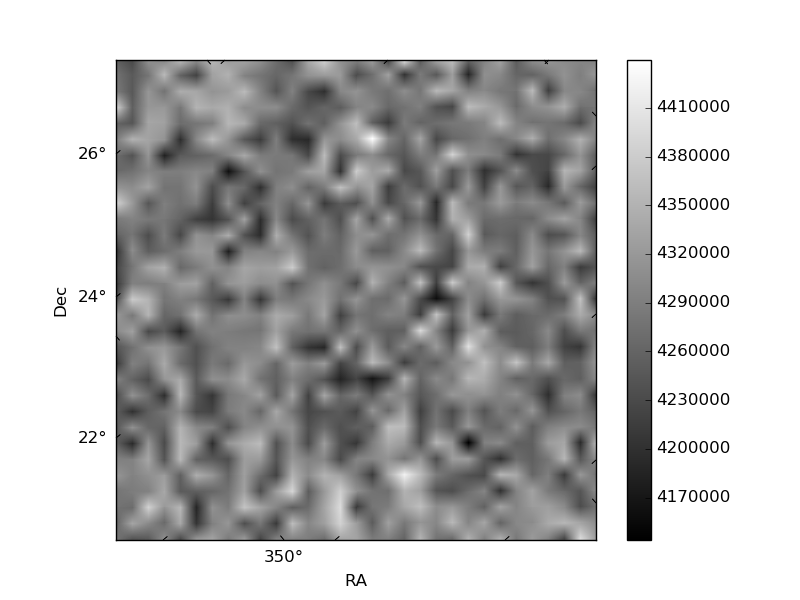
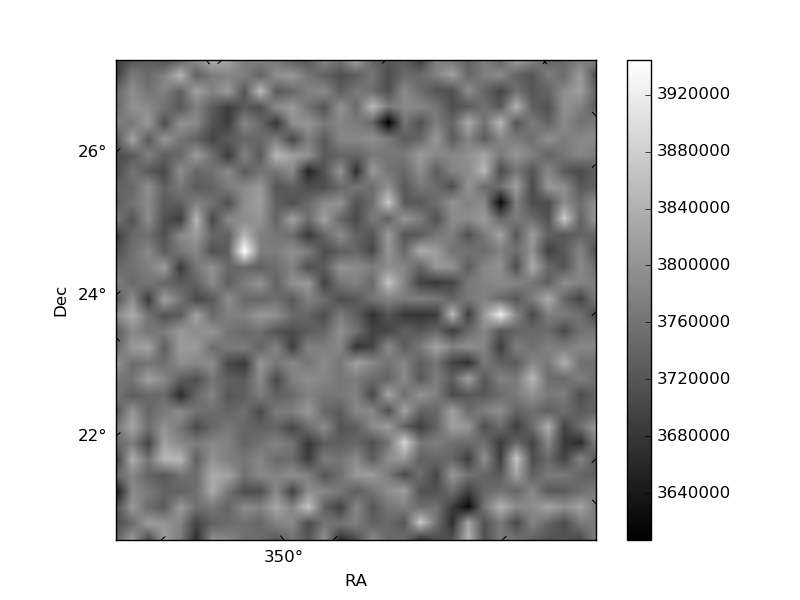
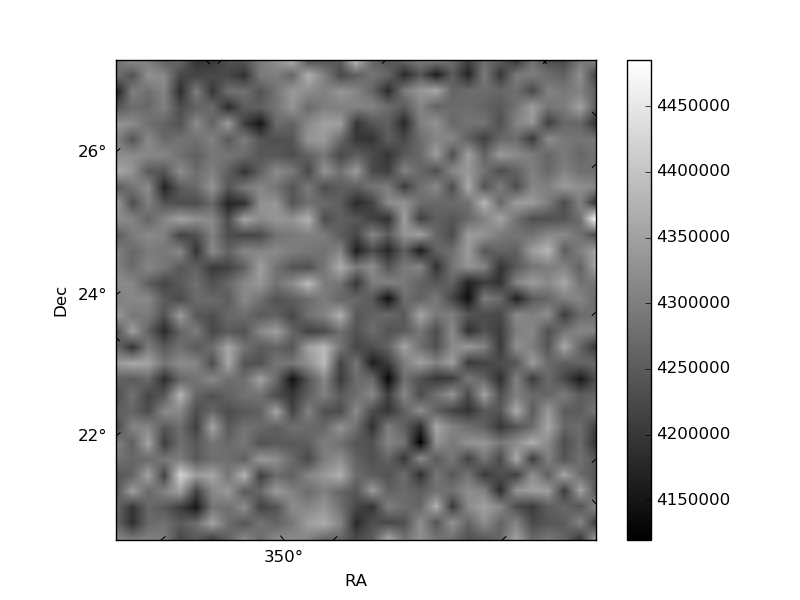
Histogram calculated using DETX and DETY for each event in the final _common_clean file
| Quadrant A | 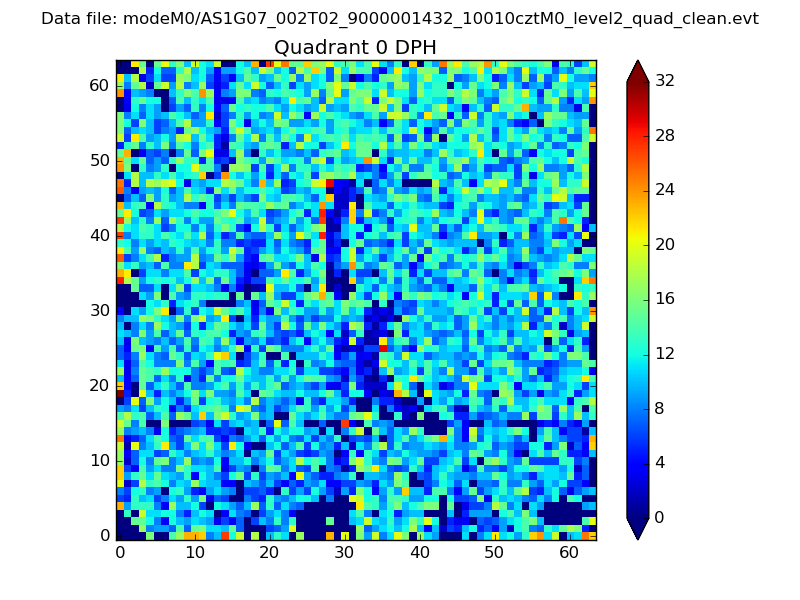 |
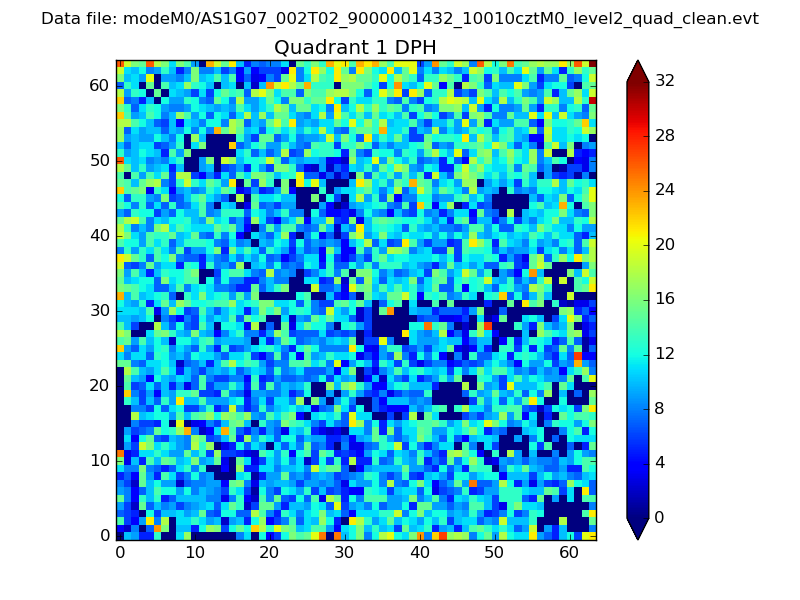 |
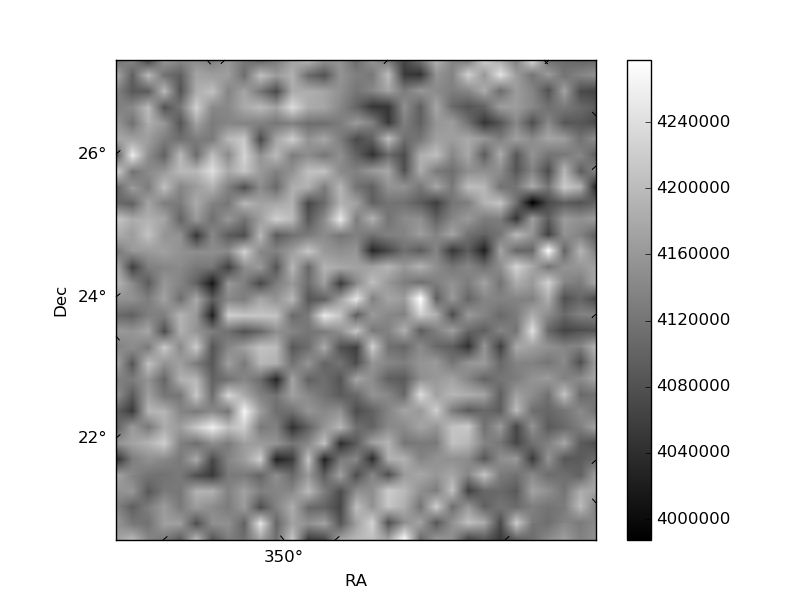
Quadrant B |
|---|---|---|---|
| Quadrant D | 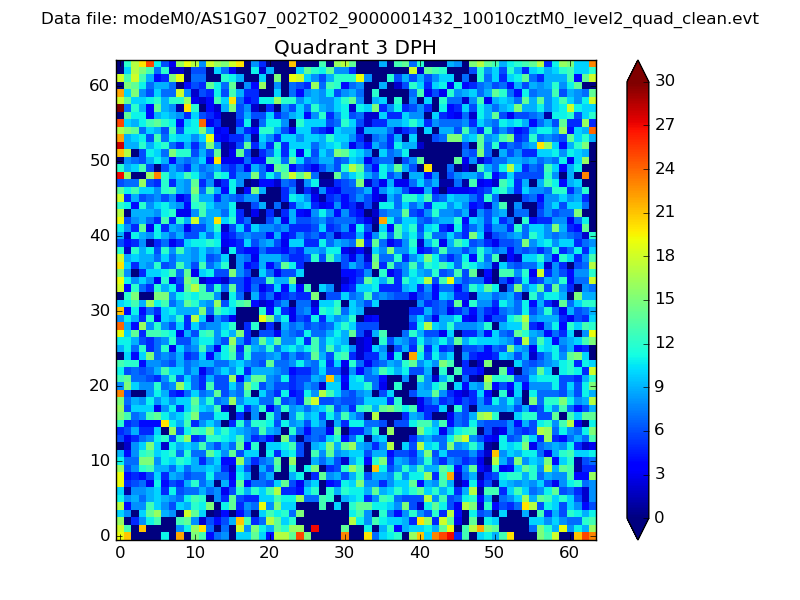 |
 |
Quadrant C |
| Plot type | Count rate plots | Images |
|---|---|---|
| Comparison with Poisson distribution Blue bars denote a histogram of data divided into 1 sec bins. Red curve is a Poisson curve with rate = median count rate of data. |
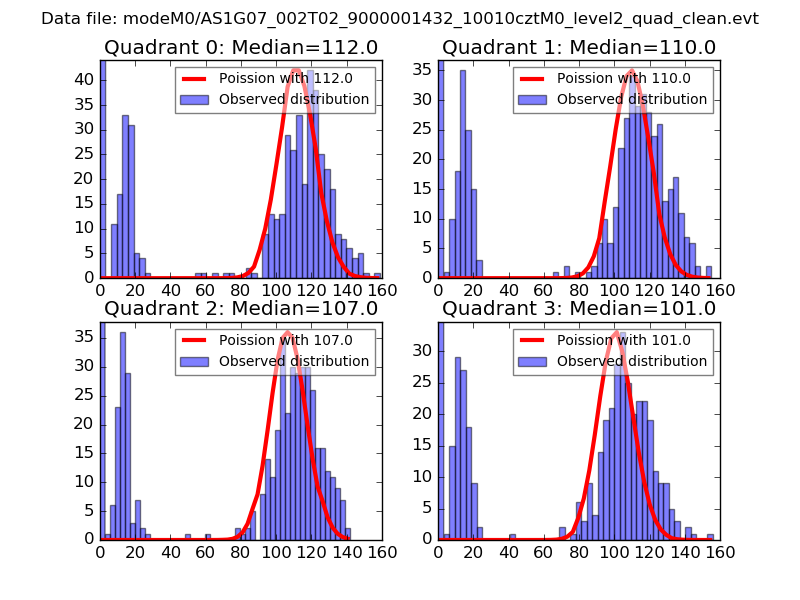 |
 |
| Quadrant-wise count rates Data is divided into 100 sec bins |
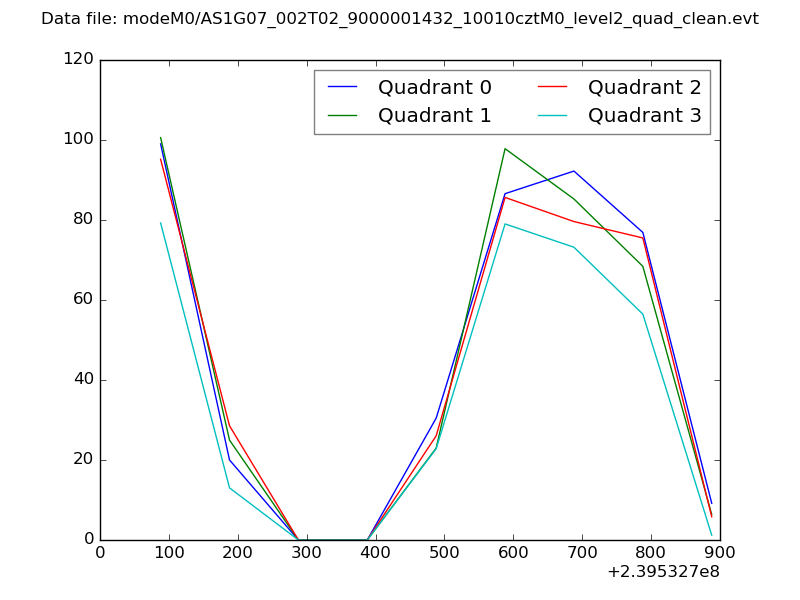 |
|
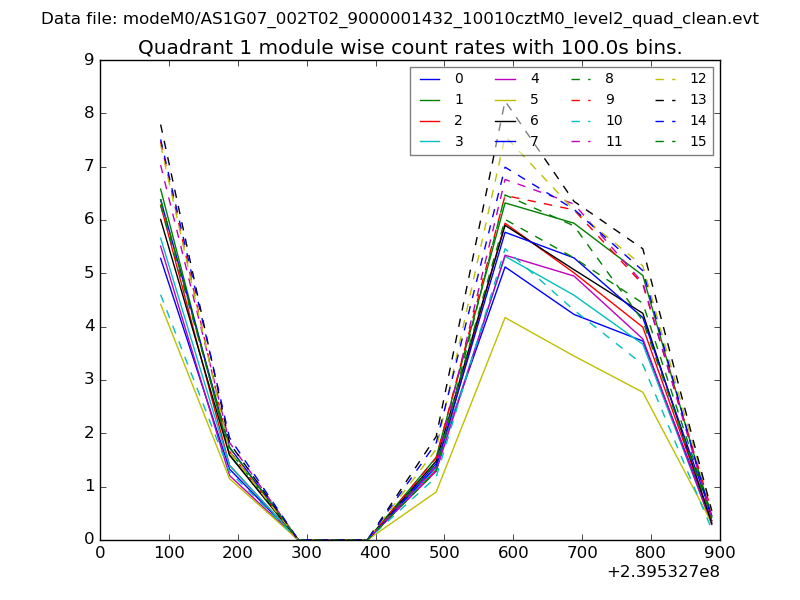
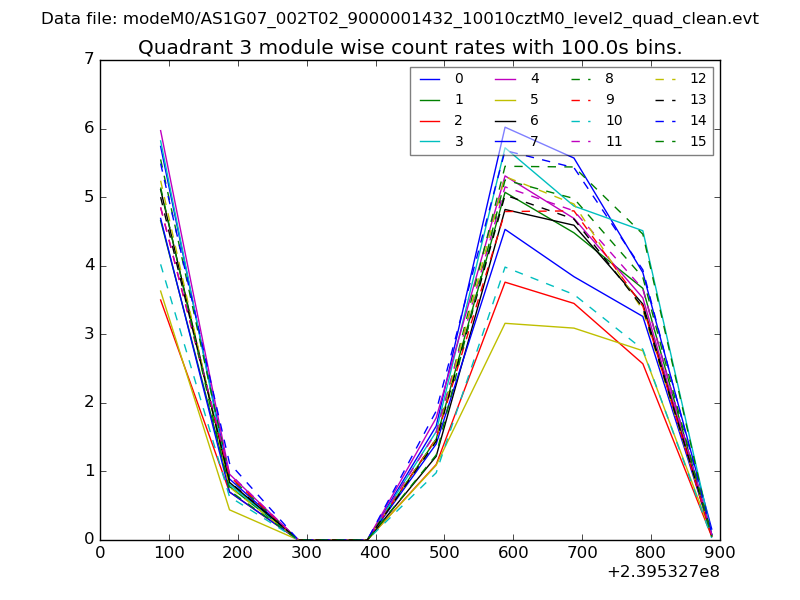
| Module-wise count rates for Quadrant A Data is divided into 100 sec bins |
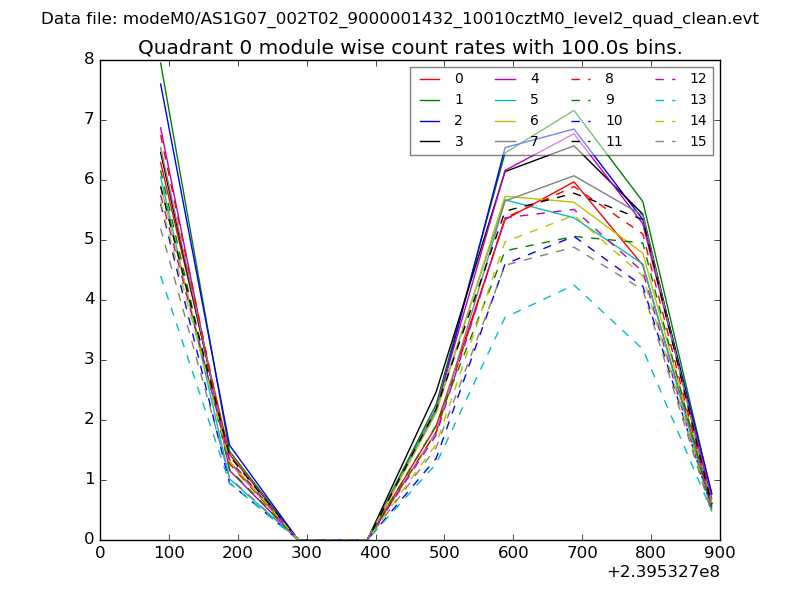 |
 |
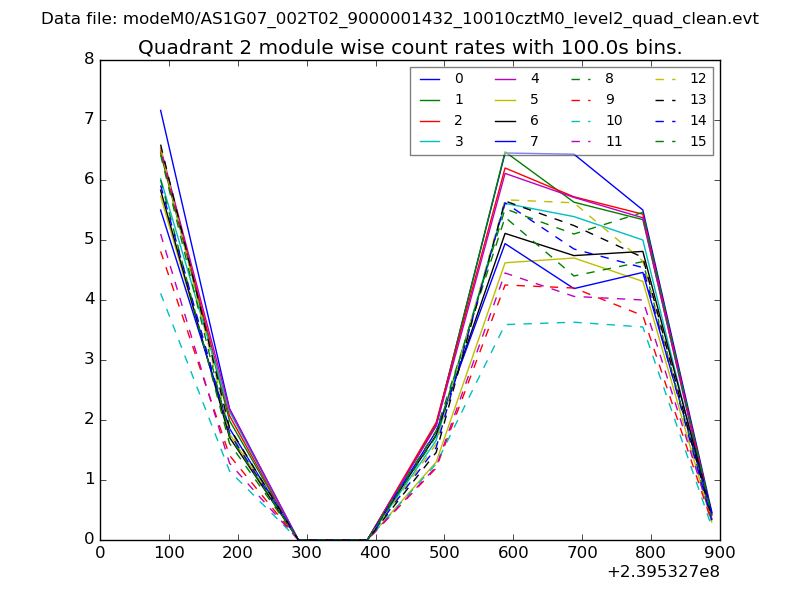
| Module-wise count rates for Quadrant B Data is divided into 100 sec bins |
 |
 |
| Module-wise count rates for Quadrant C Data is divided into 100 sec bins |
 |
 |
| Module-wise count rates for Quadrant D Data is divided into 100 sec bins |
 |
 |
| Parameter | Plot |
|---|---|
| CZT HV Monitor | 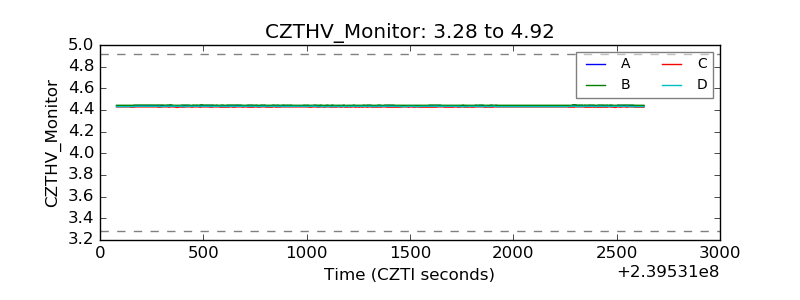 |
| D_VDD | 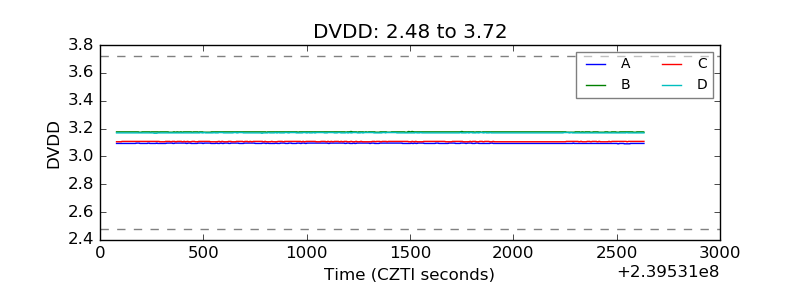 |
| Temperature 1 | 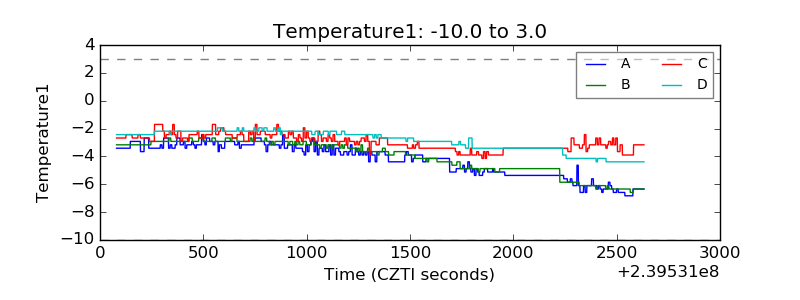 |
| Veto HV Monitor | 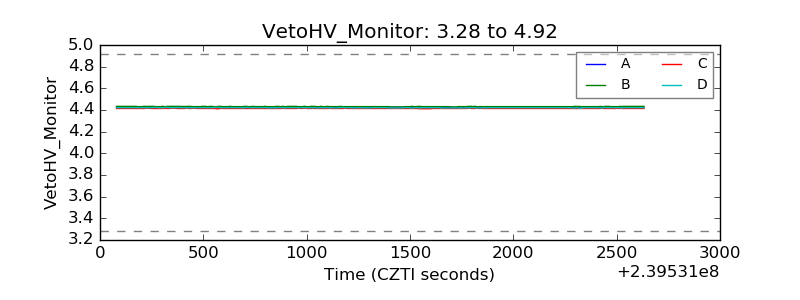 |
| Veto LLD | 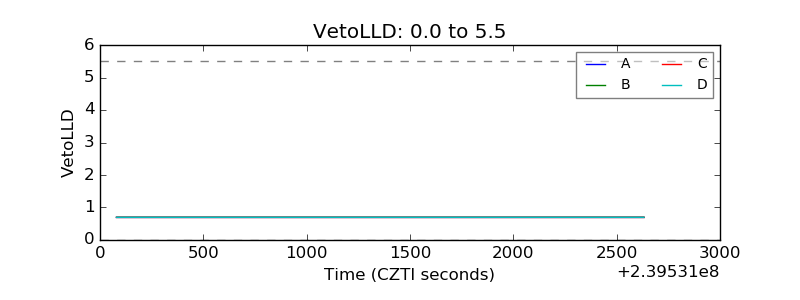 |
| Alpha Counter | 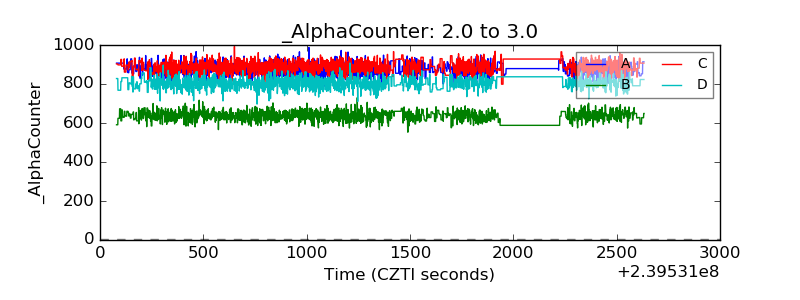 |
| _CPM_Rate | 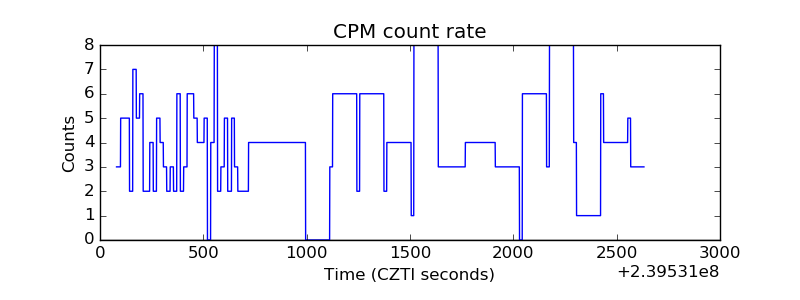 |
| CZT Counter | 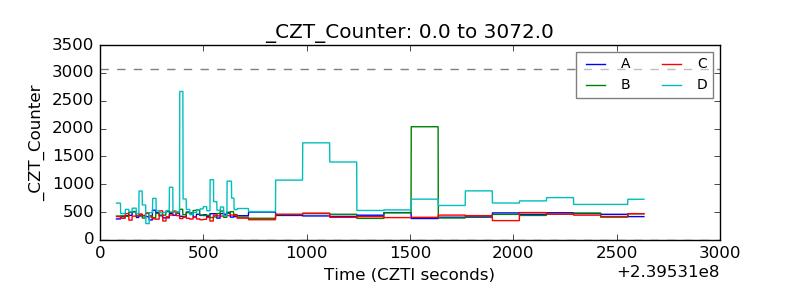 |
| +2.5 Volts monitor |  |
| +5 Volts monitor |  |
| _ROLL_ROT | 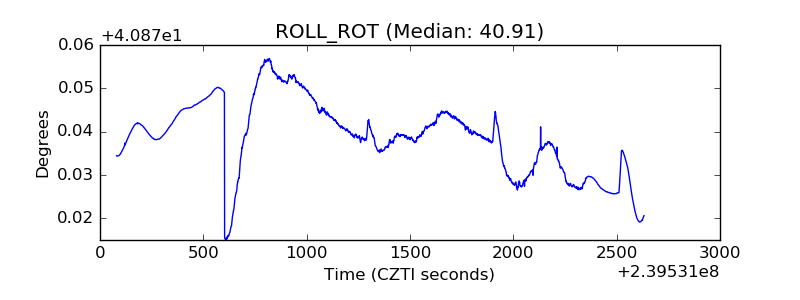 |
| _Roll_DEC | 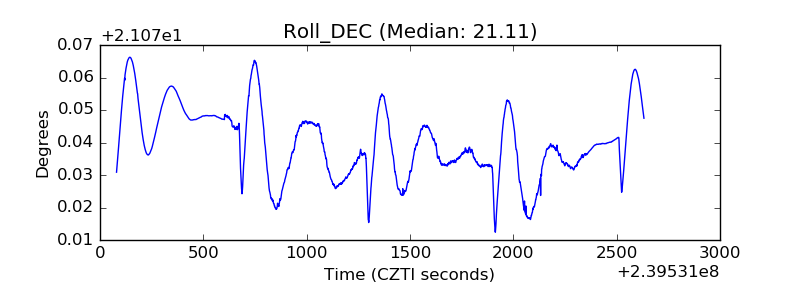 |
| _Roll_RA | 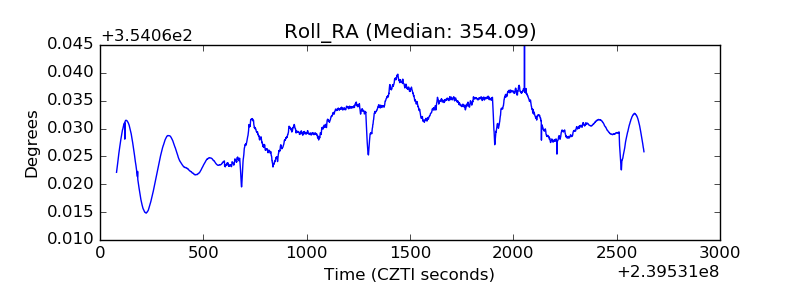 |
| Veto Counter | 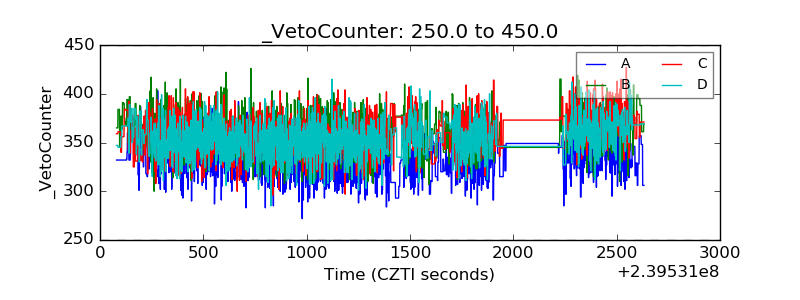 |