| Param | Original file | Final file |
|---|---|---|
| Filename | modeM0/AS1G07_002T02_9000001432_10014cztM0_level2.evt | modeM0/AS1G07_002T02_9000001432_10014cztM0_level2_quad_clean.evt |
| Size (bytes) | 1,532,545,920 | 239,535,360 |
| Size | 1.4 GB | 228.4 MB |
| Events in quadrant A | 10,000,163 | 1,459,413 |
| Events in quadrant B | 9,893,538 | 1,485,501 |
| Events in quadrant C | 9,339,663 | 1,461,432 |
| Events in quadrant D | 15,744,320 | 1,384,760 |
| Mode SS | |||
|---|---|---|---|
| Quadrant | BADHDUFLAG | Total packets | Discarded packets |
| A | 0 | 434 | 0 |
| B | 0 | 434 | 0 |
| C | 0 | 434 | 0 |
| D | 0 | 434 | 0 |
| Mode M0 | |||
|---|---|---|---|
| Quadrant | BADHDUFLAG | Total packets | Discarded packets |
| A | 0 | 43749 | 5 |
| B | 0 | 43918 | 7 |
| C | 0 | 43215 | 7 |
| D | 0 | 61139 | 6 |
| Mode M9 | |||
|---|---|---|---|
| Quadrant | BADHDUFLAG | Total packets | Discarded packets |
| A | 0 | 8 | 0 |
| B | 0 | 8 | 0 |
| C | 0 | 8 | 0 |
| D | 0 | 8 | 0 |
| Quadrant | Total seconds | Saturated seconds | Saturation percentage |
|---|---|---|---|
| A | 21239 | 366 | 1.723245% |
| B | 21238 | 398 | 1.873999% |
| C | 21238 | 218 | 1.026462% |
| D | 21239 | 922 | 4.341071% |
Noise dominated data is calculated using 1-second bins in cleaned event files. If a bin has >2000 counts, and if more than 50% of those come from <1% of pixels, then it is considered to be noise-dominated and hence unusable.
| Quadrant | # 1 sec bins | Bins with >0 counts | Bins with >2000 counts | High rate bins dominated by noise | Noise dominated (total time) | Noise dominated (detector-on time) | Marked lightcurve |
|---|---|---|---|---|---|---|---|
| A | 22160 | 21240 | 2 | 2 | 0.01% | 0.01% |  |
| B | 22160 | 21240 | 18 | 18 | 0.08% | 0.08% |  |
| C | 22160 | 21240 | 0 | 0 | 0.00% | 0.00% |  |
| D | 22160 | 21240 | 518 | 518 | 2.34% | 2.44% |  |
Top three noisy pixels from each quadrant. If the there are fewer than three noisy pixels in the level2.evt file, extra rows are filled as -1
| Pixel properties | Quadrant properties | ||||||
|---|---|---|---|---|---|---|---|
| Quadrant | DetID | PixID | Counts | Sigma | Mean | Median | Sigma |
| A | 8 | 15 | 465105 | 927.08 | 2458 | 2401 | 499.1 |
| A | 13 | 14 | 40551 | 76.44 | 2458 | 2401 | 499.1 |
| A | 0 | 226 | 22145 | 39.56 | 2458 | 2401 | 499.1 |
| B | 4 | 81 | 112248 | 231.3 | 2460 | 2393 | 475.0 |
| B | 0 | 214 | 70249 | 142.87 | 2460 | 2393 | 475.0 |
| B | 4 | 173 | 54884 | 110.52 | 2460 | 2393 | 475.0 |
| C | 13 | 61 | 17564 | 27.32 | 2389 | 2396 | 555.2 |
| C | 14 | 67 | 11678 | 16.72 | 2389 | 2396 | 555.2 |
| C | 8 | 222 | 9158 | 12.18 | 2389 | 2396 | 555.2 |
| D | 1 | 52 | 2296071 | 3867.07 | 2354 | 2293 | 593.2 |
| D | 8 | 195 | 1736172 | 2923.14 | 2354 | 2293 | 593.2 |
| D | 2 | 16 | 1130094 | 1901.35 | 2354 | 2293 | 593.2 |
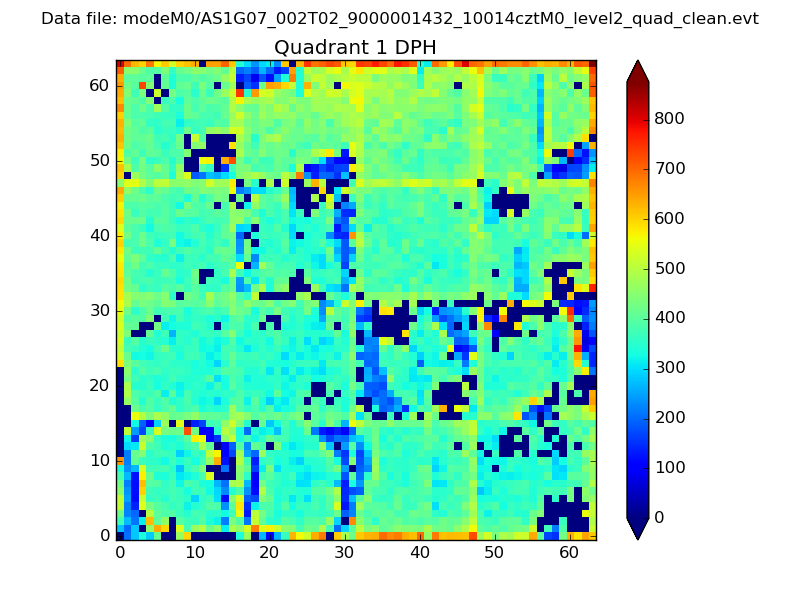
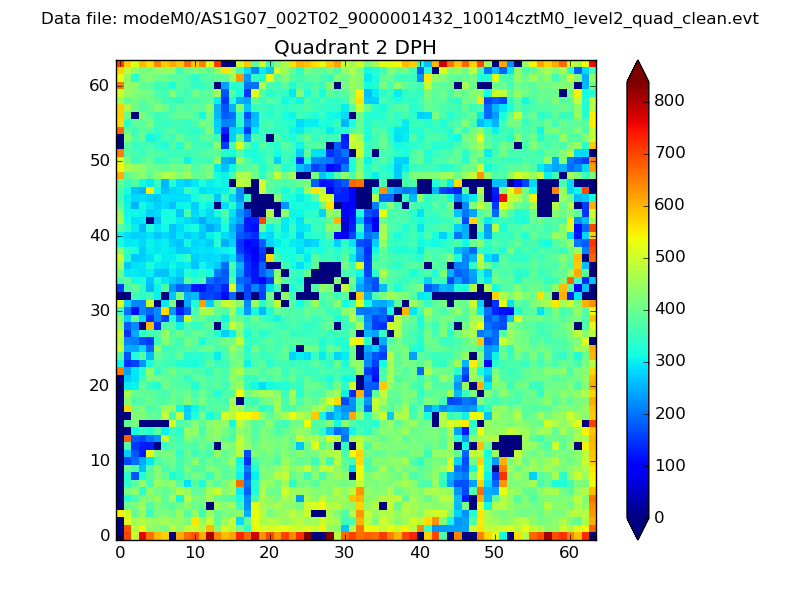
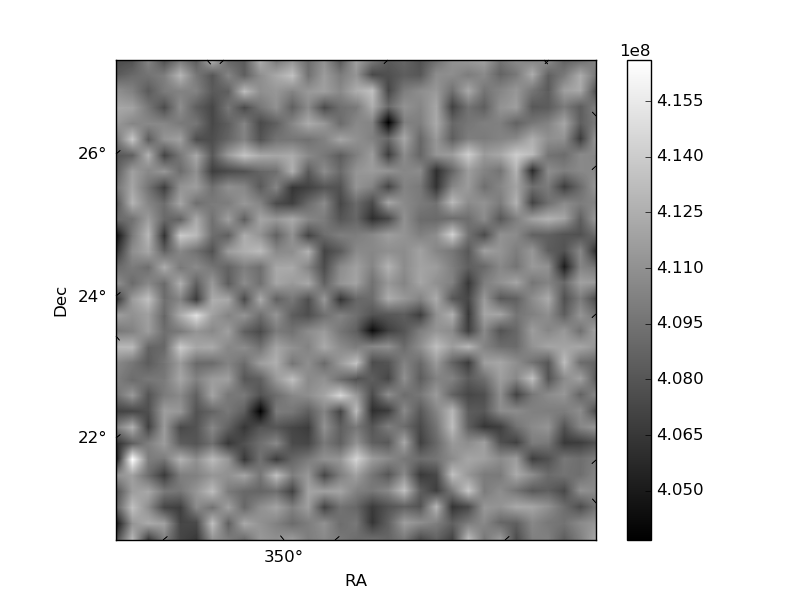
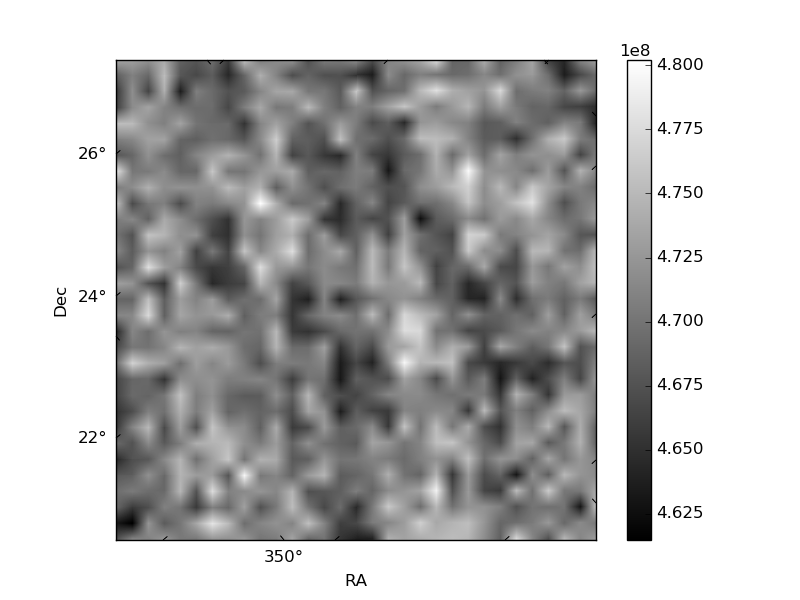
Histogram calculated using DETX and DETY for each event in the final _common_clean file
| Quadrant A |  |
 |
Quadrant B |
|---|---|---|---|
| Quadrant D |  |
 |
Quadrant C |
| Plot type | Count rate plots | Images |
|---|---|---|
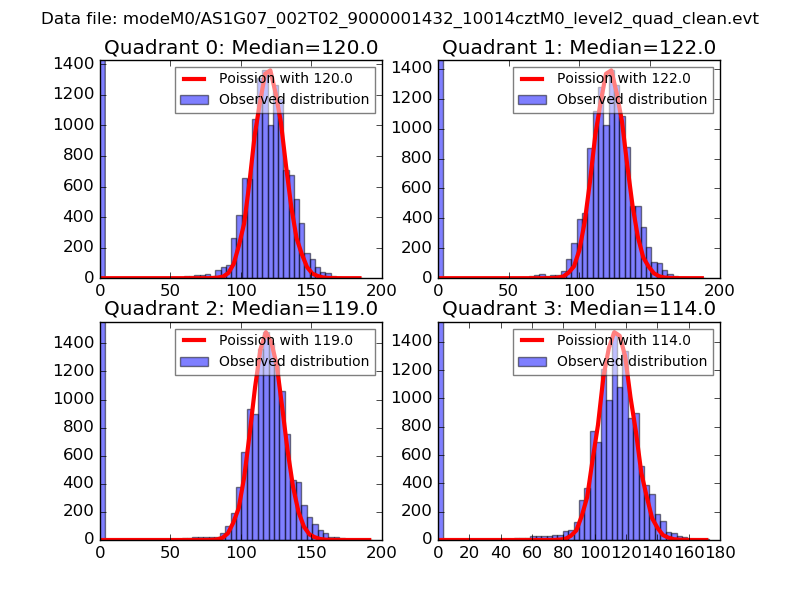
| Comparison with Poisson distribution Blue bars denote a histogram of data divided into 1 sec bins. Red curve is a Poisson curve with rate = median count rate of data. |
 |
 |
| Quadrant-wise count rates Data is divided into 100 sec bins |
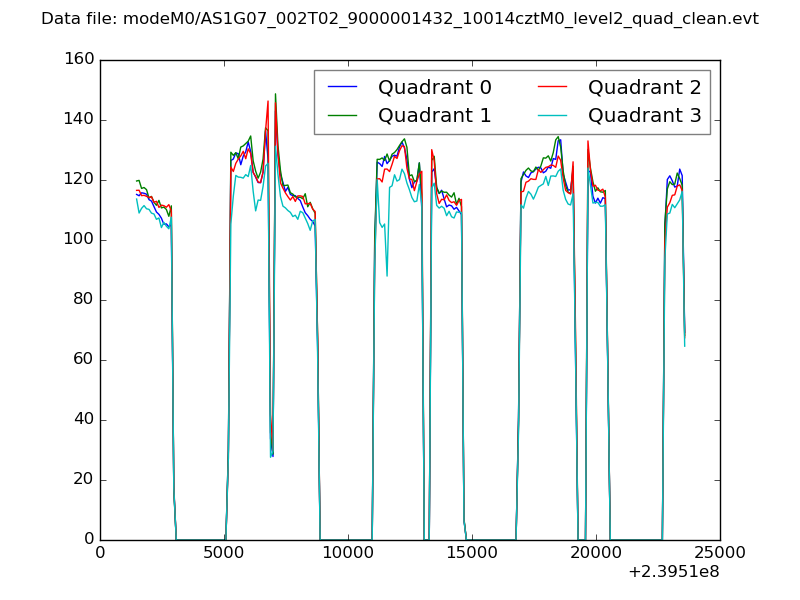 |
|
| Module-wise count rates for Quadrant A Data is divided into 100 sec bins |
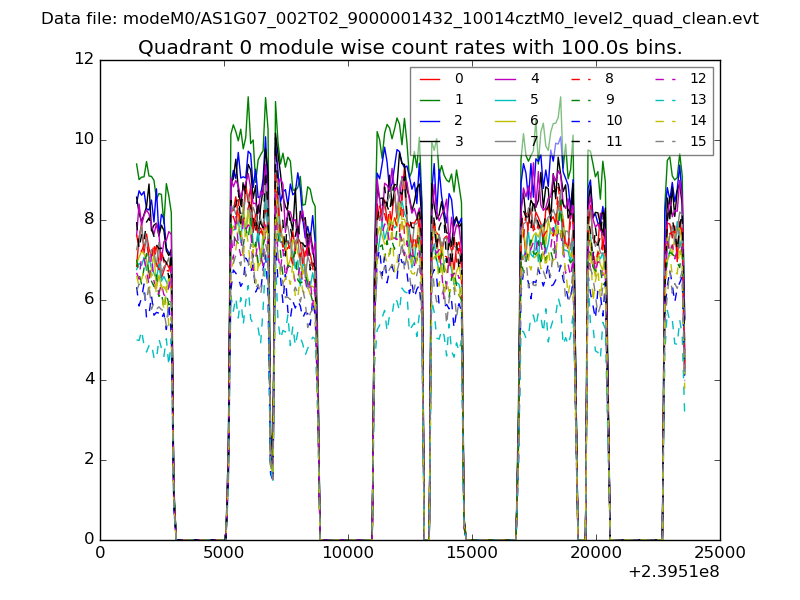 |
 |
| Module-wise count rates for Quadrant B Data is divided into 100 sec bins |
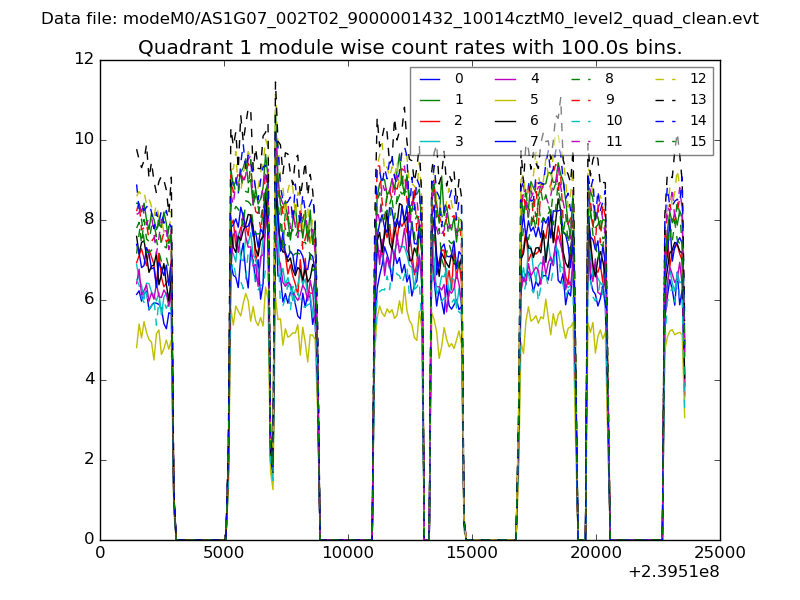 |
 |
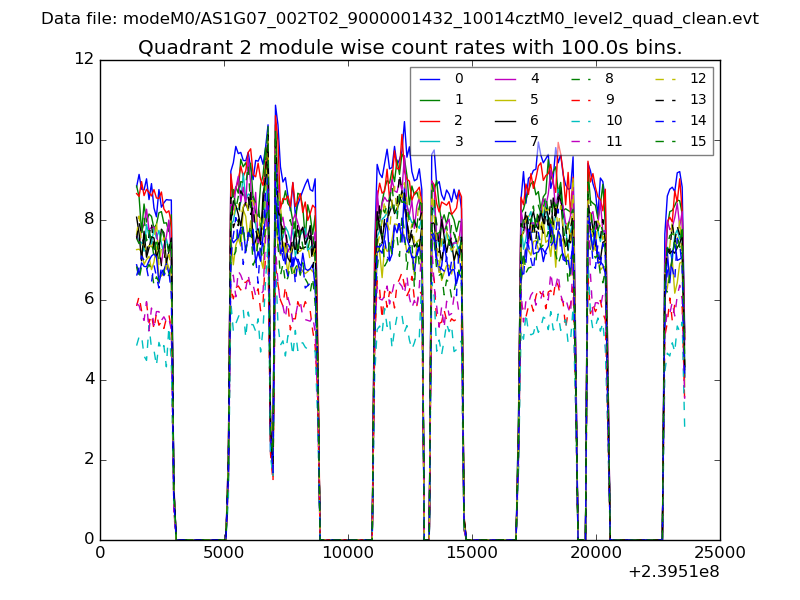
| Module-wise count rates for Quadrant C Data is divided into 100 sec bins |
 |
 |
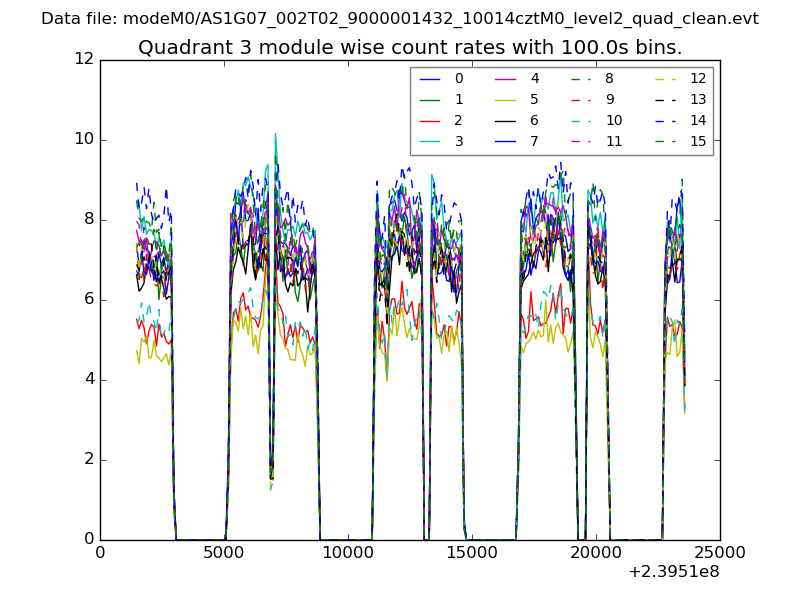
| Module-wise count rates for Quadrant D Data is divided into 100 sec bins |
 |
 |
| Parameter | Plot |
|---|---|
| CZT HV Monitor | 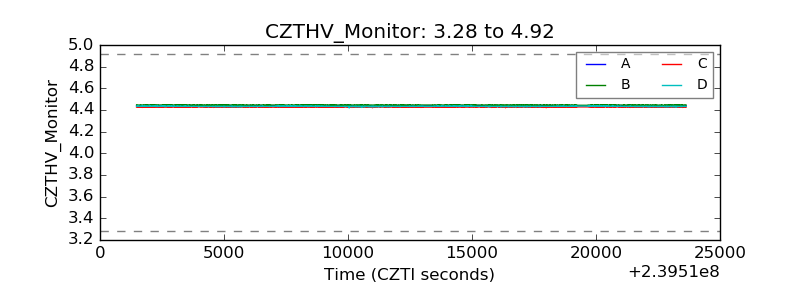 |
| D_VDD | 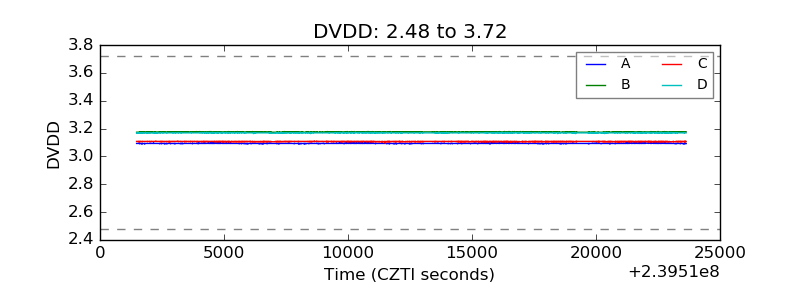 |
| Temperature 1 | 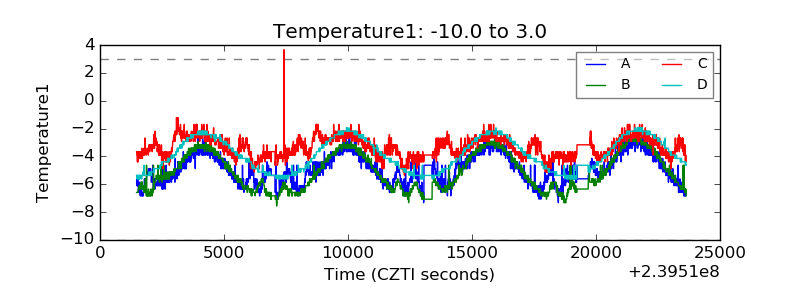 |
| Veto HV Monitor | 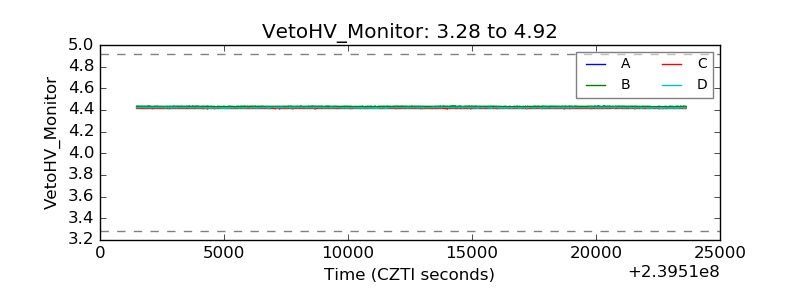 |
| Veto LLD | 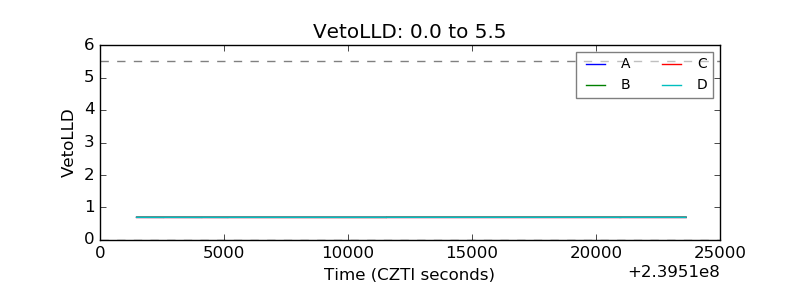 |
| Alpha Counter | 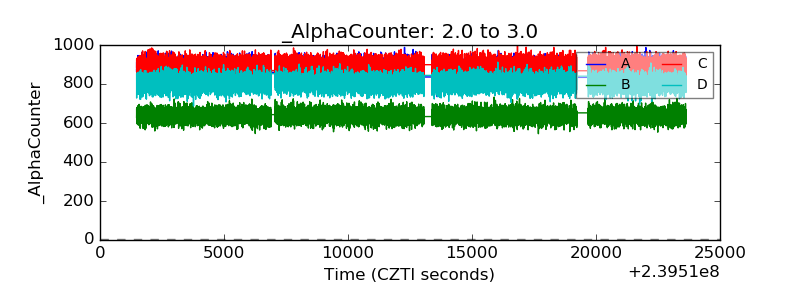 |
| _CPM_Rate | 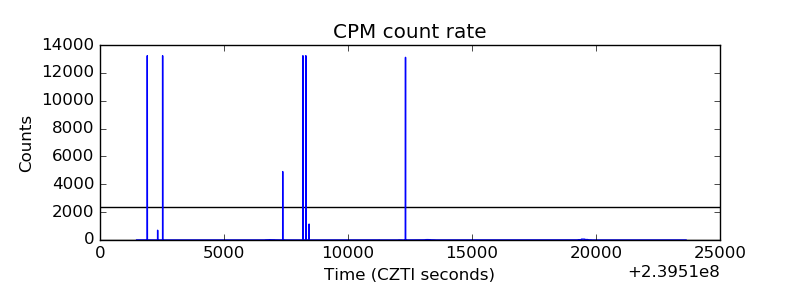 |
| CZT Counter | 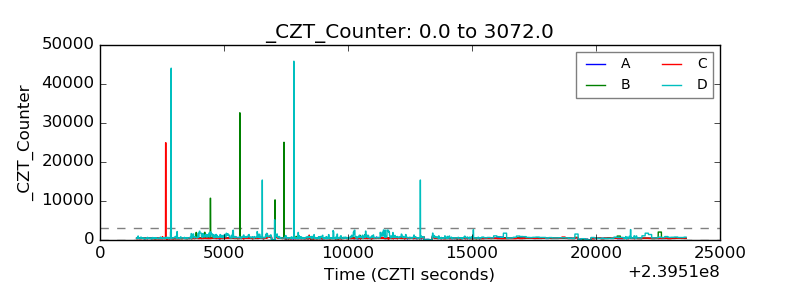 |
| +2.5 Volts monitor |  |
| +5 Volts monitor |  |
| _ROLL_ROT | 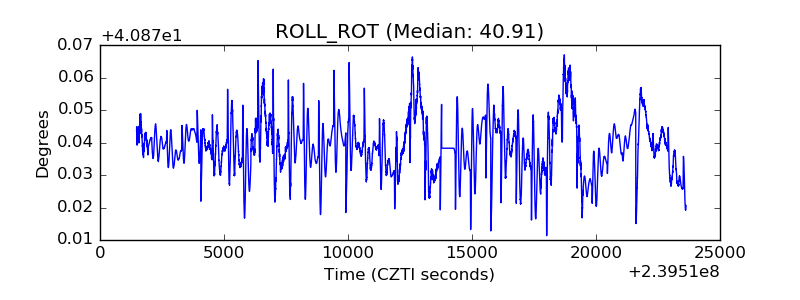 |
| _Roll_DEC | 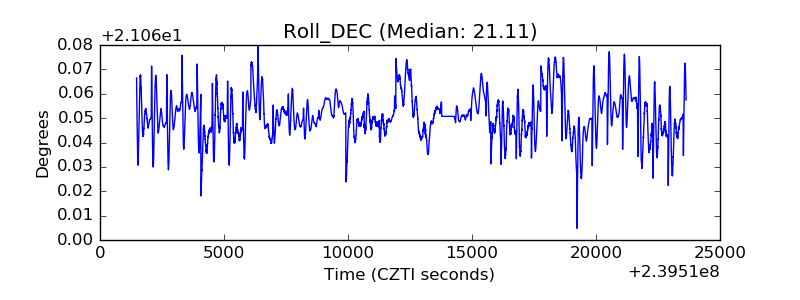 |
| _Roll_RA | 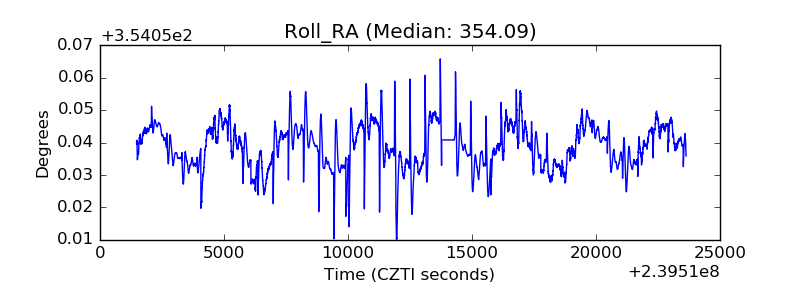 |
| Veto Counter | 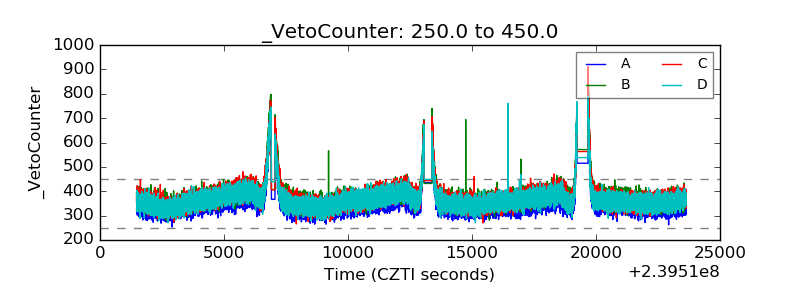 |