| Param | Original file | Final file |
|---|---|---|
| Filename | modeM0/AS1G07_005T01_9000001430cztM0_level2.fits | modeM0/AS1G07_005T01_9000001430cztM0_level2_quad_clean.evt |
| Size (bytes) | 179,101,440 | 161,795,520 |
| Size | 170.8 MB | 154.3 MB |
| Events in quadrant A | 1,059,870 | 930,211 |
| Events in quadrant B | 1,072,494 | 951,716 |
| Events in quadrant C | 1,056,058 | 878,383 |
| Events in quadrant D | 897,798 | 801,288 |
| Mode M9 | |||
|---|---|---|---|
| Quadrant | BADHDUFLAG | Total packets | Discarded packets |
| A | 0 | 34 | 0 |
| B | 0 | 34 | 0 |
| C | 0 | 34 | 0 |
| D | 0 | 34 | 0 |
| Mode M0 | |||
|---|---|---|---|
| Quadrant | BADHDUFLAG | Total packets | Discarded packets |
| A | 0 | 42045 | 0 |
| B | 0 | 43493 | 0 |
| C | 0 | 39553 | 0 |
| D | 0 | 50718 | 0 |
| Mode SS | |||
|---|---|---|---|
| Quadrant | BADHDUFLAG | Total packets | Discarded packets |
| A | 0 | 396 | 0 |
| B | 0 | 396 | 0 |
| C | 0 | 396 | 0 |
| D | 0 | 396 | 0 |
| Quadrant | Total seconds | Saturated seconds | Saturation percentage |
|---|---|---|---|
| A | 19426 | 230 | 1.183980% |
| B | 19418 | 497 | 2.559481% |
| C | 19425 | 149 | 0.767053% |
| D | 19404 | 720 | 3.710575% |
Noise dominated data is calculated using 1-second bins in cleaned event files. If a bin has >2000 counts, and if more than 50% of those come from <1% of pixels, then it is considered to be noise-dominated and hence unusable.
| Quadrant | # 1 sec bins | Bins with >0 counts | Bins with >2000 counts | High rate bins dominated by noise | Noise dominated (total time) | Noise dominated (detector-on time) | Marked lightcurve |
|---|---|---|---|---|---|---|---|
| A | 22788 | 19442 | 0 | 0 | 0.00% | 0.00% | 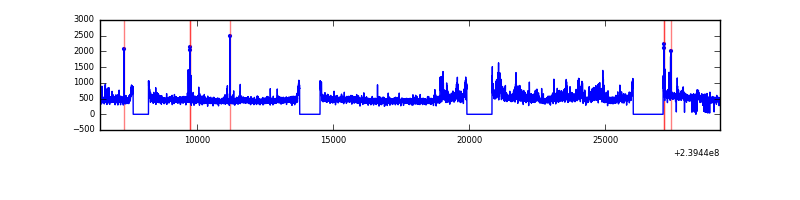 |
| B | 22788 | 19436 | 0 | 0 | 0.00% | 0.00% |  |
| C | 22788 | 19443 | 0 | 0 | 0.00% | 0.00% | 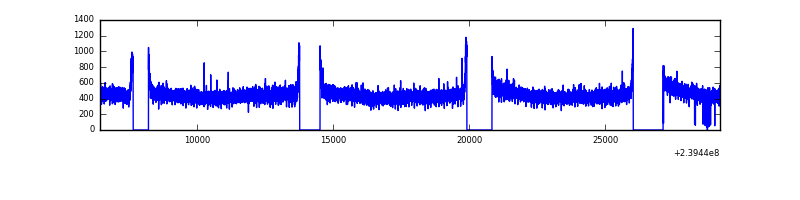 |
| D | 22787 | 19422 | 0 | 0 | 0.00% | 0.00% |  |
Top three noisy pixels from each quadrant. If the there are fewer than three noisy pixels in the level2.evt file, extra rows are filled as -1
| Pixel properties | Quadrant properties | ||||||
|---|---|---|---|---|---|---|---|
| Quadrant | DetID | PixID | Counts | Sigma | Mean | Median | Sigma |
| A | 0 | 29 | 992 | 10.16 | 276 | 257 | 72.3 |
| A | 7 | 110 | 860 | 8.34 | 276 | 257 | 72.3 |
| A | 0 | 30 | 777 | 7.19 | 276 | 257 | 72.3 |
| B | 2 | 9 | 910 | 11.38 | 283 | 269 | 56.3 |
| B | 12 | 226 | 716 | 7.93 | 283 | 269 | 56.3 |
| B | 5 | 225 | 714 | 7.9 | 283 | 269 | 56.3 |
| C | 12 | 241 | 750 | 6.56 | 279 | 258 | 75.0 |
| C | 3 | 158 | 732 | 6.32 | 279 | 258 | 75.0 |
| C | 9 | 188 | 710 | 6.03 | 279 | 258 | 75.0 |
| D | 3 | 14 | 668 | 6.27 | 255 | 231 | 69.7 |
| D | 6 | 231 | 648 | 5.99 | 255 | 231 | 69.7 |
| D | 7 | 3 | 643 | 5.91 | 255 | 231 | 69.7 |
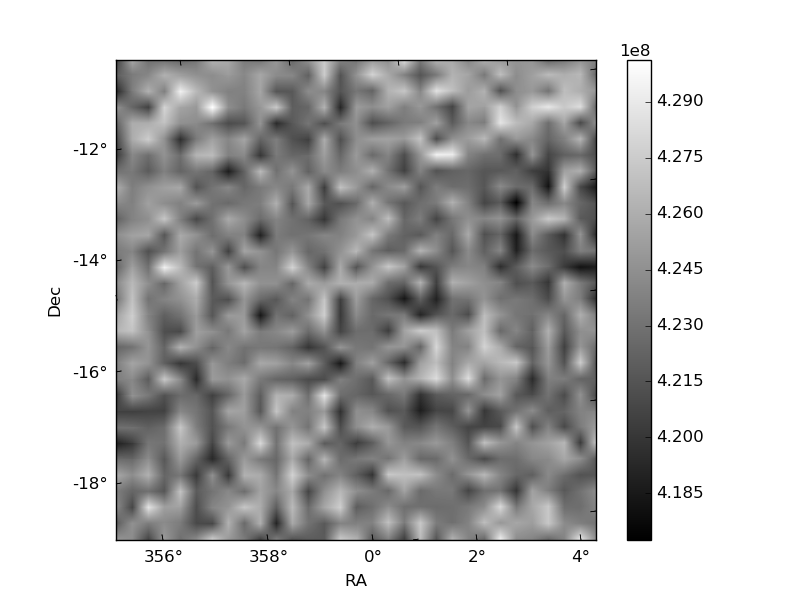
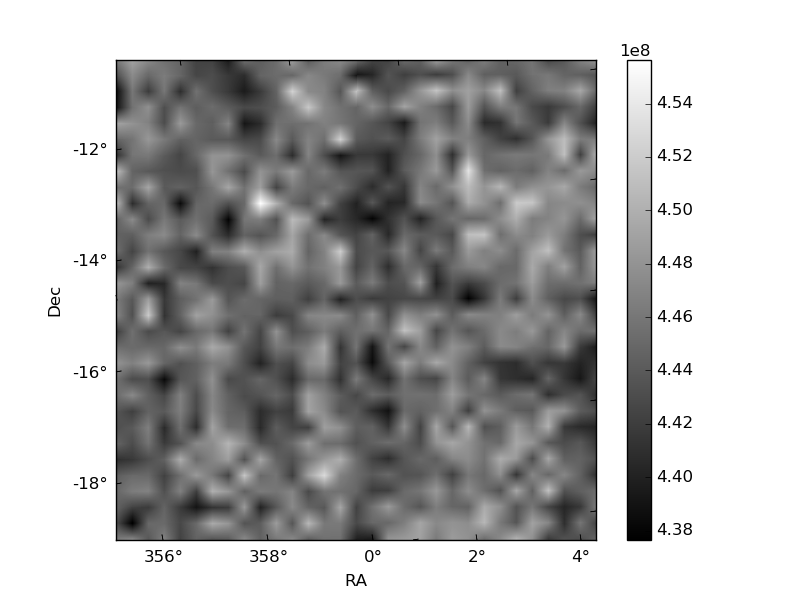
Histogram calculated using DETX and DETY for each event in the final _common_clean file
| Quadrant A |  |
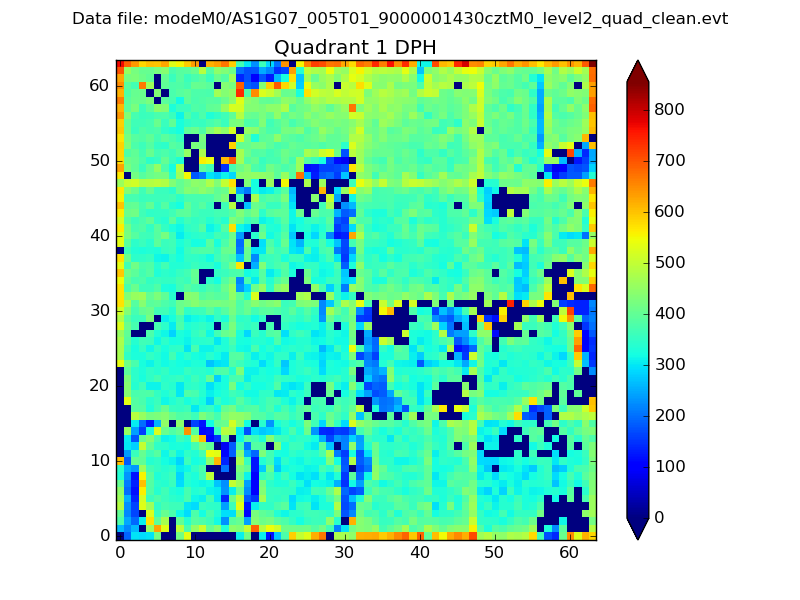 |
Quadrant B |
|---|---|---|---|
| Quadrant D | 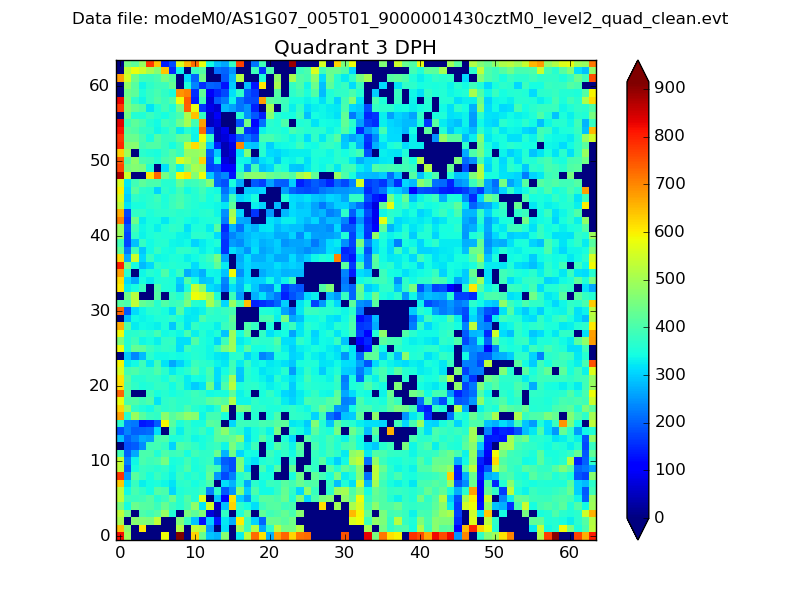 |
 |
Quadrant C |
| Plot type | Count rate plots | Images |
|---|---|---|
| Comparison with Poisson distribution Blue bars denote a histogram of data divided into 1 sec bins. Red curve is a Poisson curve with rate = median count rate of data. |
 |
 |
| Quadrant-wise count rates Data is divided into 100 sec bins |
 |
|
| Module-wise count rates for Quadrant A Data is divided into 100 sec bins |
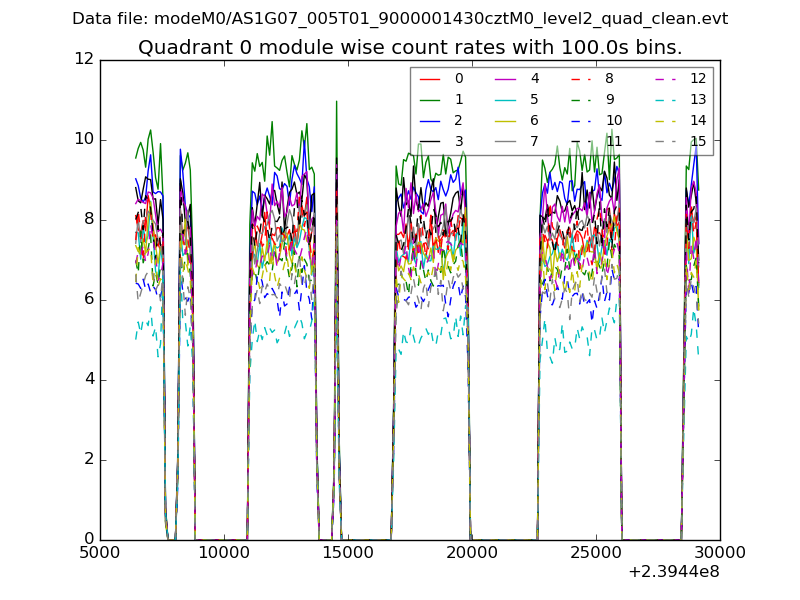 |
 |
| Module-wise count rates for Quadrant B Data is divided into 100 sec bins |
 |
 |
| Module-wise count rates for Quadrant C Data is divided into 100 sec bins |
 |
 |
| Module-wise count rates for Quadrant D Data is divided into 100 sec bins |
 |
 |
| Parameter | Plot |
|---|---|
| CZT HV Monitor | 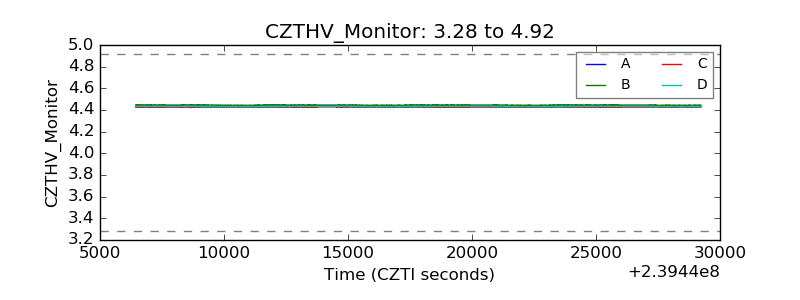 |
| D_VDD |  |
| Temperature 1 | 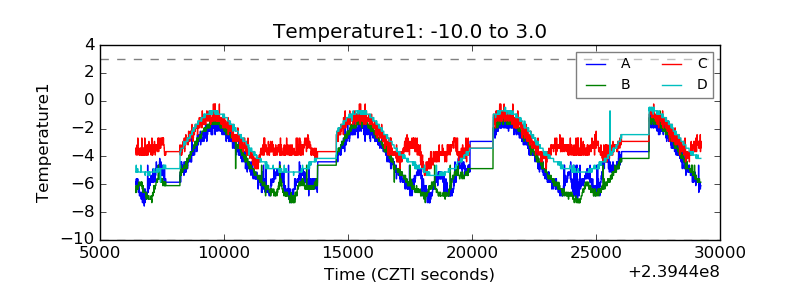 |
| Veto HV Monitor |  |
| Veto LLD |  |
| Alpha Counter | 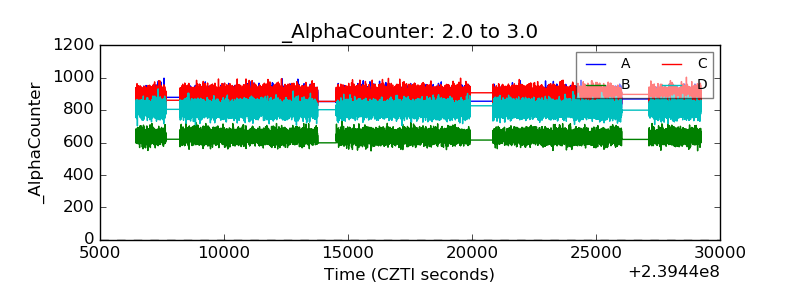 |
| _CPM_Rate | 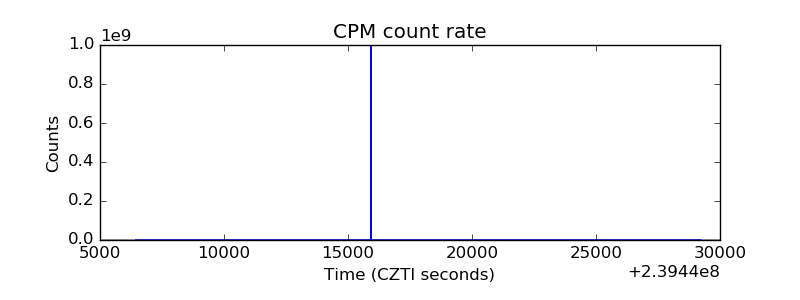 |
| CZT Counter |  |
| +2.5 Volts monitor |  |
| +5 Volts monitor |  |
| _ROLL_ROT | 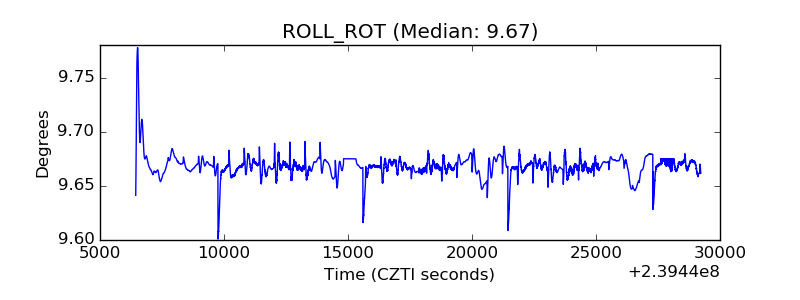 |
| _Roll_DEC |  |
| _Roll_RA |  |
| Veto Counter |  |