| Param | Original file | Final file |
|---|---|---|
| Filename | modeM0/AS1G07_005T01_9000001430_09996cztM0_level2.evt | modeM0/AS1G07_005T01_9000001430_09996cztM0_level2_quad_clean.evt |
| Size (bytes) | 81,912,960 | 12,936,960 |
| Size | 78.1 MB | 12.3 MB |
| Events in quadrant A | 596,510 | 75,700 |
| Events in quadrant B | 602,662 | 71,381 |
| Events in quadrant C | 615,265 | 81,845 |
| Events in quadrant D | 579,502 | 70,211 |
| Mode M9 | |||
|---|---|---|---|
| Quadrant | BADHDUFLAG | Total packets | Discarded packets |
| A | 0 | 17 | 7 |
| B | 0 | 18 | 9 |
| C | 0 | 17 | 7 |
| D | 0 | 17 | 8 |
| Mode M0 | |||
|---|---|---|---|
| Quadrant | BADHDUFLAG | Total packets | Discarded packets |
| A | 0 | 24435 | 21830 |
| B | 0 | 26066 | 23522 |
| C | 0 | 23390 | 20661 |
| D | 0 | 28621 | 26173 |
| Mode SS | |||
|---|---|---|---|
| Quadrant | BADHDUFLAG | Total packets | Discarded packets |
| A | 0 | 231 | 202 |
| B | 0 | 234 | 197 |
| C | 0 | 229 | 201 |
| D | 0 | 236 | 210 |
| Quadrant | Total seconds | Saturated seconds | Saturation percentage |
|---|---|---|---|
| A | 1205 | 32 | 2.655602% |
| B | 1180 | 38 | 3.220339% |
| C | 1322 | 24 | 1.815431% |
| D | 1100 | 34 | 3.090909% |
Noise dominated data is calculated using 1-second bins in cleaned event files. If a bin has >2000 counts, and if more than 50% of those come from <1% of pixels, then it is considered to be noise-dominated and hence unusable.
| Quadrant | # 1 sec bins | Bins with >0 counts | Bins with >2000 counts | High rate bins dominated by noise | Noise dominated (total time) | Noise dominated (detector-on time) | Marked lightcurve |
|---|---|---|---|---|---|---|---|
| A | 12444 | 1938 | 0 | 0 | 0.00% | 0.00% | 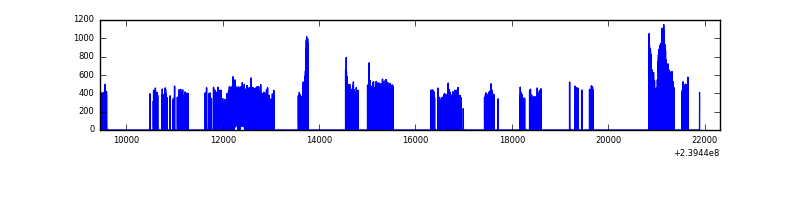 |
| B | 12376 | 1921 | 0 | 0 | 0.00% | 0.00% | 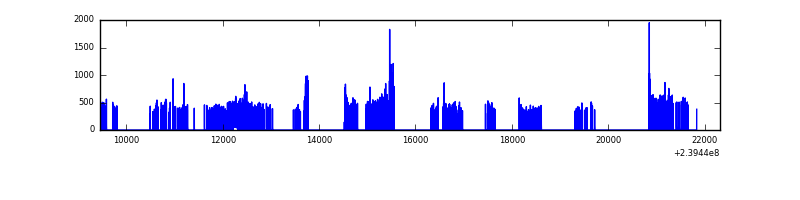 |
| C | 12414 | 2093 | 0 | 0 | 0.00% | 0.00% | 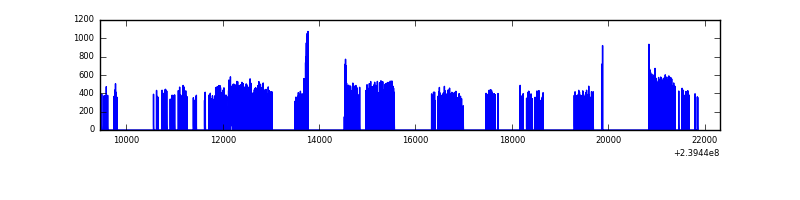 |
| D | 12852 | 1767 | 1 | 1 | 0.01% | 0.06% | 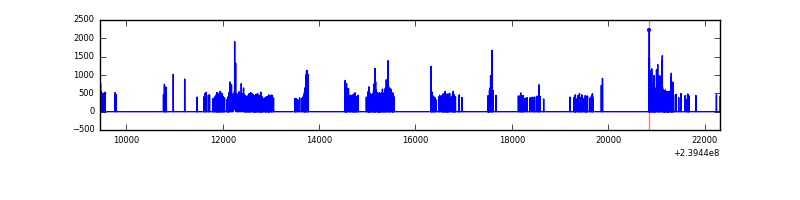 |
Top three noisy pixels from each quadrant. If the there are fewer than three noisy pixels in the level2.evt file, extra rows are filled as -1
| Pixel properties | Quadrant properties | ||||||
|---|---|---|---|---|---|---|---|
| Quadrant | DetID | PixID | Counts | Sigma | Mean | Median | Sigma |
| A | 8 | 15 | 32894 | 1015.98 | 145 | 142 | 32.2 |
| A | 0 | 226 | 1345 | 37.32 | 145 | 142 | 32.2 |
| A | 12 | 194 | 1198 | 32.76 | 145 | 142 | 32.2 |
| B | 4 | 239 | 25146 | 824.06 | 144 | 140 | 30.3 |
| B | 0 | 219 | 5074 | 162.6 | 144 | 140 | 30.3 |
| B | 12 | 111 | 3097 | 97.45 | 144 | 140 | 30.3 |
| C | 13 | 61 | 1156 | 26.02 | 157 | 158 | 38.4 |
| C | 8 | 222 | 692 | 13.92 | 157 | 158 | 38.4 |
| C | 14 | 67 | 617 | 11.97 | 157 | 158 | 38.4 |
| D | 1 | 52 | 32595 | 914.79 | 130 | 127 | 35.5 |
| D | 8 | 195 | 21418 | 599.87 | 130 | 127 | 35.5 |
| D | 12 | 233 | 12289 | 342.66 | 130 | 127 | 35.5 |
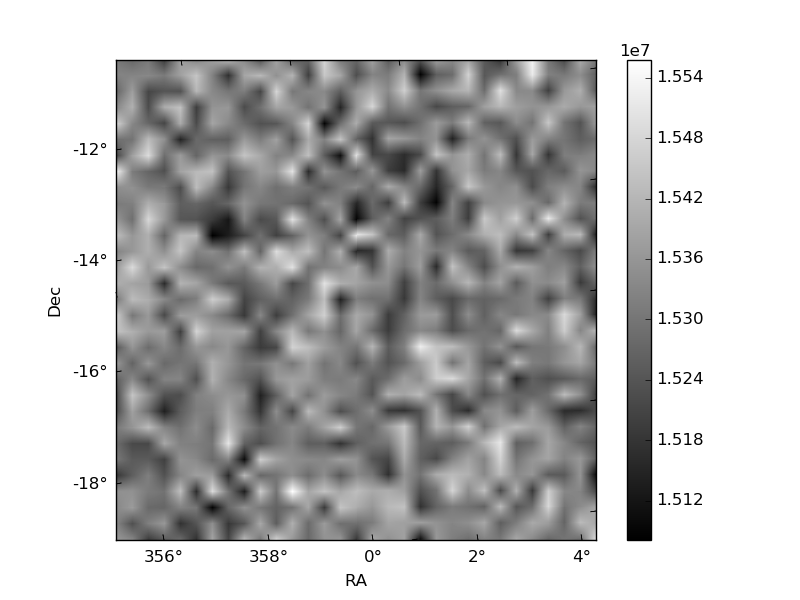
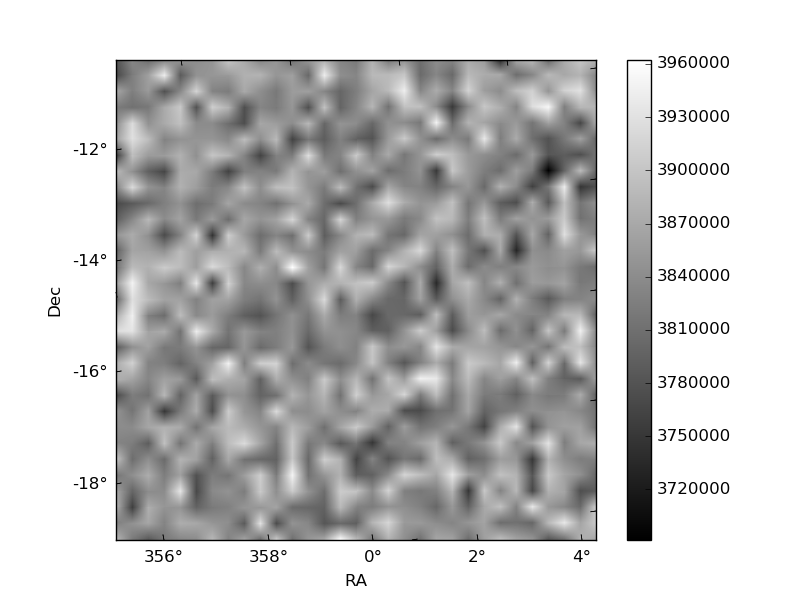
Histogram calculated using DETX and DETY for each event in the final _common_clean file
| Quadrant A | 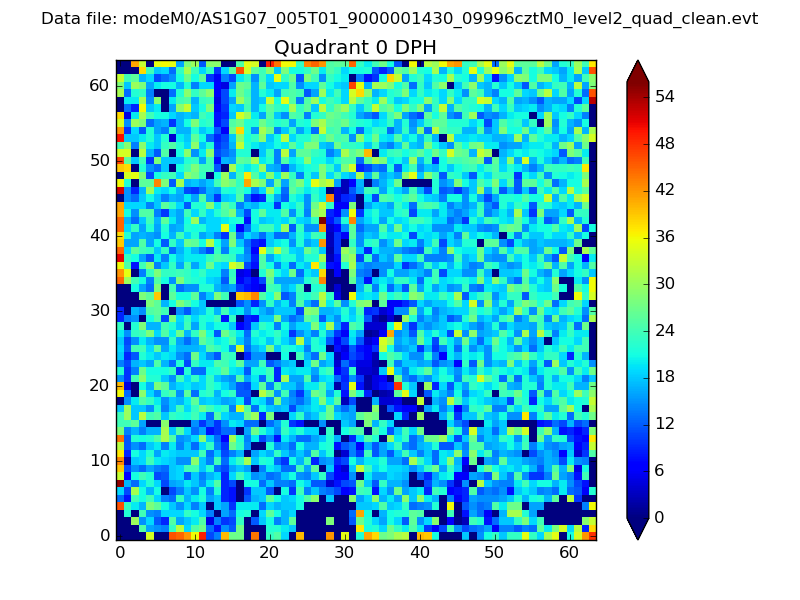 |
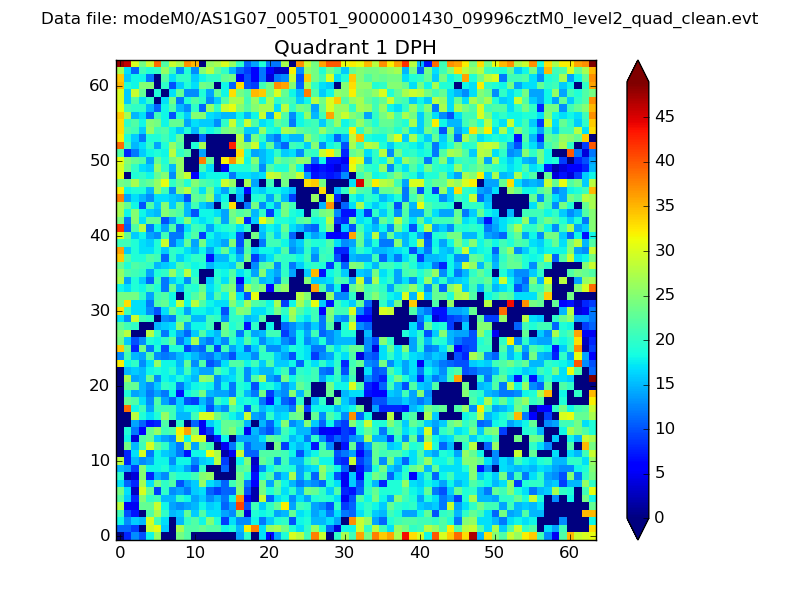 |
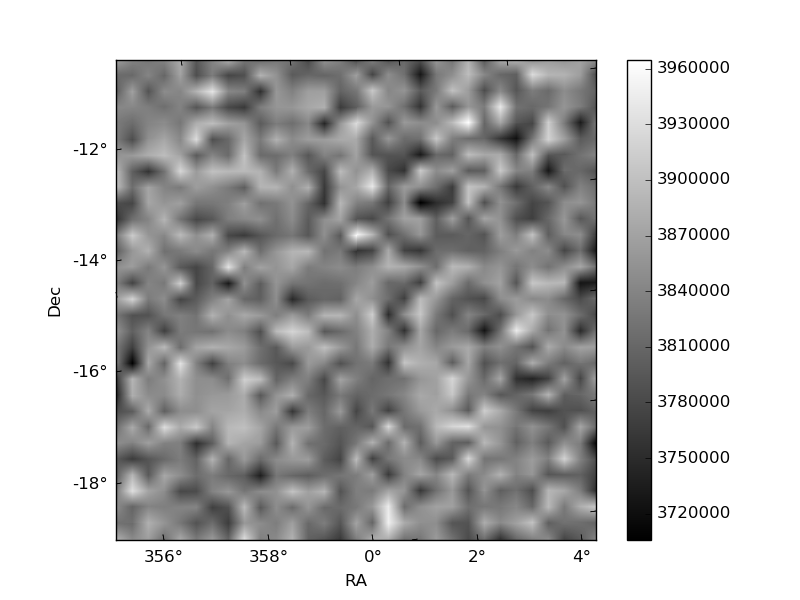
Quadrant B |
|---|---|---|---|
| Quadrant D | 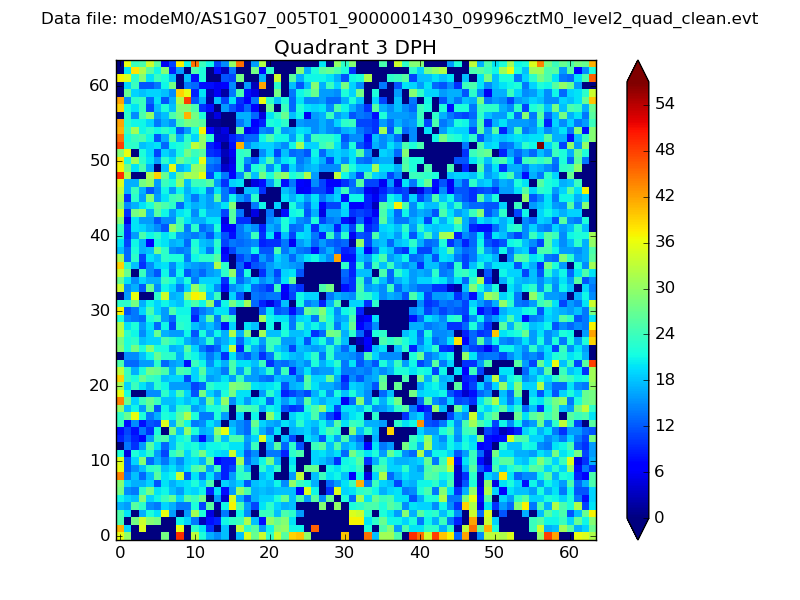 |
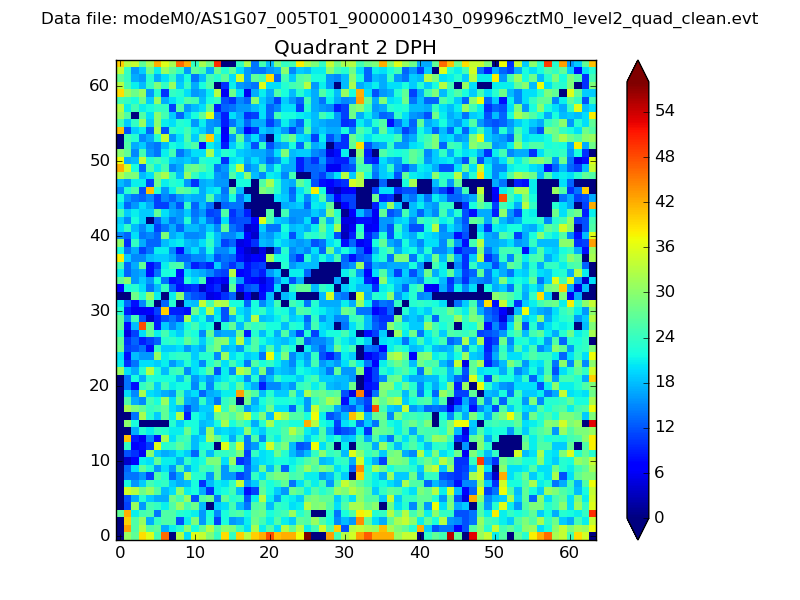 |
Quadrant C |
| Plot type | Count rate plots | Images |
|---|---|---|
| Comparison with Poisson distribution Blue bars denote a histogram of data divided into 1 sec bins. Red curve is a Poisson curve with rate = median count rate of data. |
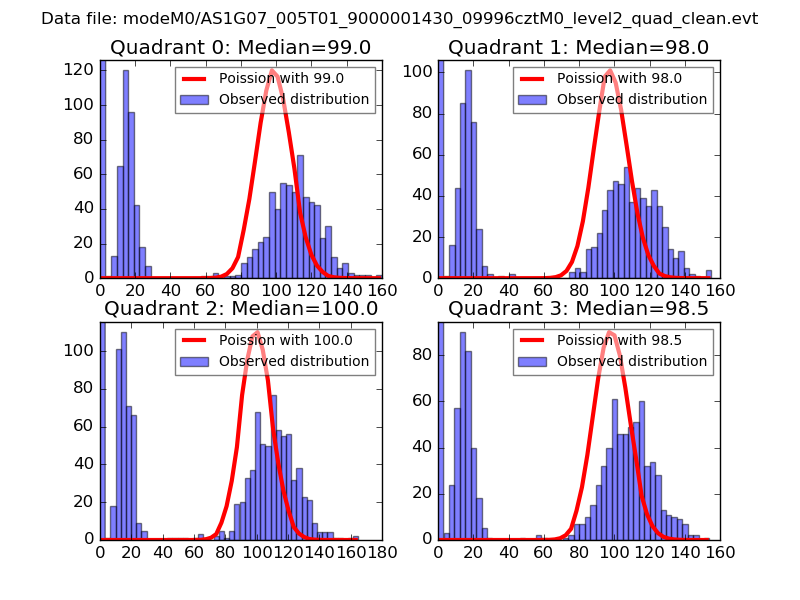 |
 |
| Quadrant-wise count rates Data is divided into 100 sec bins |
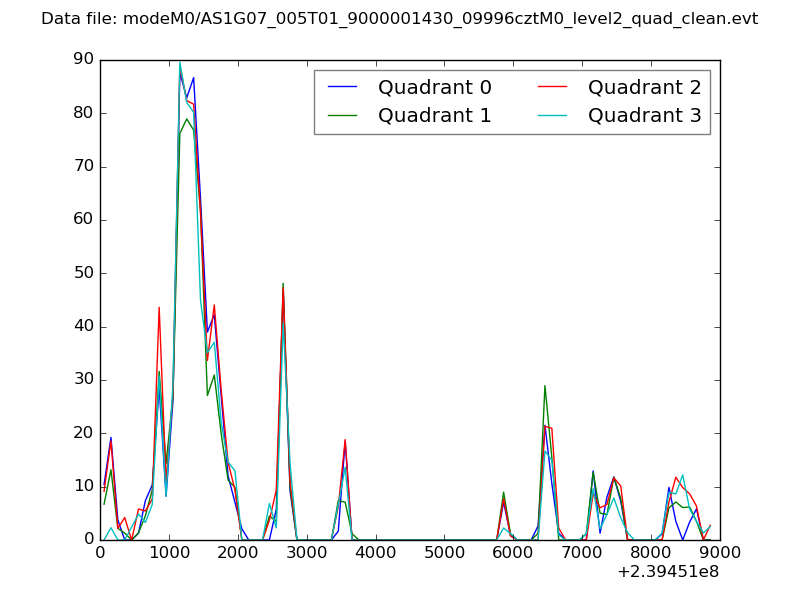 |
|
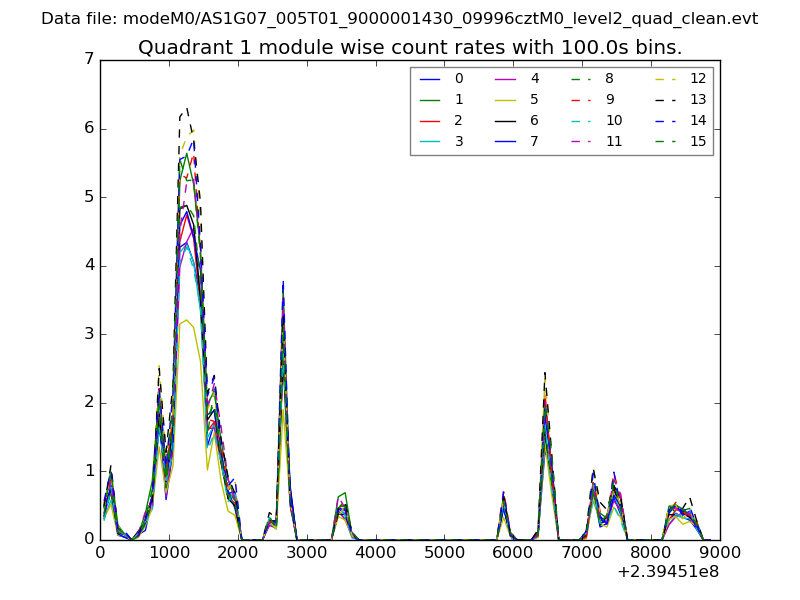
| Module-wise count rates for Quadrant A Data is divided into 100 sec bins |
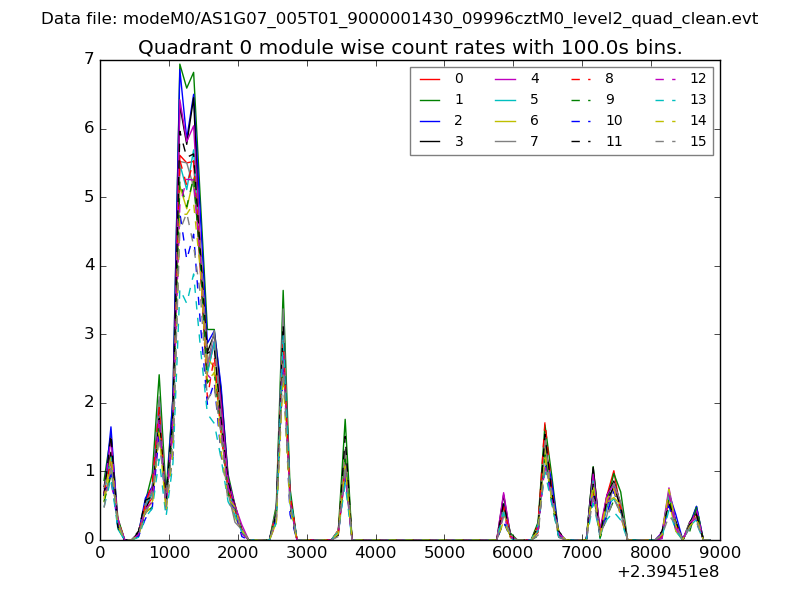 |
 |
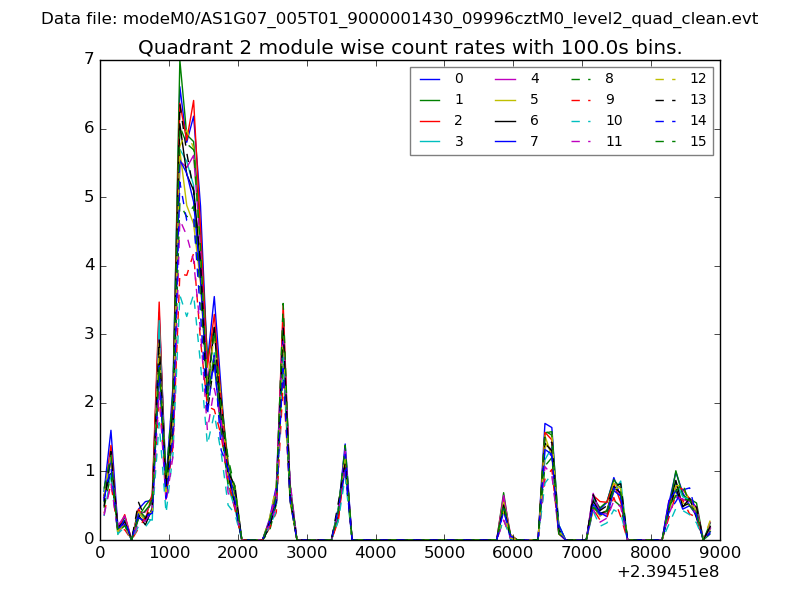
| Module-wise count rates for Quadrant B Data is divided into 100 sec bins |
 |
 |
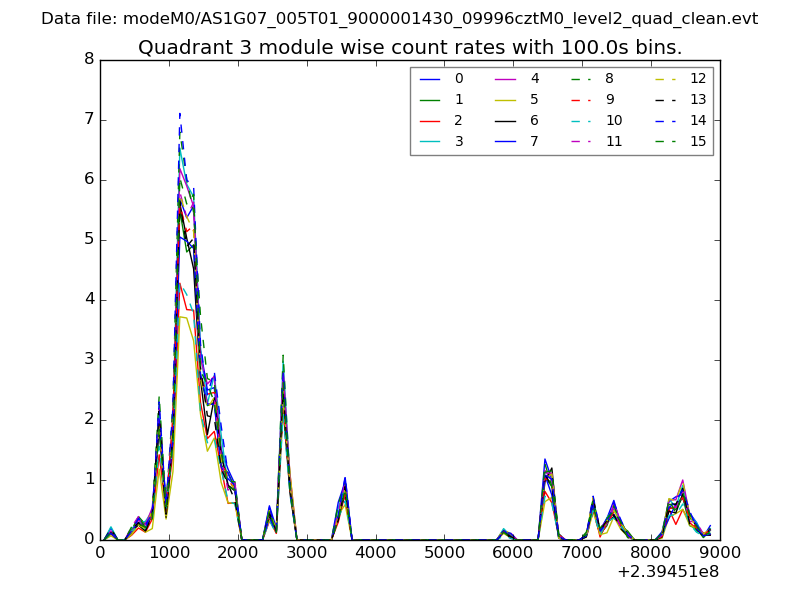
| Module-wise count rates for Quadrant C Data is divided into 100 sec bins |
 |
 |
| Module-wise count rates for Quadrant D Data is divided into 100 sec bins |
 |
 |
| Parameter | Plot |
|---|---|
| CZT HV Monitor | 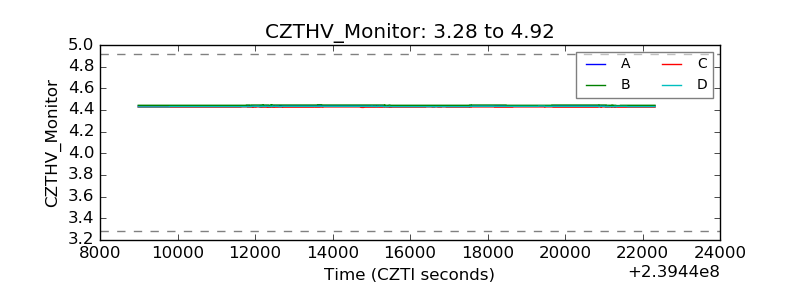 |
| D_VDD | 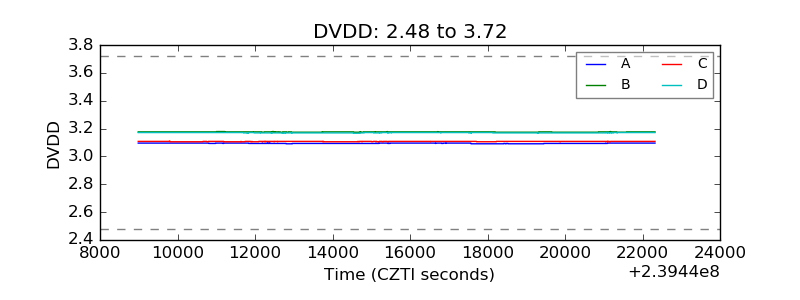 |
| Temperature 1 |  |
| Veto HV Monitor | 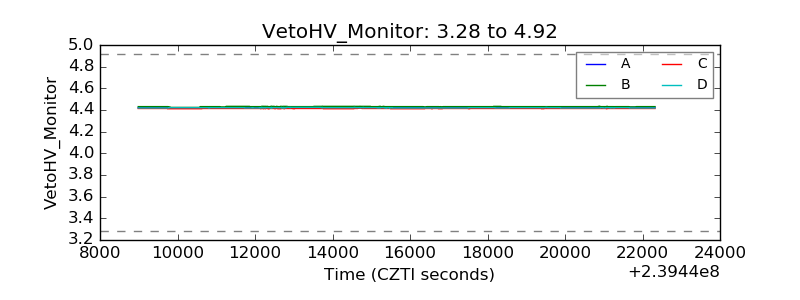 |
| Veto LLD | 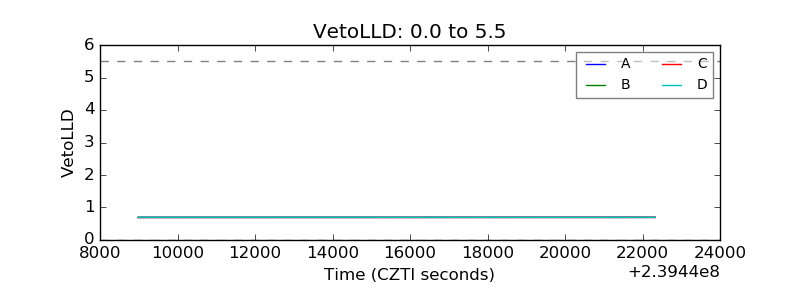 |
| Alpha Counter | 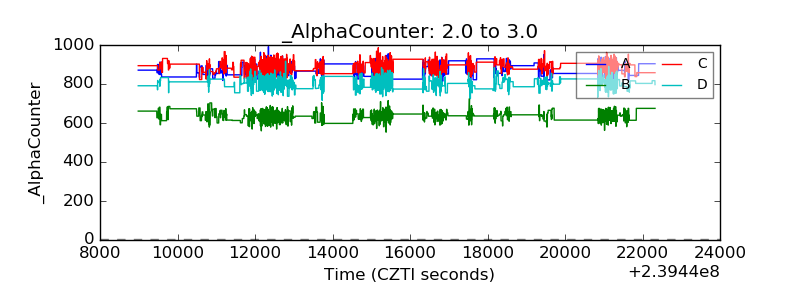 |
| _CPM_Rate | 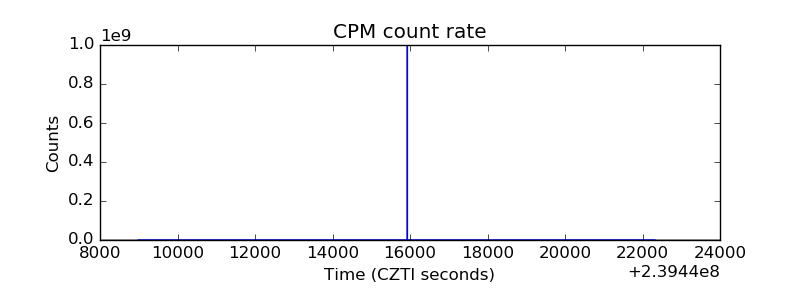 |
| CZT Counter | 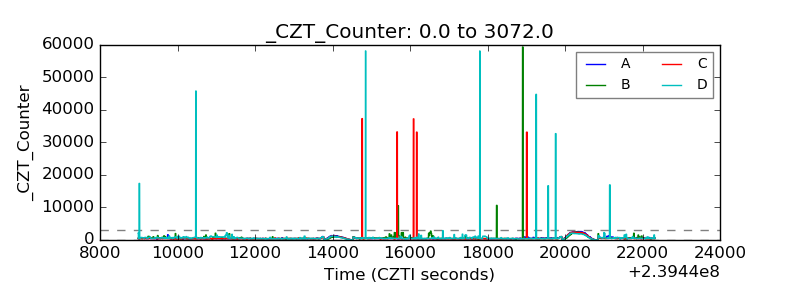 |
| +2.5 Volts monitor |  |
| +5 Volts monitor |  |
| _ROLL_ROT | 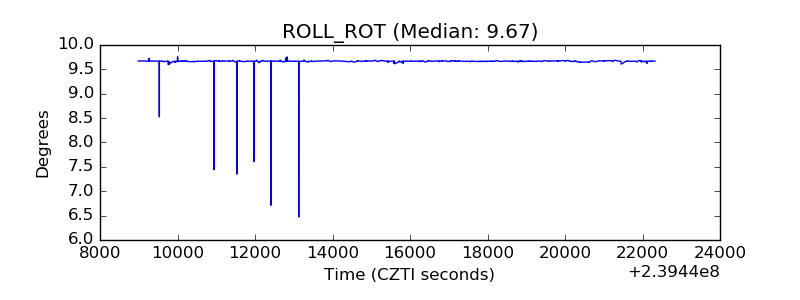 |
| _Roll_DEC |  |
| _Roll_RA | 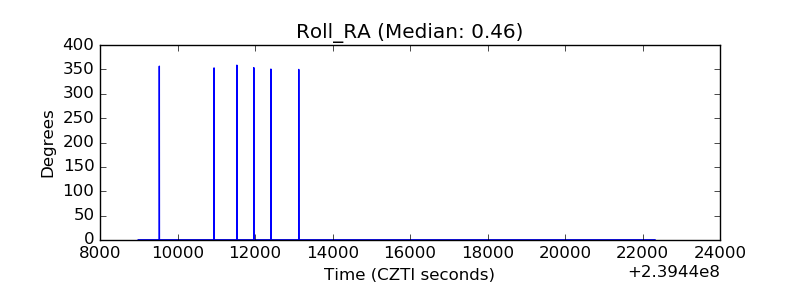 |
| Veto Counter | 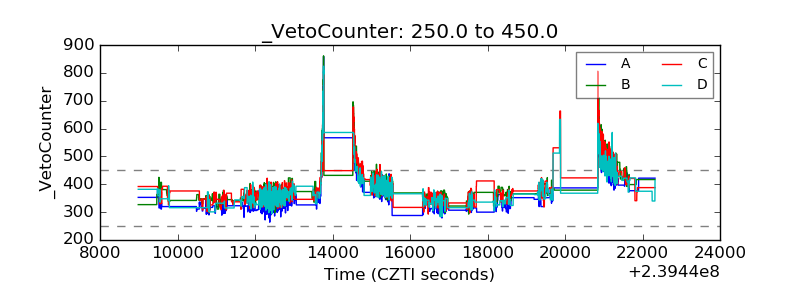 |