| Param | Original file | Final file |
|---|---|---|
| Filename | modeM0/AS1G07_022T02_9000001434cztM0_level2.fits | modeM0/AS1G07_022T02_9000001434cztM0_level2_quad_clean.evt |
| Size (bytes) | 940,694,400 | 959,181,120 |
| Size | 897.1 MB | 914.7 MB |
| Events in quadrant A | 6,489,652 | 6,645,079 |
| Events in quadrant B | 6,270,611 | 6,597,216 |
| Events in quadrant C | 6,463,829 | 6,592,240 |
| Events in quadrant D | 2,303,116 | 2,259,333 |
| Mode M0 | |||
|---|---|---|---|
| Quadrant | BADHDUFLAG | Total packets | Discarded packets |
| A | 0 | 246887 | 0 |
| B | 0 | 260708 | 0 |
| C | 0 | 239874 | 0 |
| D | 0 | 136425 | 0 |
| Mode M9 | |||
|---|---|---|---|
| Quadrant | BADHDUFLAG | Total packets | Discarded packets |
| A | 0 | 223 | 0 |
| B | 0 | 224 | 0 |
| C | 0 | 223 | 0 |
| D | 0 | 221 | 0 |
| Mode SS | |||
|---|---|---|---|
| Quadrant | BADHDUFLAG | Total packets | Discarded packets |
| A | 0 | 2424 | 0 |
| B | 0 | 2444 | 0 |
| C | 0 | 2399 | 0 |
| D | 0 | 2410 | 0 |
| Quadrant | Total seconds | Saturated seconds | Saturation percentage |
|---|---|---|---|
| A | 117232 | 1169 | 0.997168% |
| B | 117317 | 2582 | 2.200875% |
| C | 117421 | 701 | 0.596997% |
| D | 49035 | 2237 | 4.562048% |
Noise dominated data is calculated using 1-second bins in cleaned event files. If a bin has >2000 counts, and if more than 50% of those come from <1% of pixels, then it is considered to be noise-dominated and hence unusable.
| Quadrant | # 1 sec bins | Bins with >0 counts | Bins with >2000 counts | High rate bins dominated by noise | Noise dominated (total time) | Noise dominated (detector-on time) | Marked lightcurve |
|---|---|---|---|---|---|---|---|
| A | 167437 | 121665 | 0 | 0 | 0.00% | 0.00% |  |
| B | 167437 | 121741 | 0 | 0 | 0.00% | 0.00% |  |
| C | 167437 | 121933 | 0 | 0 | 0.00% | 0.00% |  |
| D | 64907 | 51425 | 0 | 0 | 0.00% | 0.00% | 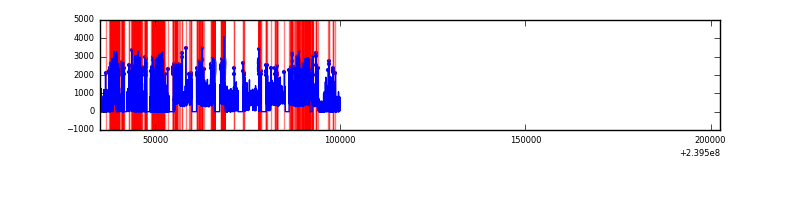 |
Top three noisy pixels from each quadrant. If the there are fewer than three noisy pixels in the level2.evt file, extra rows are filled as -1
| Pixel properties | Quadrant properties | ||||||
|---|---|---|---|---|---|---|---|
| Quadrant | DetID | PixID | Counts | Sigma | Mean | Median | Sigma |
| A | 0 | 29 | 6495 | 11.76 | 1685 | 1580 | 417.9 |
| A | 7 | 110 | 5466 | 9.3 | 1685 | 1580 | 417.9 |
| A | 0 | 30 | 4960 | 8.09 | 1685 | 1580 | 417.9 |
| B | 2 | 9 | 5335 | 11.67 | 1658 | 1582 | 321.6 |
| B | 14 | 254 | 4312 | 8.49 | 1658 | 1582 | 321.6 |
| B | 3 | 17 | 4237 | 8.26 | 1658 | 1582 | 321.6 |
| C | 1 | 80 | 4813 | 7.27 | 1705 | 1587 | 443.9 |
| C | 1 | 81 | 4785 | 7.2 | 1705 | 1587 | 443.9 |
| C | 12 | 241 | 4694 | 7.0 | 1705 | 1587 | 443.9 |
| D | 6 | 231 | 1726 | 6.4 | 656 | 597 | 176.4 |
| D | 10 | 189 | 1674 | 6.1 | 656 | 597 | 176.4 |
| D | 7 | 3 | 1653 | 5.98 | 656 | 597 | 176.4 |
Histogram calculated using DETX and DETY for each event in the final _common_clean file
| Quadrant A | 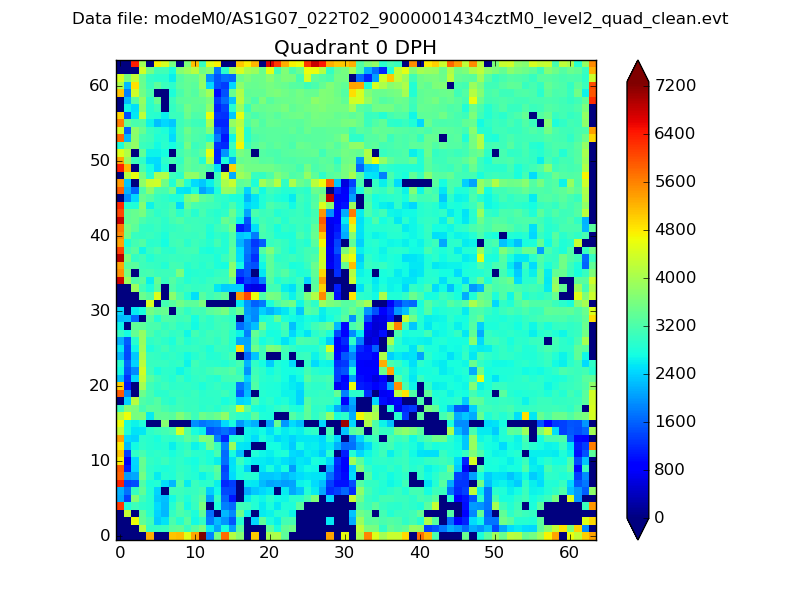 |
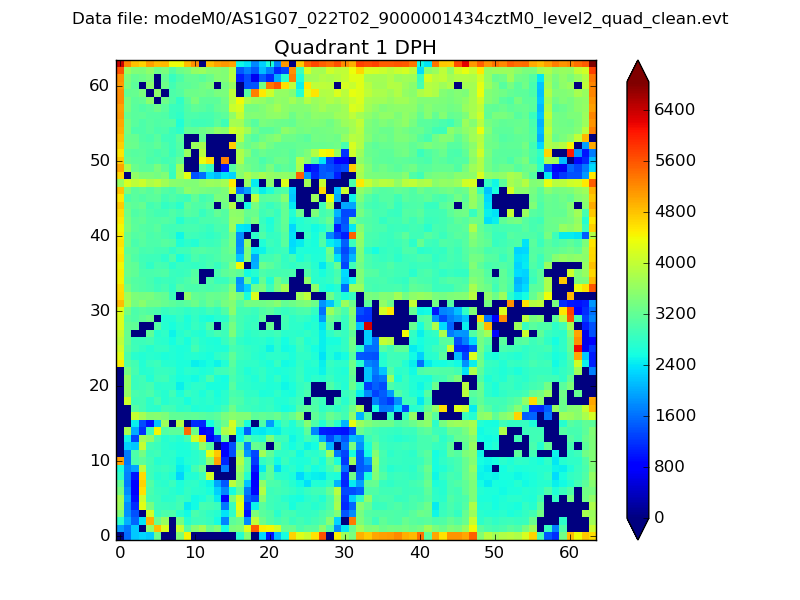 |
Quadrant B |
|---|---|---|---|
| Quadrant D |  |
 |
Quadrant C |
| Plot type | Count rate plots | Images |
|---|---|---|
| Comparison with Poisson distribution Blue bars denote a histogram of data divided into 1 sec bins. Red curve is a Poisson curve with rate = median count rate of data. |
 |
 |
| Quadrant-wise count rates Data is divided into 100 sec bins |
 |
|
| Module-wise count rates for Quadrant A Data is divided into 100 sec bins |
 |
 |
| Module-wise count rates for Quadrant B Data is divided into 100 sec bins |
 |
 |
| Module-wise count rates for Quadrant C Data is divided into 100 sec bins |
 |
 |
| Module-wise count rates for Quadrant D Data is divided into 100 sec bins |
 |
 |
| Parameter | Plot |
|---|---|
| CZT HV Monitor |  |
| D_VDD |  |
| Temperature 1 | 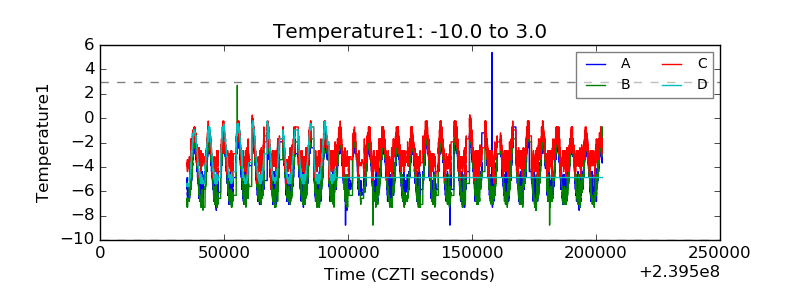 |
| Veto HV Monitor |  |
| Veto LLD | 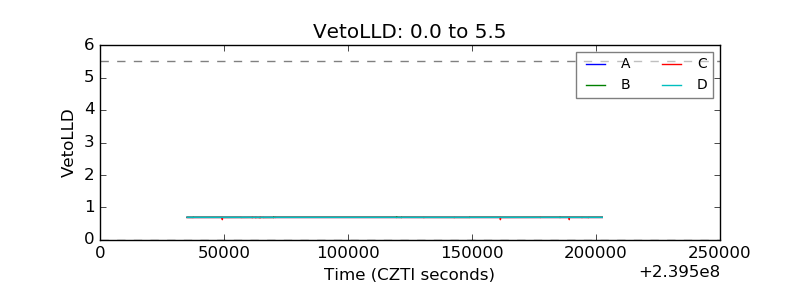 |
| Alpha Counter |  |
| _CPM_Rate |  |
| CZT Counter |  |
| +2.5 Volts monitor |  |
| +5 Volts monitor |  |
| _ROLL_ROT |  |
| _Roll_DEC | 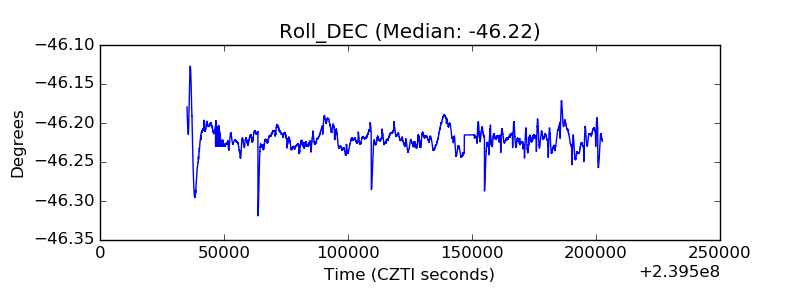 |
| _Roll_RA |  |
| Veto Counter |  |