| Param | Original file | Final file |
|---|---|---|
| Filename | modeM0/AS1G07_022T02_9000001434_10010cztM0_level2.evt | modeM0/AS1G07_022T02_9000001434_10010cztM0_level2_quad_clean.evt |
| Size (bytes) | 516,156,480 | 87,624,000 |
| Size | 492.2 MB | 83.6 MB |
| Events in quadrant A | 3,310,780 | 545,311 |
| Events in quadrant B | 3,325,007 | 550,343 |
| Events in quadrant C | 3,134,302 | 565,493 |
| Events in quadrant D | 5,392,851 | 511,621 |
| Mode M0 | |||
|---|---|---|---|
| Quadrant | BADHDUFLAG | Total packets | Discarded packets |
| A | 0 | 15169 | 819 |
| B | 0 | 15183 | 828 |
| C | 0 | 14935 | 812 |
| D | 0 | 21823 | 1328 |
| Mode M9 | |||
|---|---|---|---|
| Quadrant | BADHDUFLAG | Total packets | Discarded packets |
| A | 0 | 15 | 2 |
| B | 0 | 15 | 3 |
| C | 0 | 15 | 1 |
| D | 0 | 15 | 3 |
| Mode SS | |||
|---|---|---|---|
| Quadrant | BADHDUFLAG | Total packets | Discarded packets |
| A | 0 | 147 | 15 |
| B | 0 | 148 | 4 |
| C | 0 | 147 | 8 |
| D | 0 | 148 | 6 |
| Quadrant | Total seconds | Saturated seconds | Saturation percentage |
|---|---|---|---|
| A | 6918 | 111 | 1.604510% |
| B | 6933 | 113 | 1.629886% |
| C | 6916 | 81 | 1.171197% |
| D | 6833 | 486 | 7.112542% |
Noise dominated data is calculated using 1-second bins in cleaned event files. If a bin has >2000 counts, and if more than 50% of those come from <1% of pixels, then it is considered to be noise-dominated and hence unusable.
| Quadrant | # 1 sec bins | Bins with >0 counts | Bins with >2000 counts | High rate bins dominated by noise | Noise dominated (total time) | Noise dominated (detector-on time) | Marked lightcurve |
|---|---|---|---|---|---|---|---|
| A | 8765 | 7232 | 0 | 0 | 0.00% | 0.00% | 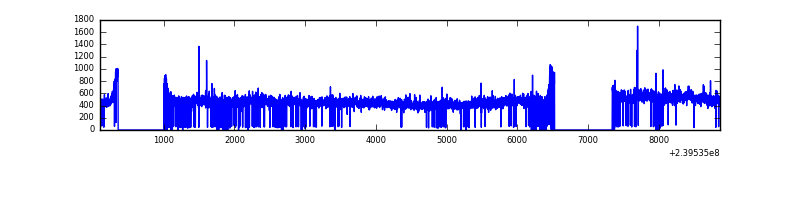 |
| B | 8765 | 7242 | 6 | 6 | 0.07% | 0.08% | 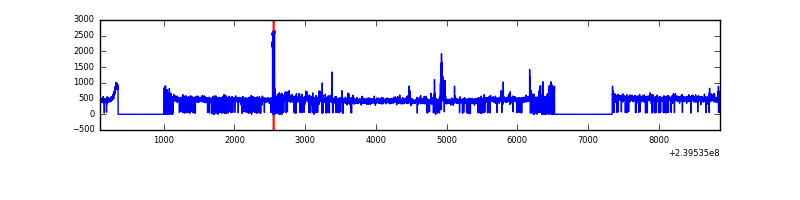 |
| C | 8765 | 7238 | 0 | 0 | 0.00% | 0.00% | 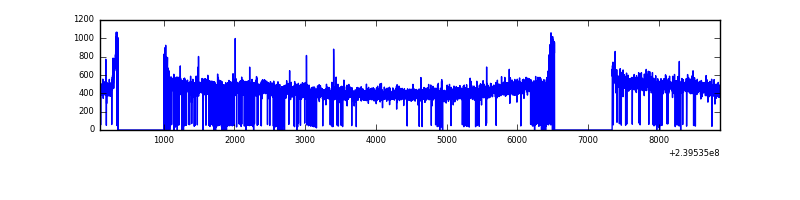 |
| D | 8765 | 7206 | 392 | 392 | 4.47% | 5.44% | 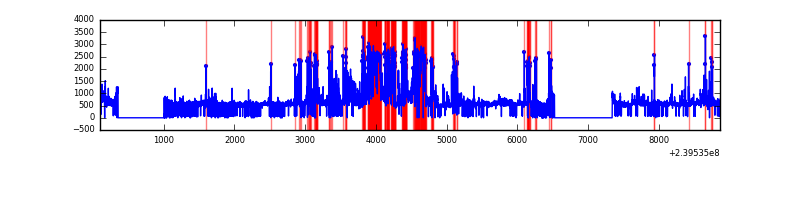 |
Top three noisy pixels from each quadrant. If the there are fewer than three noisy pixels in the level2.evt file, extra rows are filled as -1
| Pixel properties | Quadrant properties | ||||||
|---|---|---|---|---|---|---|---|
| Quadrant | DetID | PixID | Counts | Sigma | Mean | Median | Sigma |
| A | 8 | 15 | 167790 | 1008.77 | 813 | 795 | 165.5 |
| A | 15 | 239 | 8174 | 44.57 | 813 | 795 | 165.5 |
| A | 0 | 226 | 7349 | 39.59 | 813 | 795 | 165.5 |
| B | 0 | 214 | 46285 | 288.73 | 816 | 795 | 157.5 |
| B | 15 | 85 | 27167 | 167.39 | 816 | 795 | 157.5 |
| B | 4 | 81 | 25083 | 154.16 | 816 | 795 | 157.5 |
| C | 13 | 61 | 5874 | 27.18 | 802 | 806 | 186.5 |
| C | 14 | 67 | 3148 | 12.56 | 802 | 806 | 186.5 |
| C | 5 | 128 | 2327 | 8.16 | 802 | 806 | 186.5 |
| D | 10 | 118 | 1177436 | 6320.87 | 766 | 747 | 186.2 |
| D | 8 | 195 | 607317 | 3258.34 | 766 | 747 | 186.2 |
| D | 2 | 16 | 383120 | 2054.01 | 766 | 747 | 186.2 |
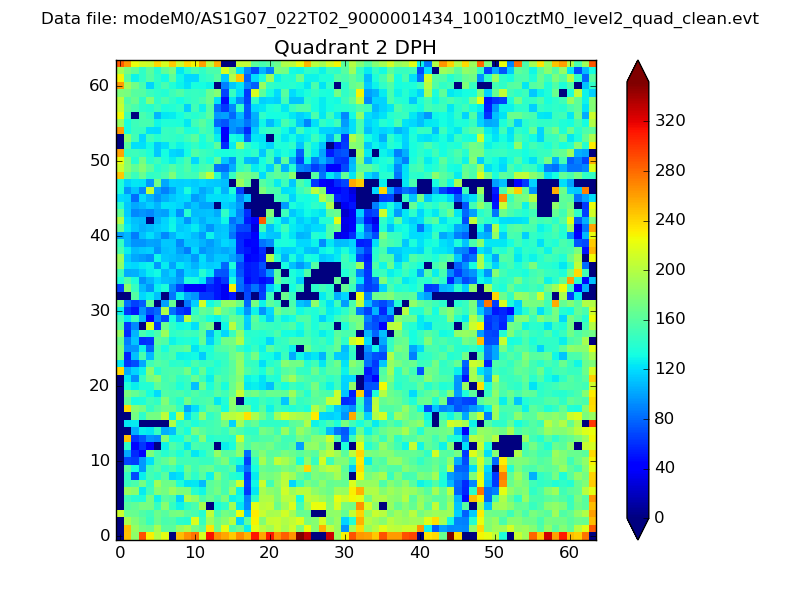
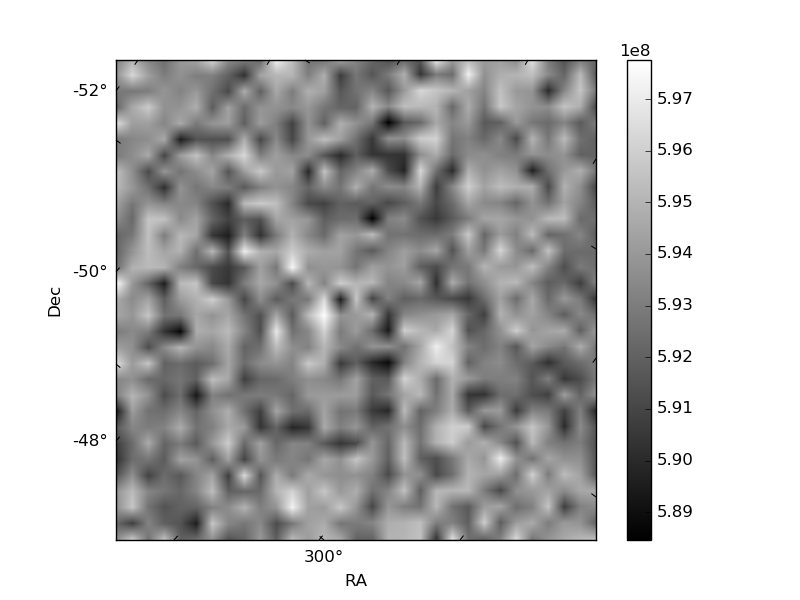
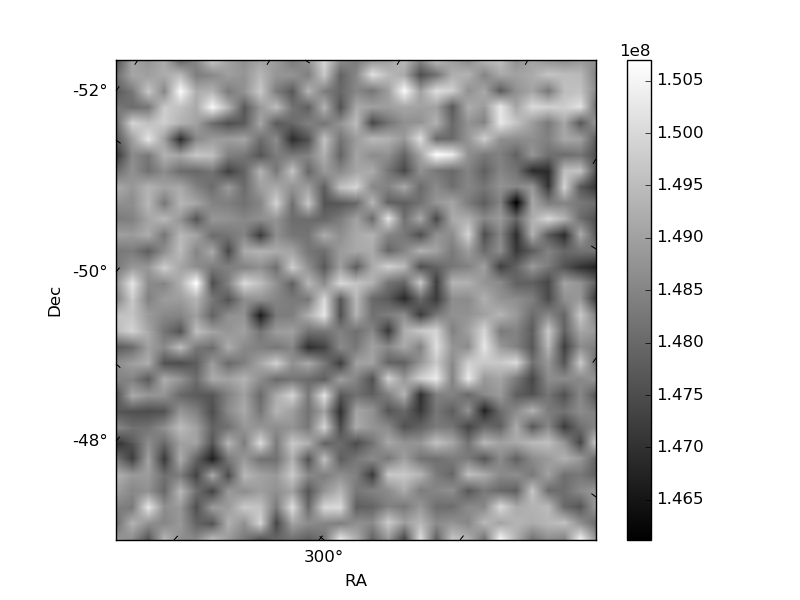
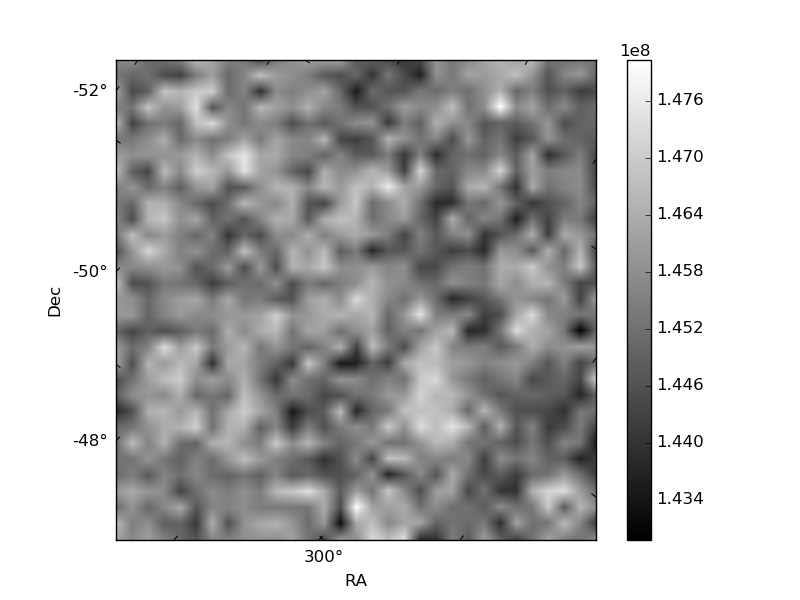
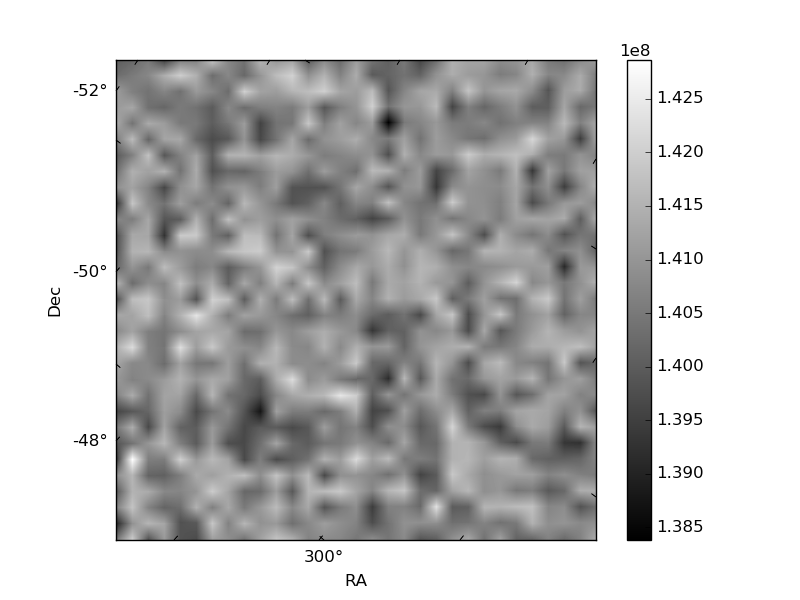
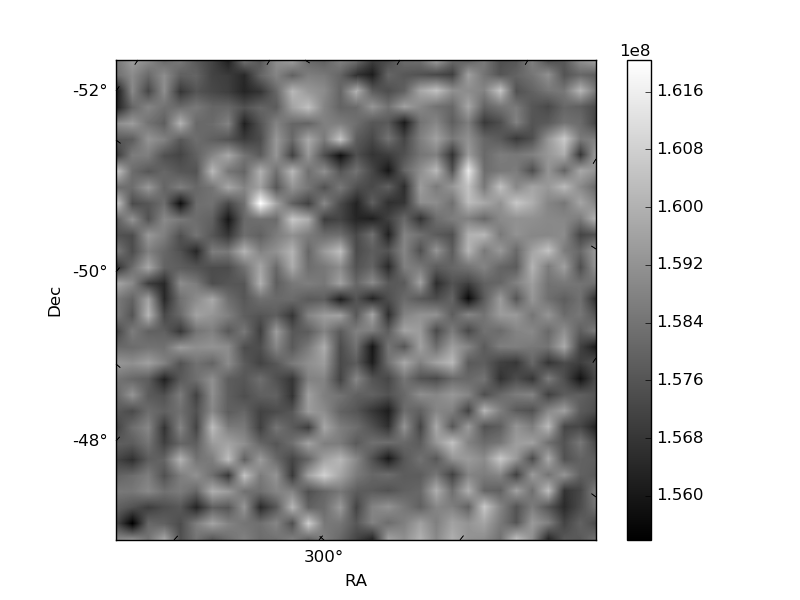
Histogram calculated using DETX and DETY for each event in the final _common_clean file
| Quadrant A | 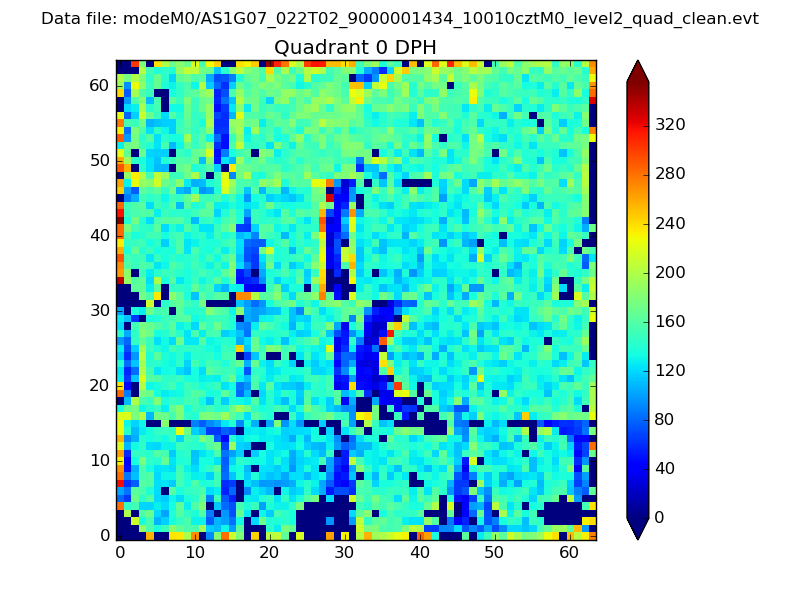 |
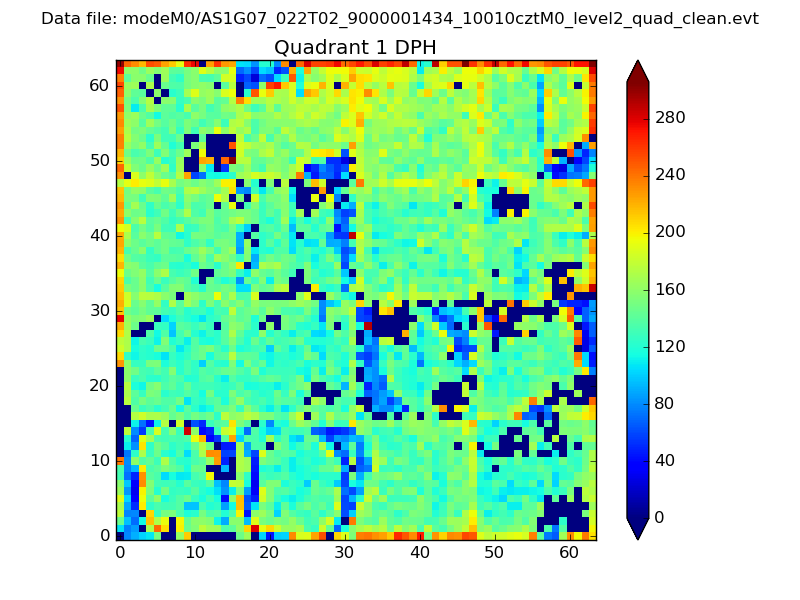 |
Quadrant B |
|---|---|---|---|
| Quadrant D | 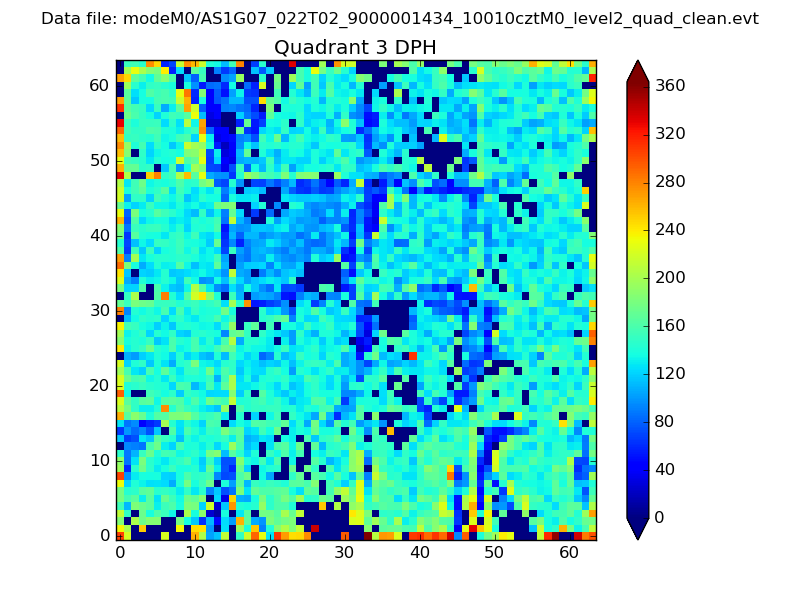 |
 |
Quadrant C |
| Plot type | Count rate plots | Images |
|---|---|---|
| Comparison with Poisson distribution Blue bars denote a histogram of data divided into 1 sec bins. Red curve is a Poisson curve with rate = median count rate of data. |
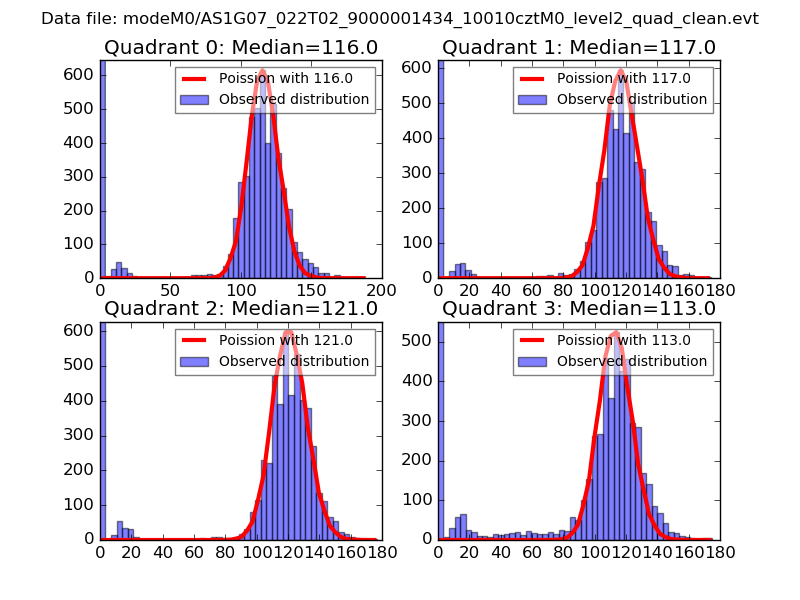 |
 |
| Quadrant-wise count rates Data is divided into 100 sec bins |
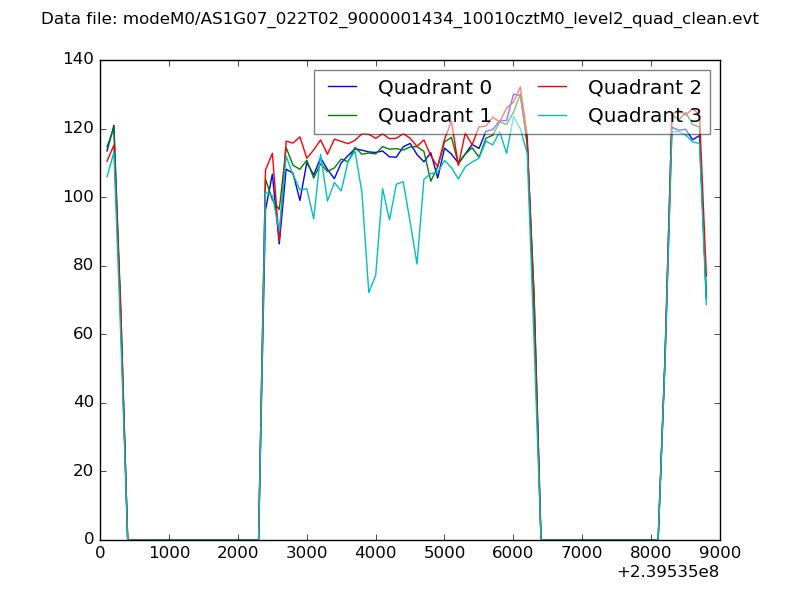 |
|
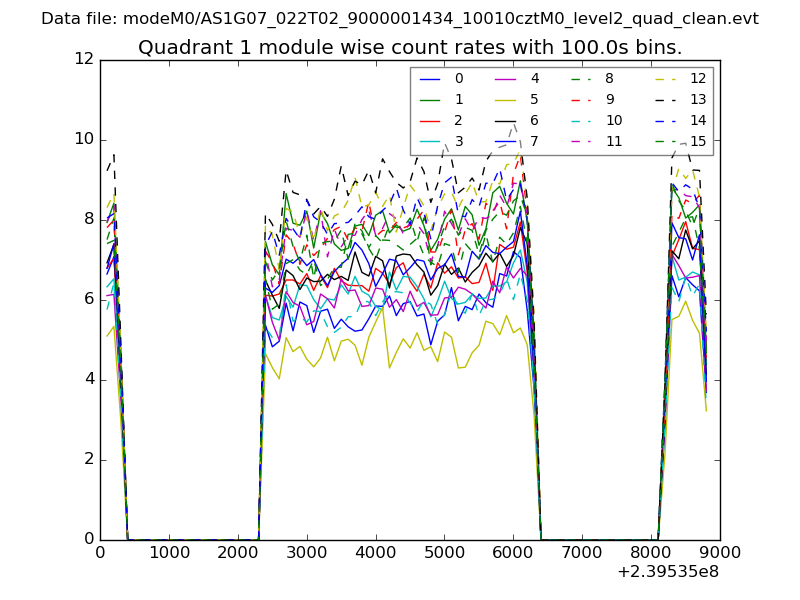
| Module-wise count rates for Quadrant A Data is divided into 100 sec bins |
 |
 |
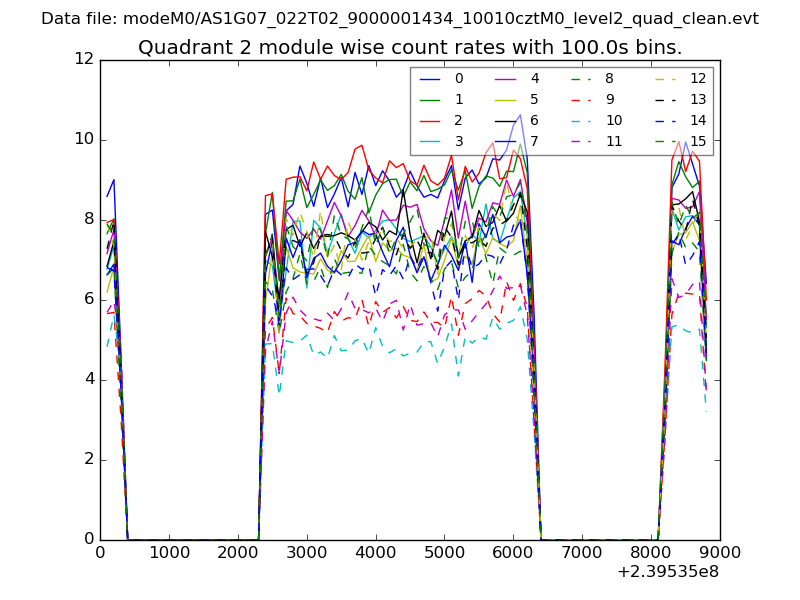
| Module-wise count rates for Quadrant B Data is divided into 100 sec bins |
 |
 |
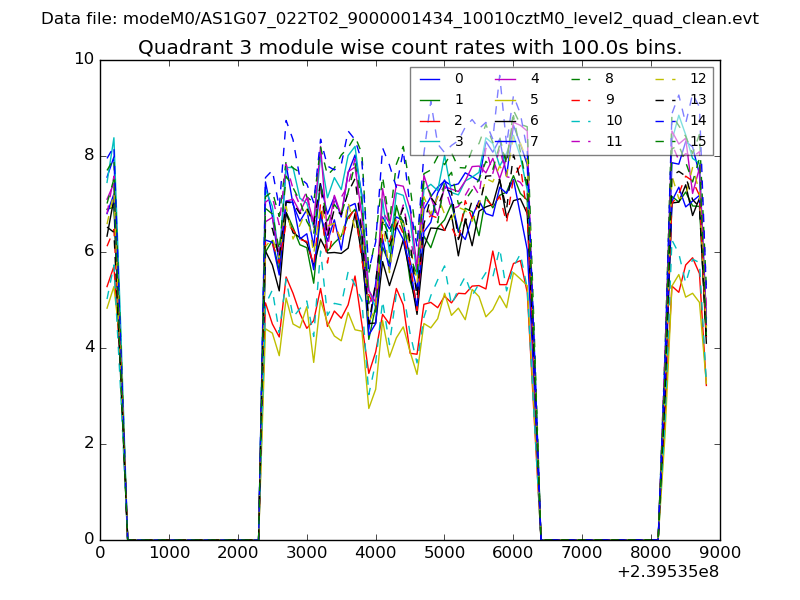
| Module-wise count rates for Quadrant C Data is divided into 100 sec bins |
 |
 |
| Module-wise count rates for Quadrant D Data is divided into 100 sec bins |
 |
 |
| Parameter | Plot |
|---|---|
| CZT HV Monitor | 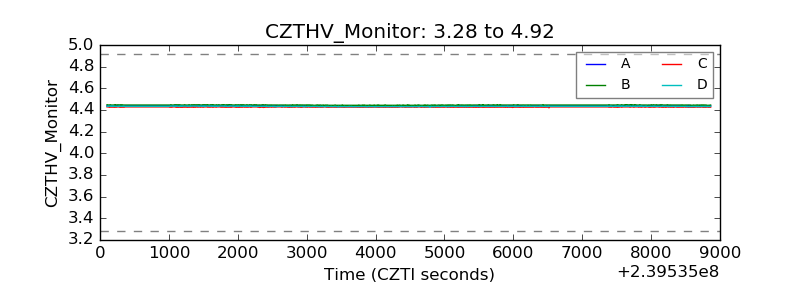 |
| D_VDD |  |
| Temperature 1 | 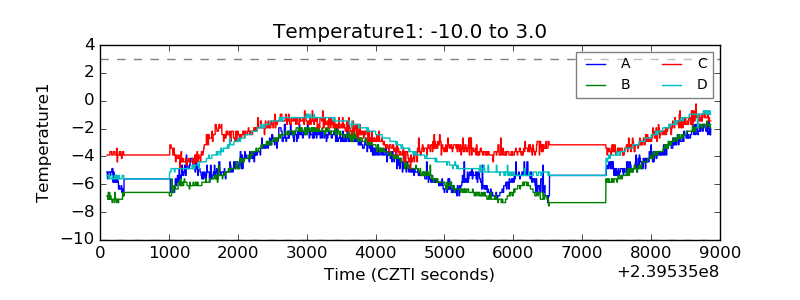 |
| Veto HV Monitor | 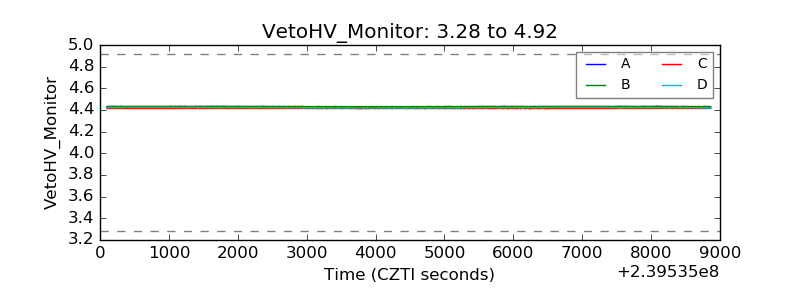 |
| Veto LLD | 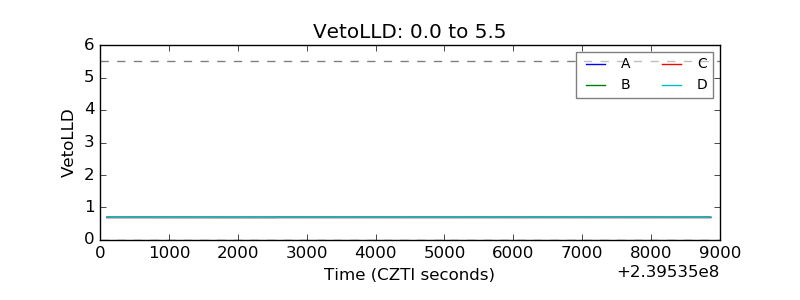 |
| Alpha Counter | 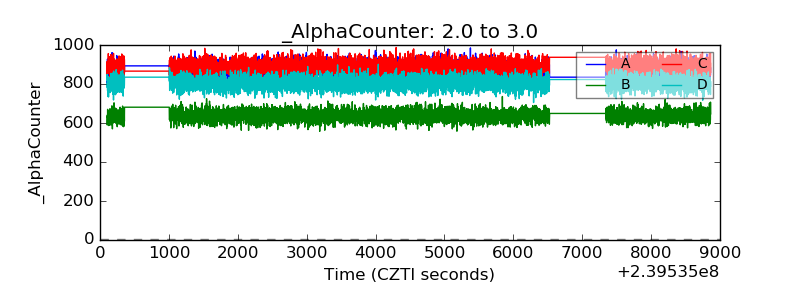 |
| _CPM_Rate | 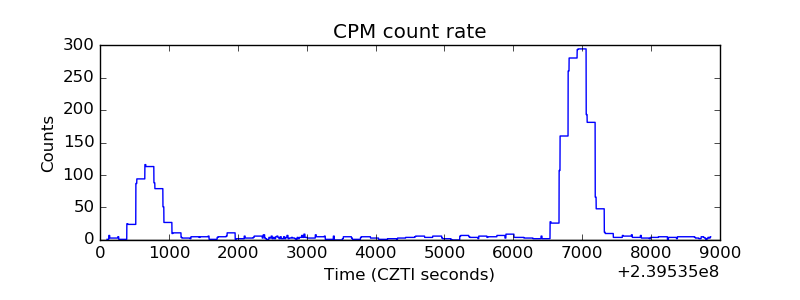 |
| CZT Counter | 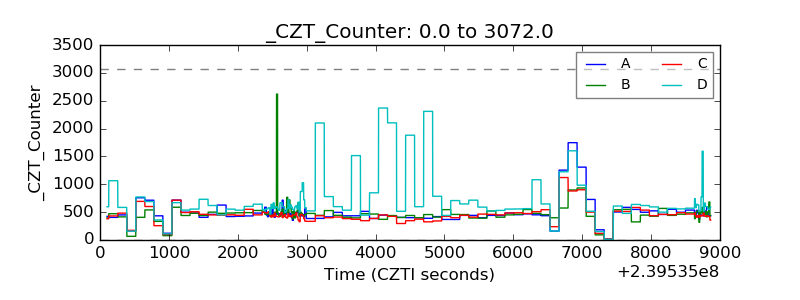 |
| +2.5 Volts monitor |  |
| +5 Volts monitor |  |
| _ROLL_ROT | 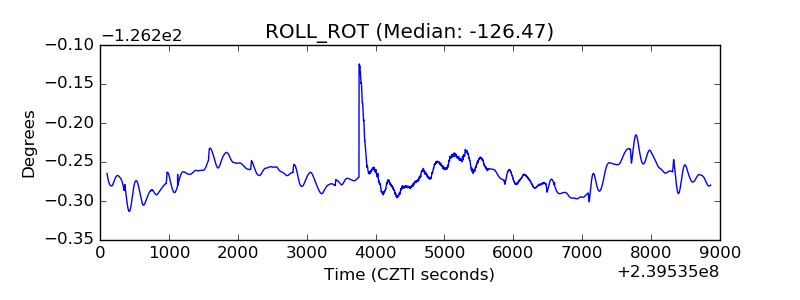 |
| _Roll_DEC |  |
| _Roll_RA | 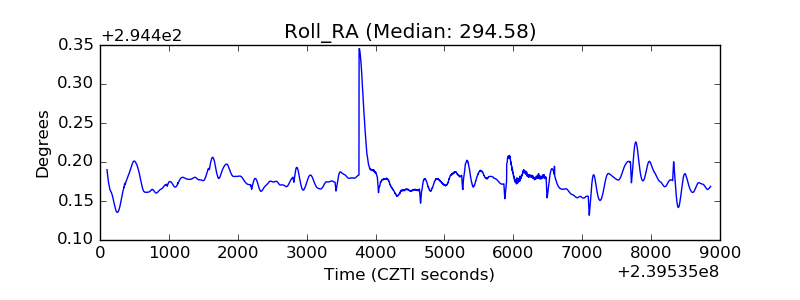 |
| Veto Counter | 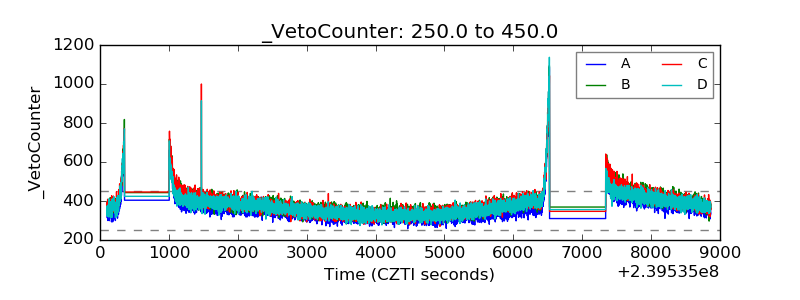 |