| Param | Original file | Final file |
|---|---|---|
| Filename | modeM0/AS1G07_022T02_9000001434_10011cztM0_level2.evt | modeM0/AS1G07_022T02_9000001434_10011cztM0_level2_quad_clean.evt |
| Size (bytes) | 466,698,240 | 88,211,520 |
| Size | 445.1 MB | 84.1 MB |
| Events in quadrant A | 2,983,530 | 562,076 |
| Events in quadrant B | 2,833,255 | 575,441 |
| Events in quadrant C | 2,648,204 | 588,175 |
| Events in quadrant D | 5,268,177 | 533,422 |
| Mode M0 | |||
|---|---|---|---|
| Quadrant | BADHDUFLAG | Total packets | Discarded packets |
| A | 0 | 13005 | 239 |
| B | 0 | 12447 | 155 |
| C | 0 | 12282 | 174 |
| D | 0 | 20249 | 540 |
| Mode M9 | |||
|---|---|---|---|
| Quadrant | BADHDUFLAG | Total packets | Discarded packets |
| A | 0 | 10 | 0 |
| B | 0 | 10 | 0 |
| C | 0 | 10 | 0 |
| D | 0 | 10 | 0 |
| Mode SS | |||
|---|---|---|---|
| Quadrant | BADHDUFLAG | Total packets | Discarded packets |
| A | 0 | 120 | 2 |
| B | 0 | 120 | 0 |
| C | 0 | 120 | 2 |
| D | 0 | 120 | 2 |
| Quadrant | Total seconds | Saturated seconds | Saturation percentage |
|---|---|---|---|
| A | 5896 | 84 | 1.424695% |
| B | 5926 | 54 | 0.911239% |
| C | 5918 | 37 | 0.625211% |
| D | 5869 | 491 | 8.365991% |
Noise dominated data is calculated using 1-second bins in cleaned event files. If a bin has >2000 counts, and if more than 50% of those come from <1% of pixels, then it is considered to be noise-dominated and hence unusable.
| Quadrant | # 1 sec bins | Bins with >0 counts | Bins with >2000 counts | High rate bins dominated by noise | Noise dominated (total time) | Noise dominated (detector-on time) | Marked lightcurve |
|---|---|---|---|---|---|---|---|
| A | 6989 | 5992 | 23 | 23 | 0.33% | 0.38% | 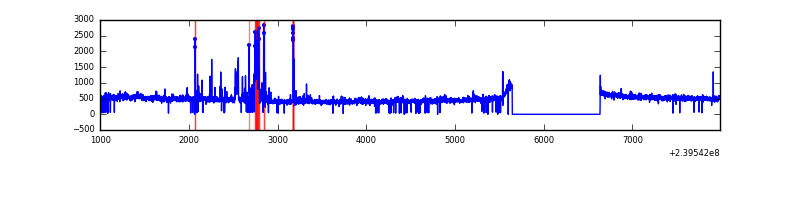 |
| B | 6989 | 5998 | 1 | 1 | 0.01% | 0.02% | 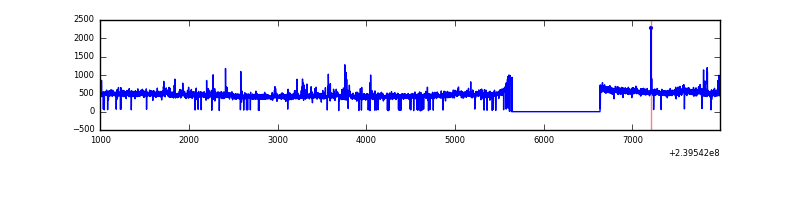 |
| C | 6989 | 5992 | 0 | 0 | 0.00% | 0.00% | 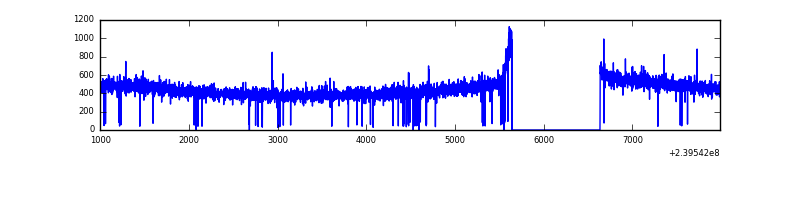 |
| D | 6989 | 5976 | 531 | 531 | 7.60% | 8.89% | 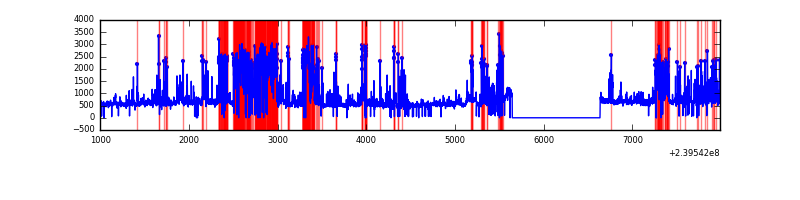 |
Top three noisy pixels from each quadrant. If the there are fewer than three noisy pixels in the level2.evt file, extra rows are filled as -1
| Pixel properties | Quadrant properties | ||||||
|---|---|---|---|---|---|---|---|
| Quadrant | DetID | PixID | Counts | Sigma | Mean | Median | Sigma |
| A | 8 | 15 | 214176 | 1504.08 | 691 | 677 | 141.9 |
| A | 15 | 174 | 85150 | 595.1 | 691 | 677 | 141.9 |
| A | 15 | 239 | 21343 | 145.59 | 691 | 677 | 141.9 |
| B | 0 | 214 | 35256 | 257.84 | 696 | 678 | 134.1 |
| B | 4 | 81 | 30202 | 220.15 | 696 | 678 | 134.1 |
| B | 0 | 219 | 25796 | 187.3 | 696 | 678 | 134.1 |
| C | 13 | 61 | 5115 | 28.26 | 677 | 680 | 157.0 |
| C | 14 | 67 | 5082 | 28.05 | 677 | 680 | 157.0 |
| C | 8 | 222 | 2693 | 12.83 | 677 | 680 | 157.0 |
| D | 2 | 16 | 1203414 | 7455.98 | 657 | 638 | 161.3 |
| D | 8 | 195 | 590124 | 3654.21 | 657 | 638 | 161.3 |
| D | 1 | 52 | 399419 | 2472.03 | 657 | 638 | 161.3 |
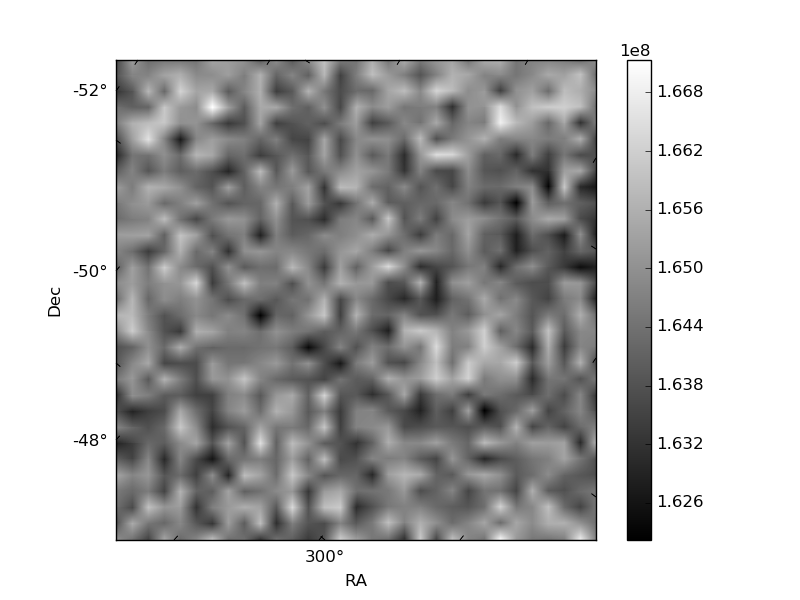
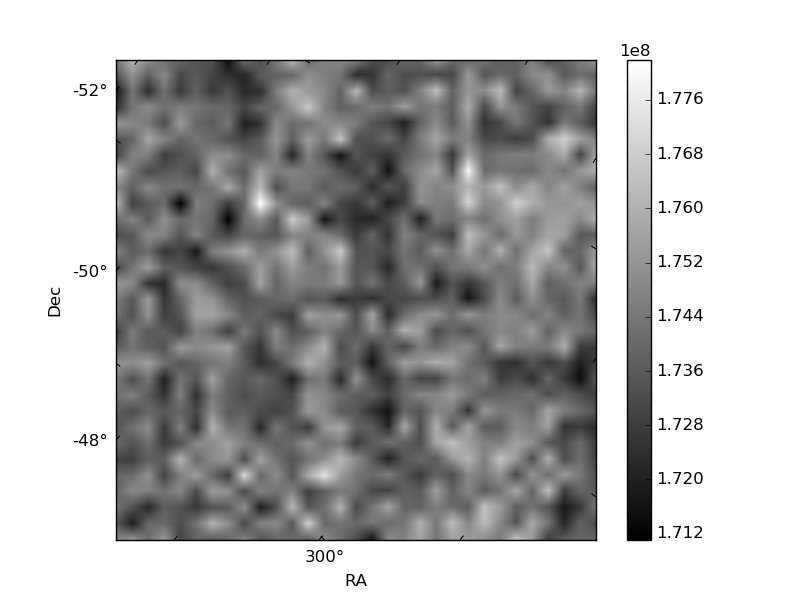
Histogram calculated using DETX and DETY for each event in the final _common_clean file
| Quadrant A | 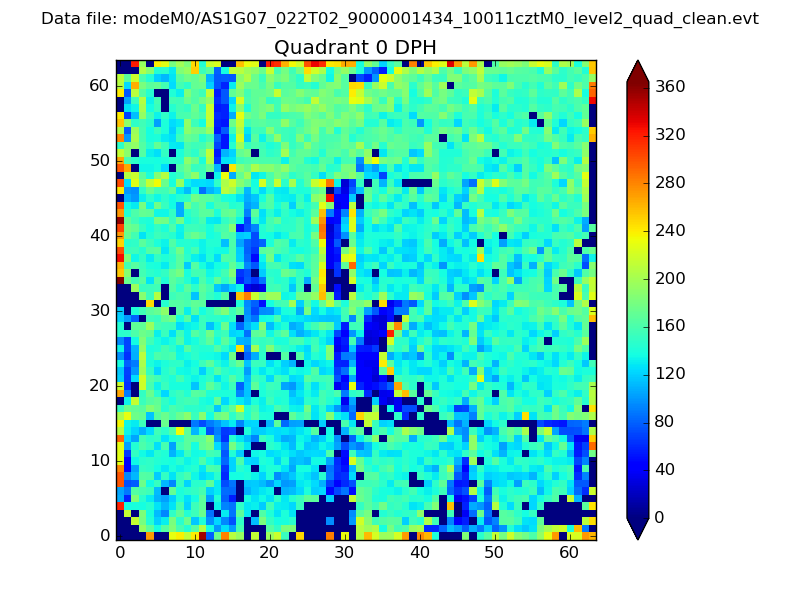 |
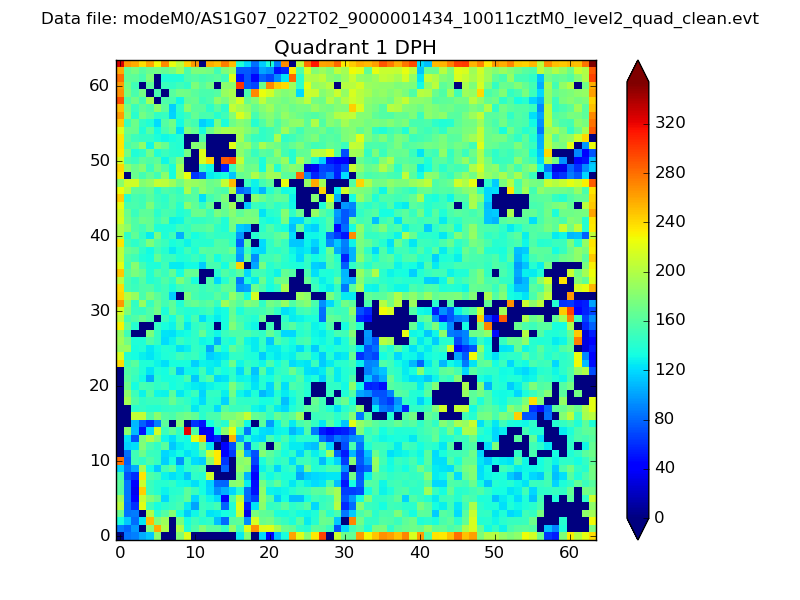 |
Quadrant B |
|---|---|---|---|
| Quadrant D |  |
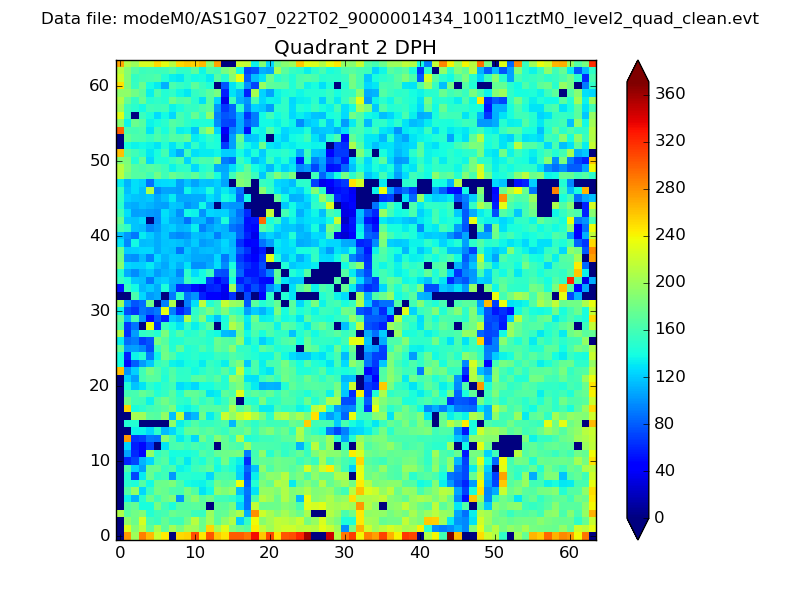 |
Quadrant C |
| Plot type | Count rate plots | Images |
|---|---|---|
| Comparison with Poisson distribution Blue bars denote a histogram of data divided into 1 sec bins. Red curve is a Poisson curve with rate = median count rate of data. |
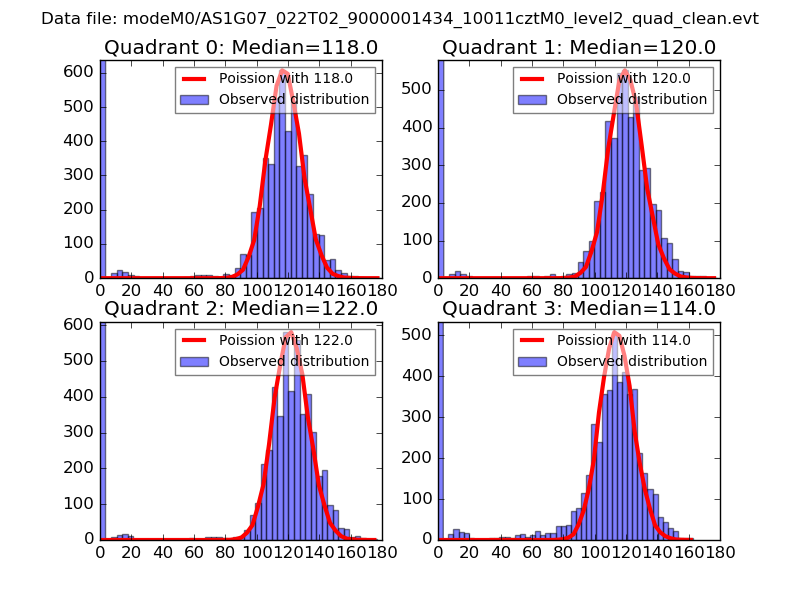 |
 |
| Quadrant-wise count rates Data is divided into 100 sec bins |
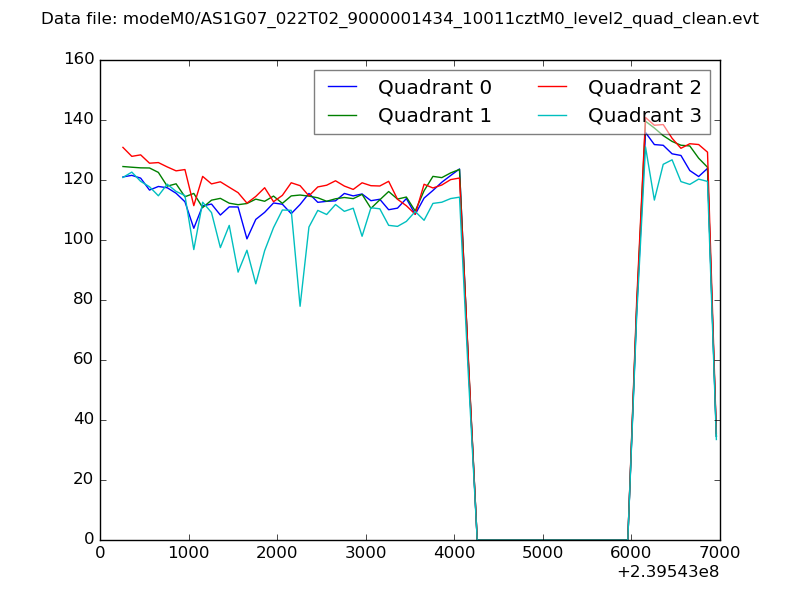 |
|
| Module-wise count rates for Quadrant A Data is divided into 100 sec bins |
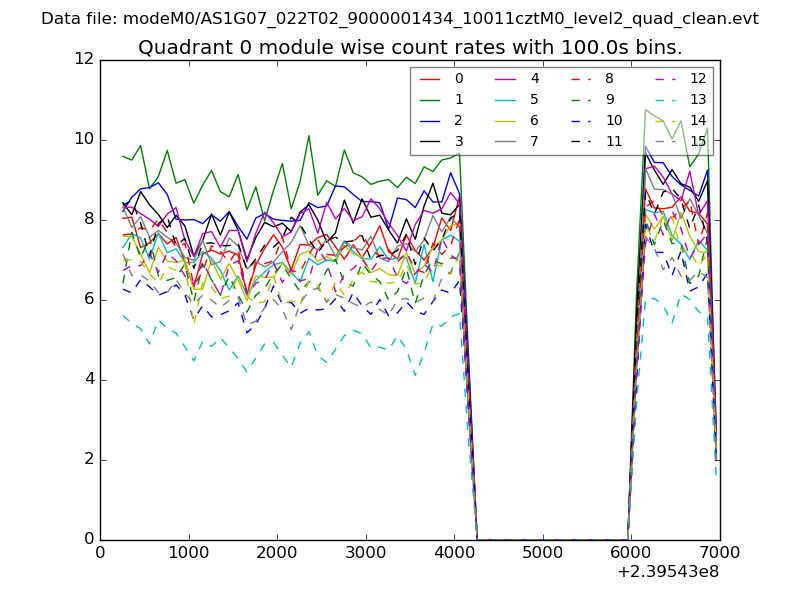 |
 |
| Module-wise count rates for Quadrant B Data is divided into 100 sec bins |
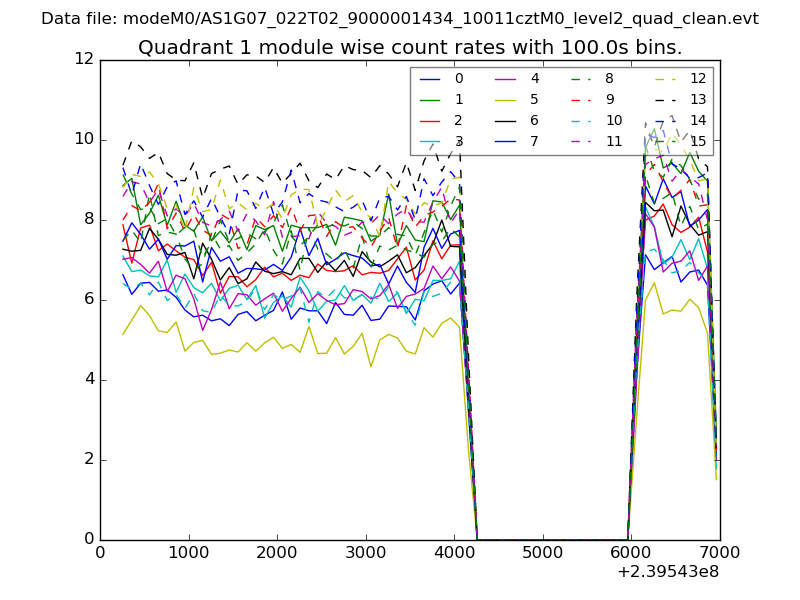 |
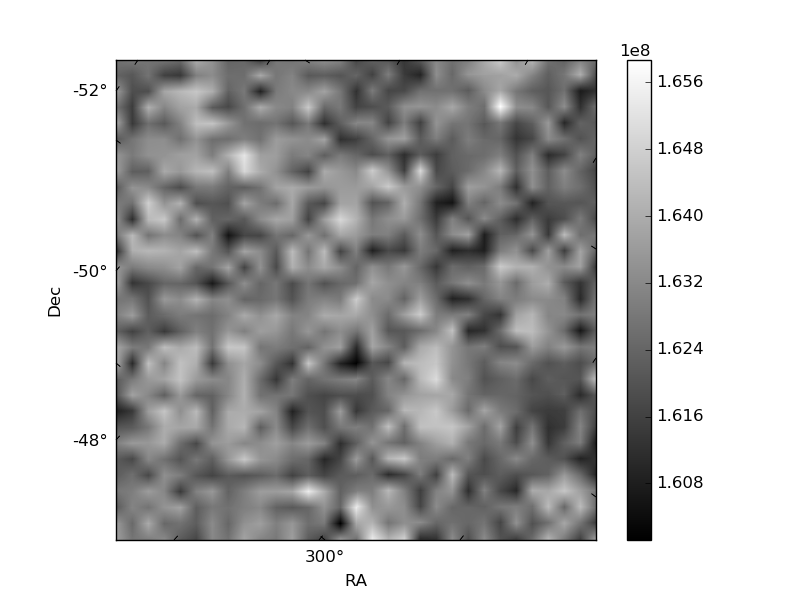 |
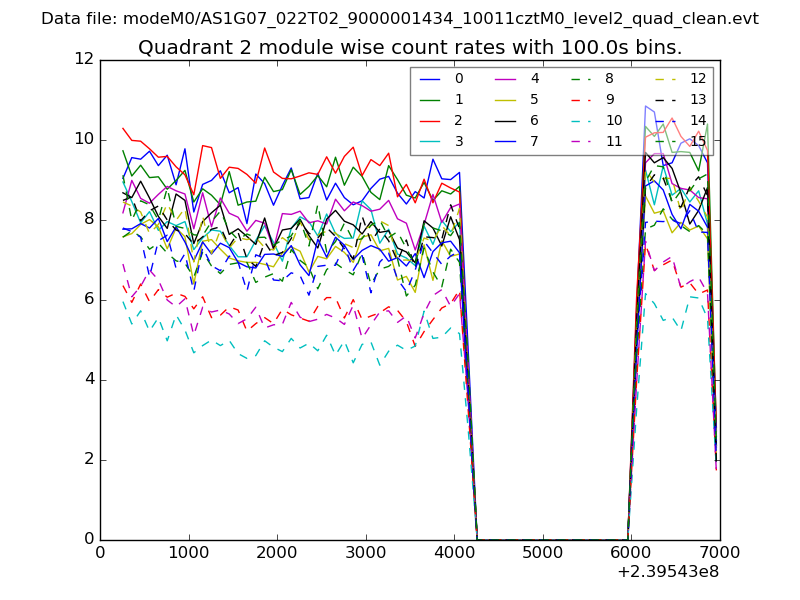
| Module-wise count rates for Quadrant C Data is divided into 100 sec bins |
 |
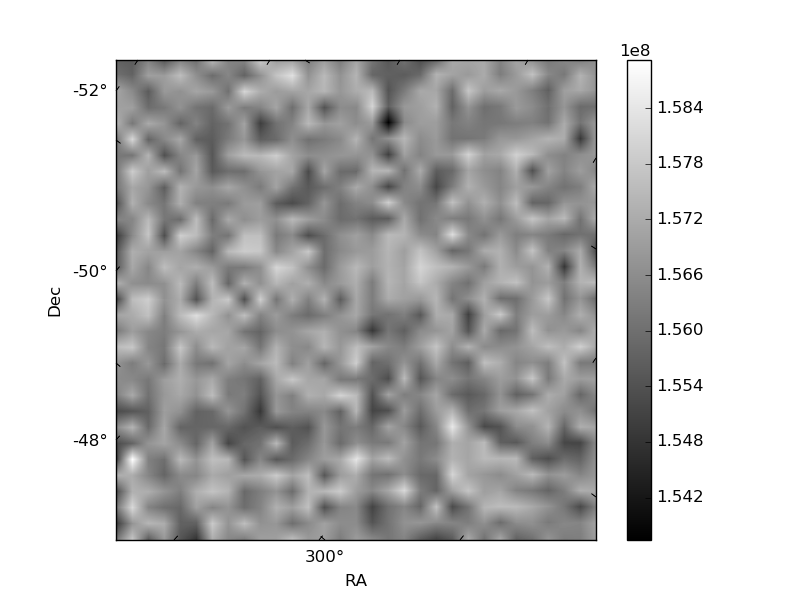 |
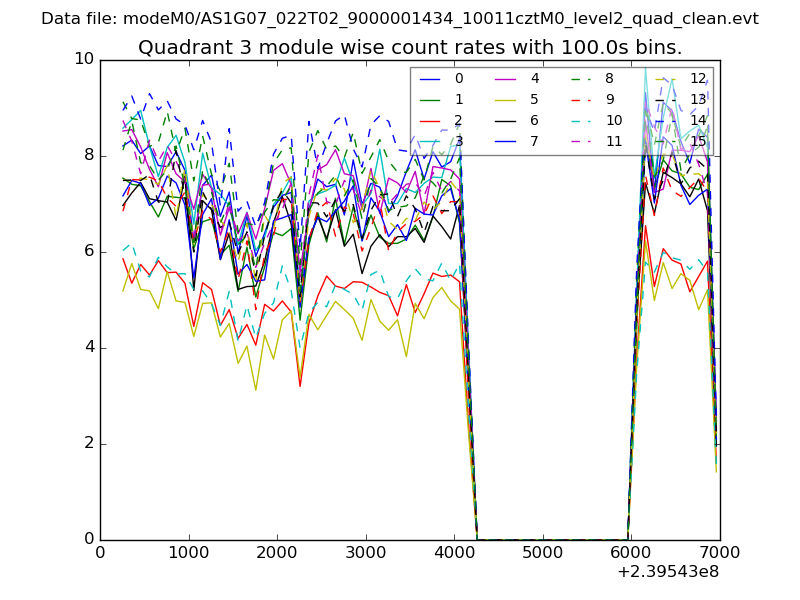
| Module-wise count rates for Quadrant D Data is divided into 100 sec bins |
 |
 |
| Parameter | Plot |
|---|---|
| CZT HV Monitor | 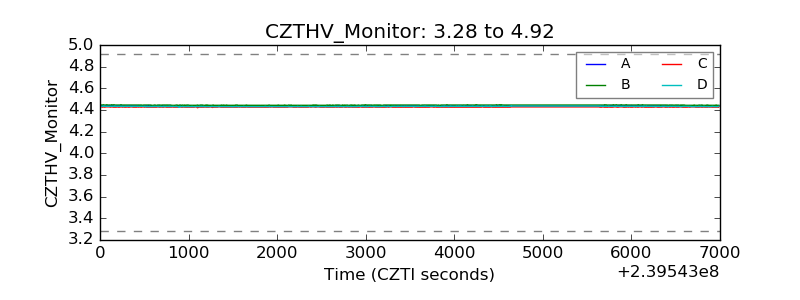 |
| D_VDD | 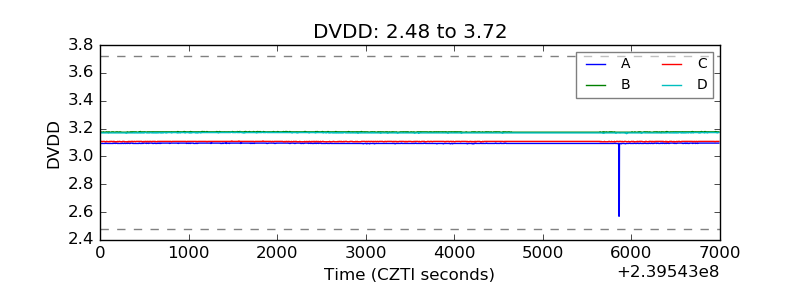 |
| Temperature 1 | 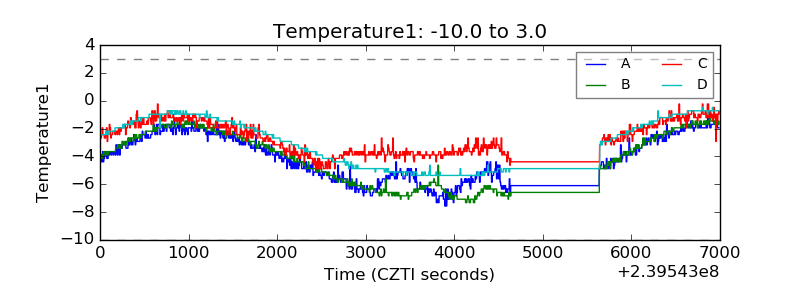 |
| Veto HV Monitor | 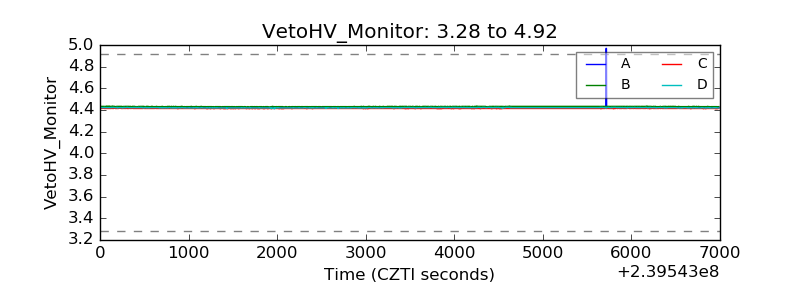 |
| Veto LLD | 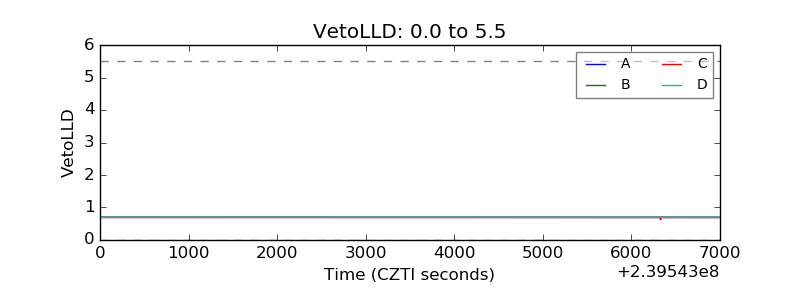 |
| Alpha Counter |  |
| _CPM_Rate | 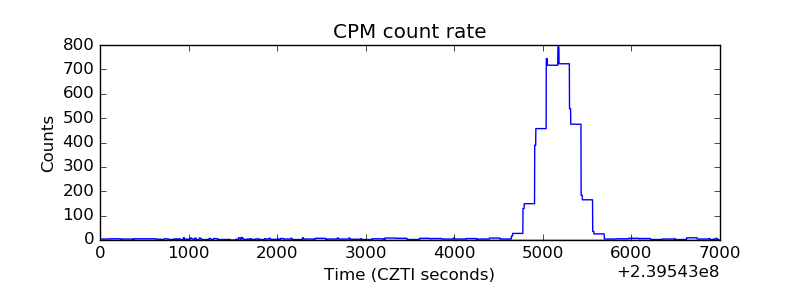 |
| CZT Counter | 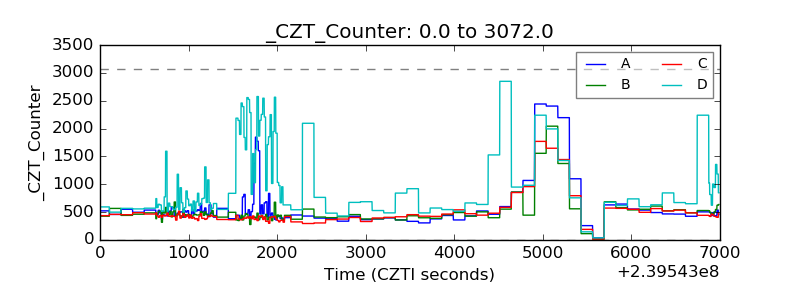 |
| +2.5 Volts monitor |  |
| +5 Volts monitor |  |
| _ROLL_ROT | 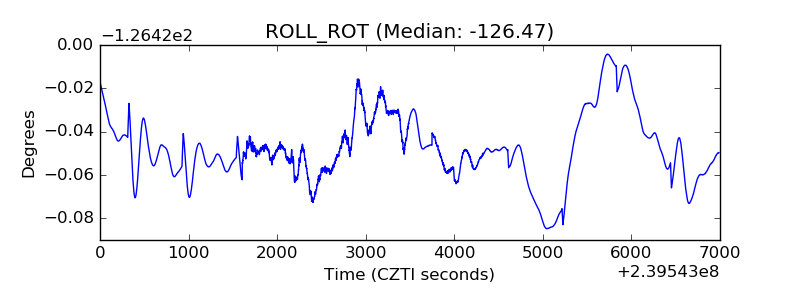 |
| _Roll_DEC | 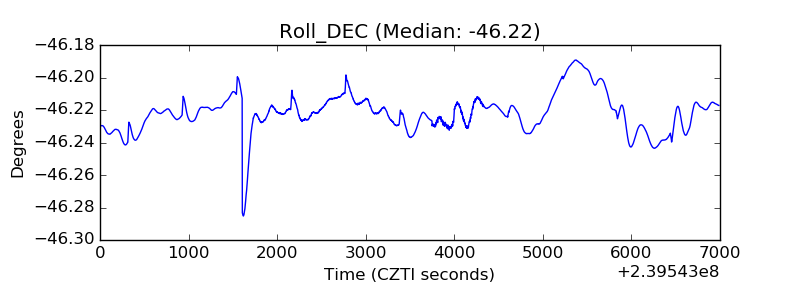 |
| _Roll_RA | 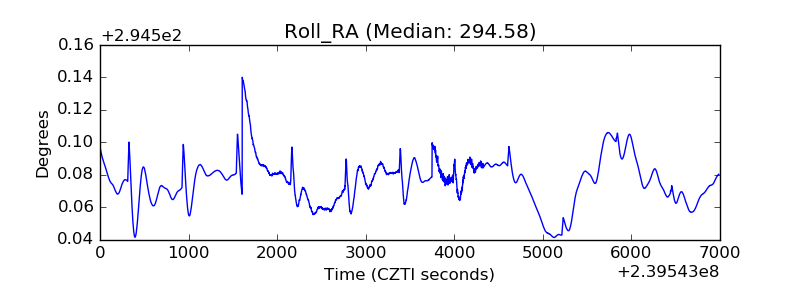 |
| Veto Counter | 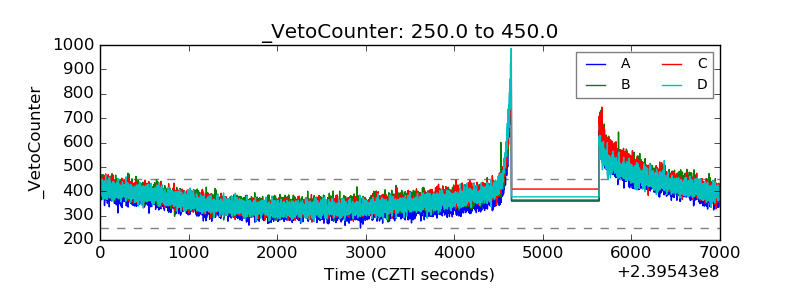 |