| Param | Original file | Final file |
|---|---|---|
| Filename | modeM0/AS1G07_022T02_9000001434_10013cztM0_level2.evt | modeM0/AS1G07_022T02_9000001434_10013cztM0_level2_quad_clean.evt |
| Size (bytes) | 598,023,360 | 107,375,040 |
| Size | 570.3 MB | 102.4 MB |
| Events in quadrant A | 3,504,636 | 701,263 |
| Events in quadrant B | 3,425,048 | 716,456 |
| Events in quadrant C | 3,108,874 | 720,524 |
| Events in quadrant D | 7,613,315 | 640,625 |
| Mode M0 | |||
|---|---|---|---|
| Quadrant | BADHDUFLAG | Total packets | Discarded packets |
| A | 0 | 14927 | 13 |
| B | 0 | 14732 | 7 |
| C | 0 | 14002 | 12 |
| D | 0 | 27467 | 23 |
| Mode M9 | |||
|---|---|---|---|
| Quadrant | BADHDUFLAG | Total packets | Discarded packets |
| A | 0 | 12 | 0 |
| B | 0 | 12 | 0 |
| C | 0 | 12 | 0 |
| D | 0 | 12 | 0 |
| Mode SS | |||
|---|---|---|---|
| Quadrant | BADHDUFLAG | Total packets | Discarded packets |
| A | 0 | 136 | 0 |
| B | 0 | 136 | 0 |
| C | 0 | 136 | 0 |
| D | 0 | 136 | 0 |
| Quadrant | Total seconds | Saturated seconds | Saturation percentage |
|---|---|---|---|
| A | 6787 | 99 | 1.458671% |
| B | 6789 | 70 | 1.031080% |
| C | 6786 | 28 | 0.412614% |
| D | 6786 | 1075 | 15.841438% |
Noise dominated data is calculated using 1-second bins in cleaned event files. If a bin has >2000 counts, and if more than 50% of those come from <1% of pixels, then it is considered to be noise-dominated and hence unusable.
| Quadrant | # 1 sec bins | Bins with >0 counts | Bins with >2000 counts | High rate bins dominated by noise | Noise dominated (total time) | Noise dominated (detector-on time) | Marked lightcurve |
|---|---|---|---|---|---|---|---|
| A | 7911 | 6791 | 18 | 18 | 0.23% | 0.27% | 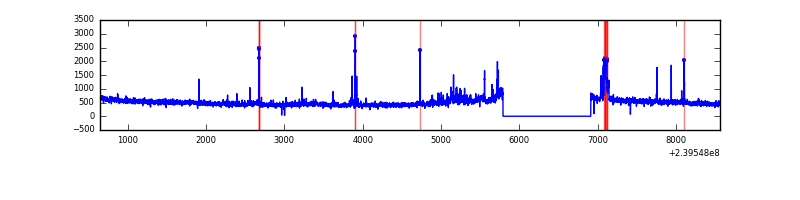 |
| B | 7911 | 6791 | 11 | 11 | 0.14% | 0.16% | 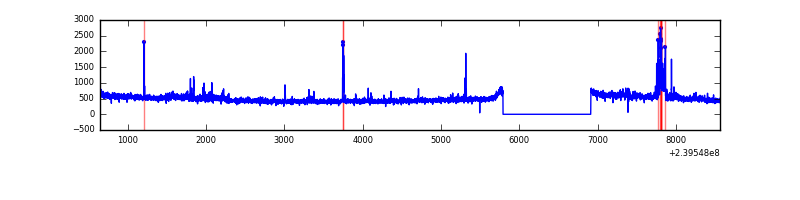 |
| C | 7911 | 6790 | 0 | 0 | 0.00% | 0.00% | 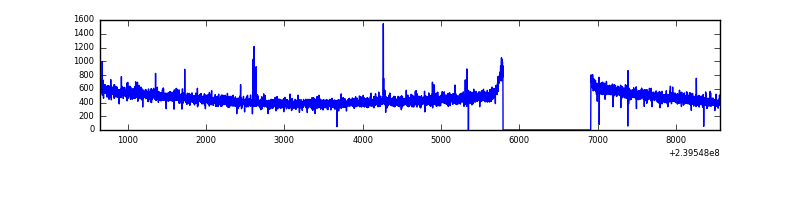 |
| D | 7911 | 6791 | 1221 | 1221 | 15.43% | 17.98% | 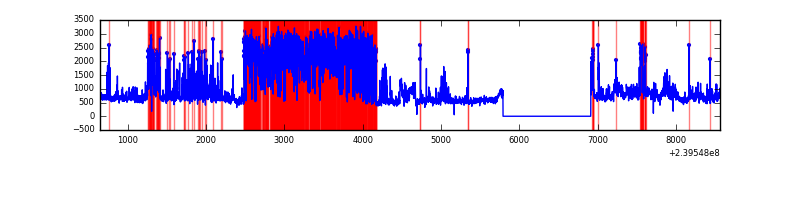 |
Top three noisy pixels from each quadrant. If the there are fewer than three noisy pixels in the level2.evt file, extra rows are filled as -1
| Pixel properties | Quadrant properties | ||||||
|---|---|---|---|---|---|---|---|
| Quadrant | DetID | PixID | Counts | Sigma | Mean | Median | Sigma |
| A | 8 | 15 | 157366 | 945.37 | 818 | 801 | 165.6 |
| A | 15 | 239 | 130378 | 782.41 | 818 | 801 | 165.6 |
| A | 15 | 174 | 38394 | 226.99 | 818 | 801 | 165.6 |
| B | 5 | 255 | 78645 | 497.76 | 820 | 802 | 156.4 |
| B | 0 | 214 | 38136 | 238.73 | 820 | 802 | 156.4 |
| B | 0 | 219 | 32321 | 201.54 | 820 | 802 | 156.4 |
| C | 9 | 221 | 7630 | 37.36 | 792 | 797 | 182.9 |
| C | 14 | 67 | 5972 | 28.3 | 792 | 797 | 182.9 |
| C | 13 | 61 | 5950 | 28.18 | 792 | 797 | 182.9 |
| D | 2 | 16 | 3111353 | 16368.33 | 766 | 745 | 190.0 |
| D | 8 | 195 | 537520 | 2824.56 | 766 | 745 | 190.0 |
| D | 10 | 119 | 522693 | 2746.54 | 766 | 745 | 190.0 |
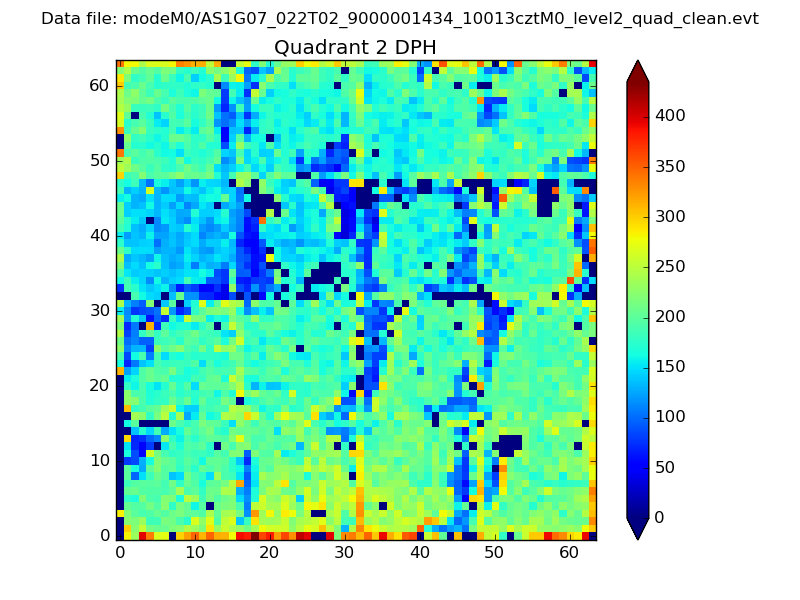
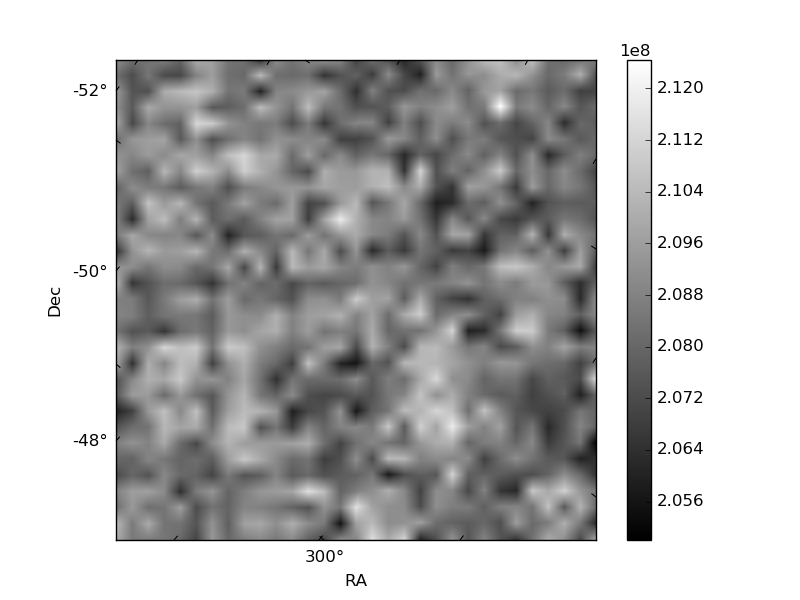
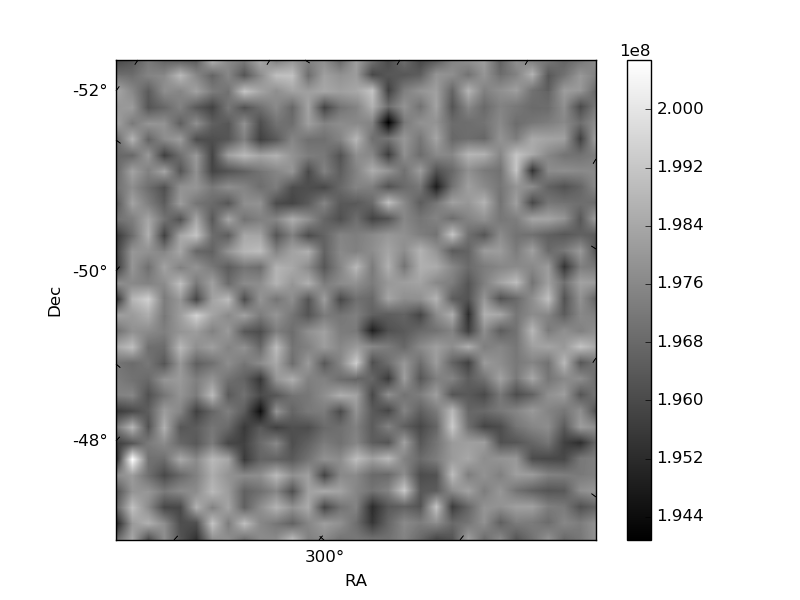
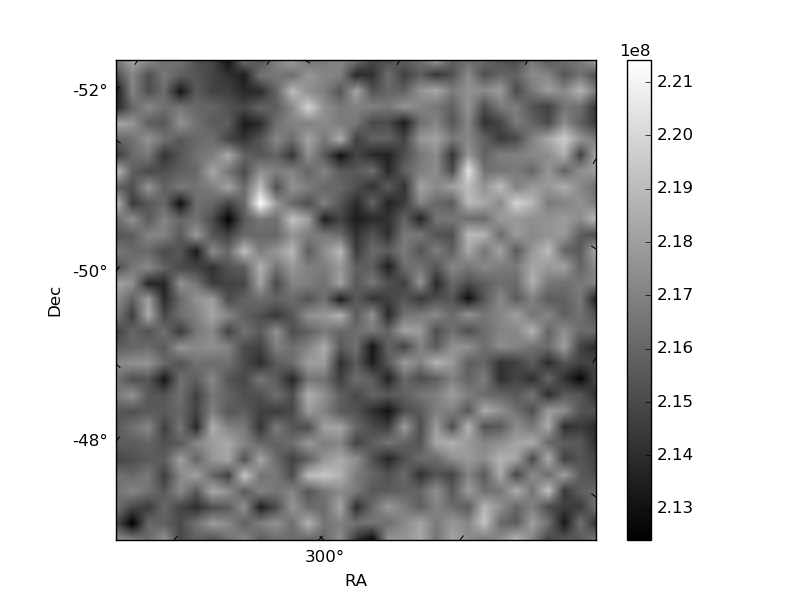
Histogram calculated using DETX and DETY for each event in the final _common_clean file
| Quadrant A |  |
 |
Quadrant B |
|---|---|---|---|
| Quadrant D | 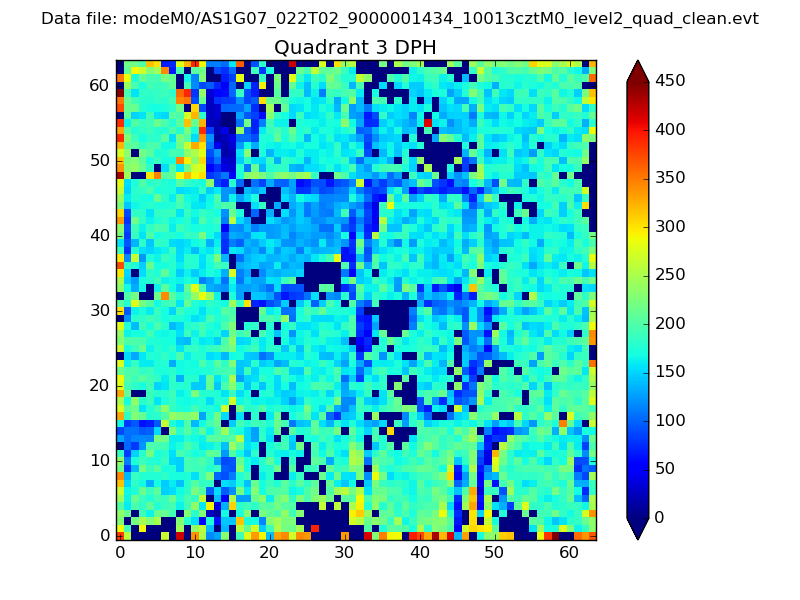 |
 |
Quadrant C |
| Plot type | Count rate plots | Images |
|---|---|---|
| Comparison with Poisson distribution Blue bars denote a histogram of data divided into 1 sec bins. Red curve is a Poisson curve with rate = median count rate of data. |
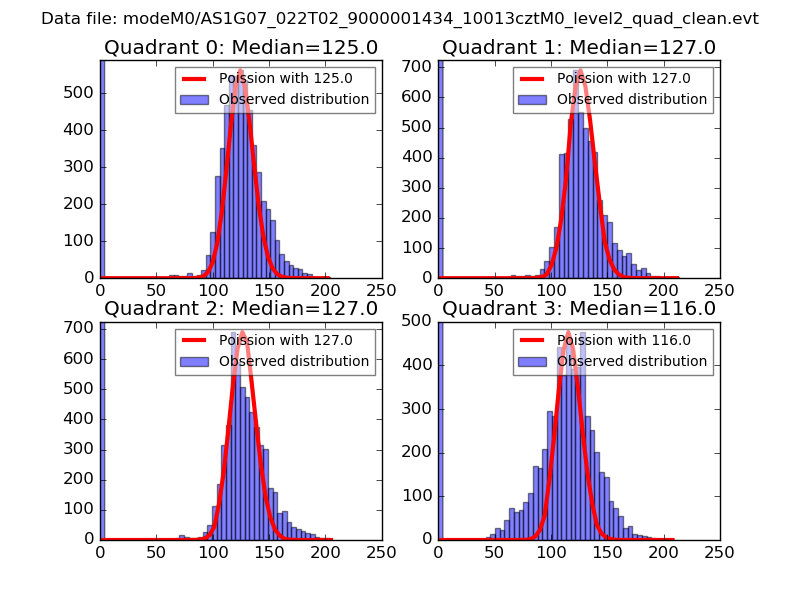 |
 |
| Quadrant-wise count rates Data is divided into 100 sec bins |
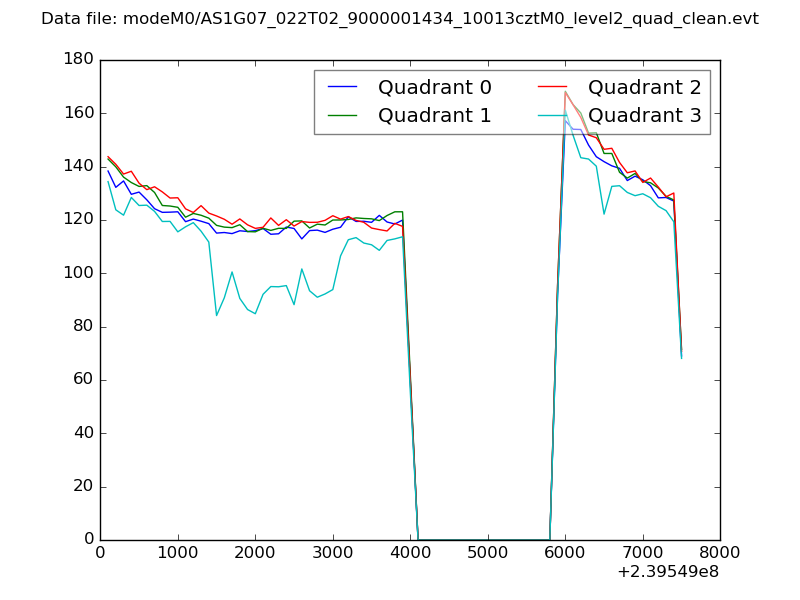 |
|
| Module-wise count rates for Quadrant A Data is divided into 100 sec bins |
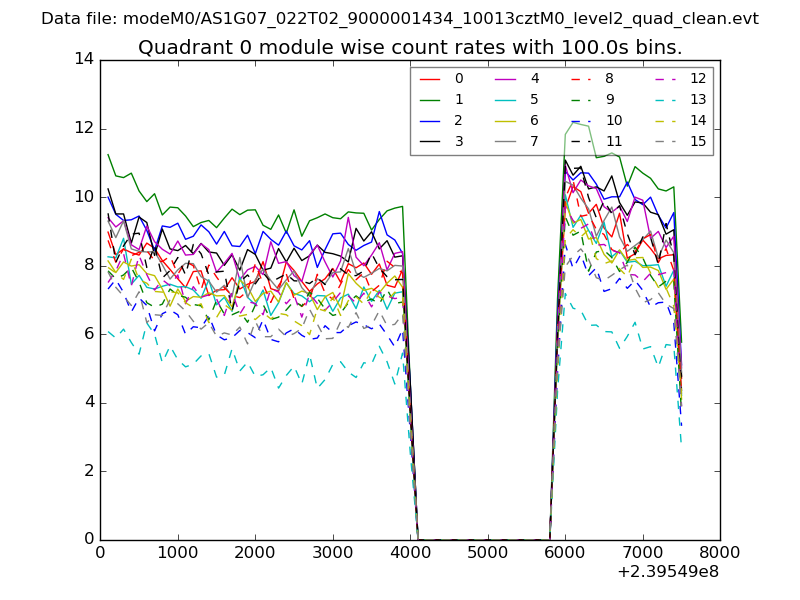 |
 |
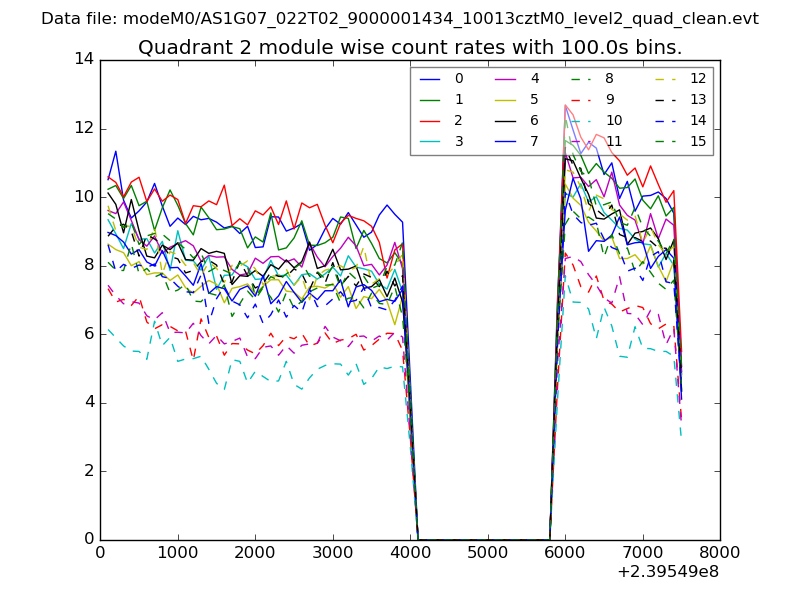
| Module-wise count rates for Quadrant B Data is divided into 100 sec bins |
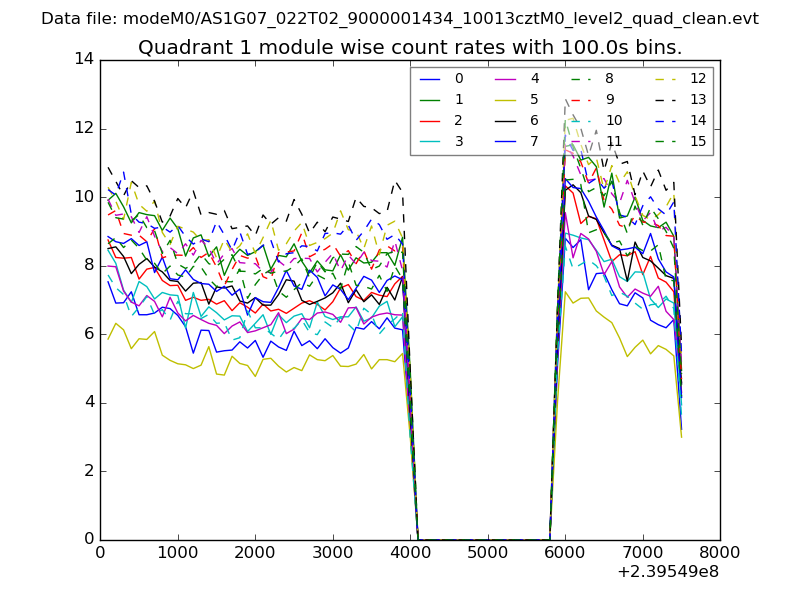 |
 |
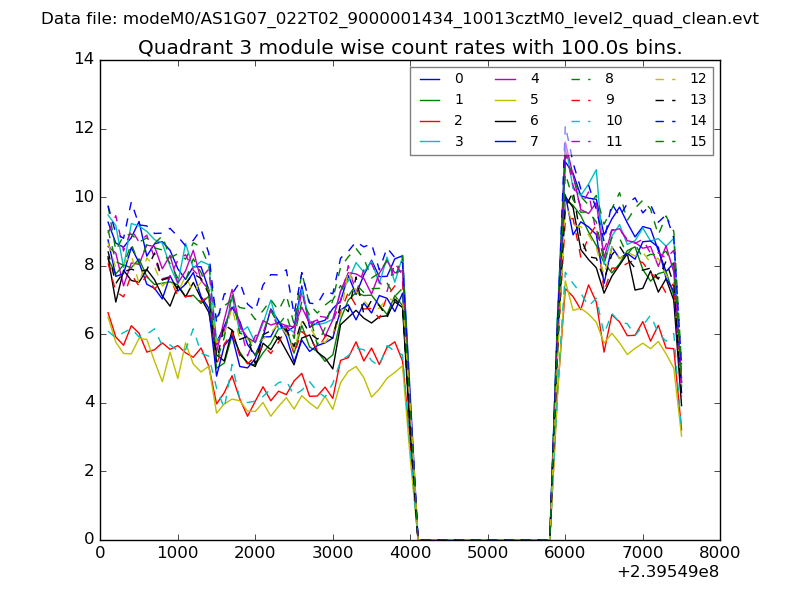
| Module-wise count rates for Quadrant C Data is divided into 100 sec bins |
 |
 |
| Module-wise count rates for Quadrant D Data is divided into 100 sec bins |
 |
 |
| Parameter | Plot |
|---|---|
| CZT HV Monitor | 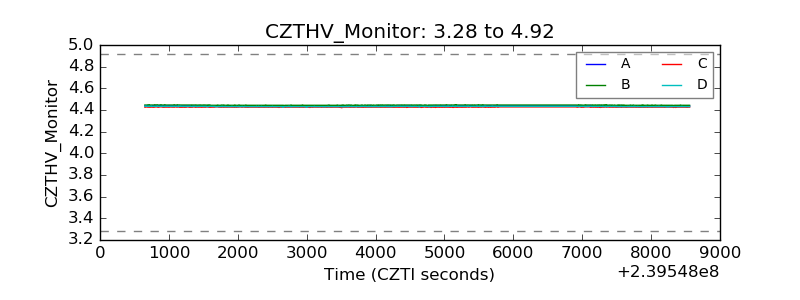 |
| D_VDD | 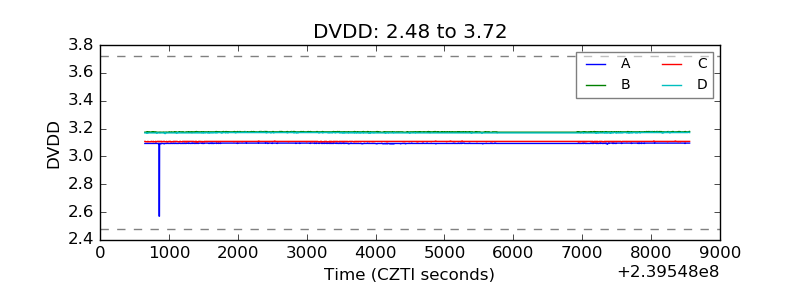 |
| Temperature 1 | 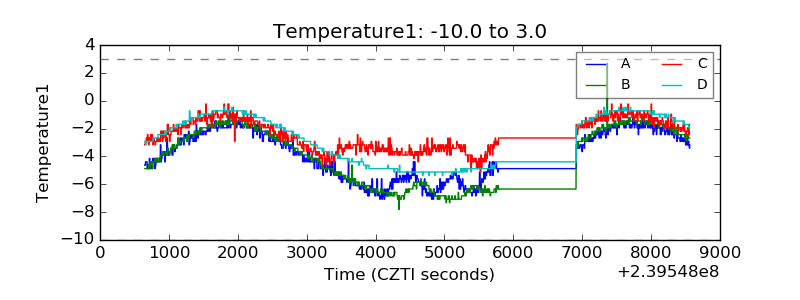 |
| Veto HV Monitor |  |
| Veto LLD |  |
| Alpha Counter | 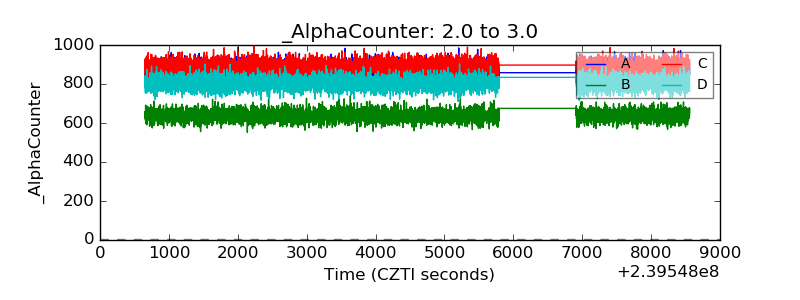 |
| _CPM_Rate | 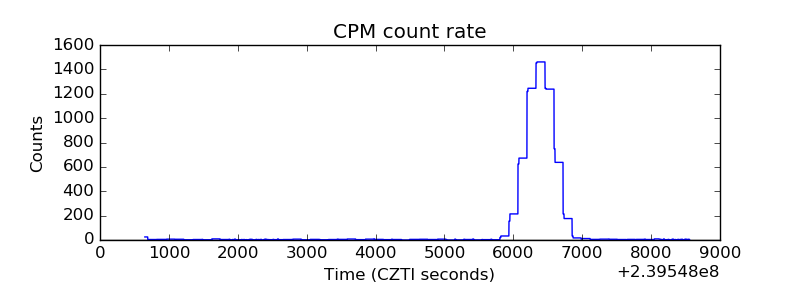 |
| CZT Counter | 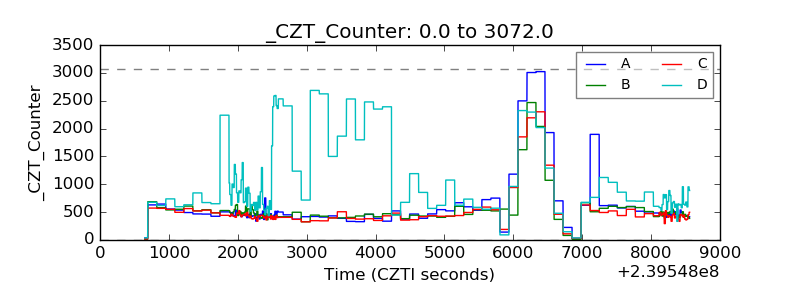 |
| +2.5 Volts monitor |  |
| +5 Volts monitor |  |
| _ROLL_ROT | 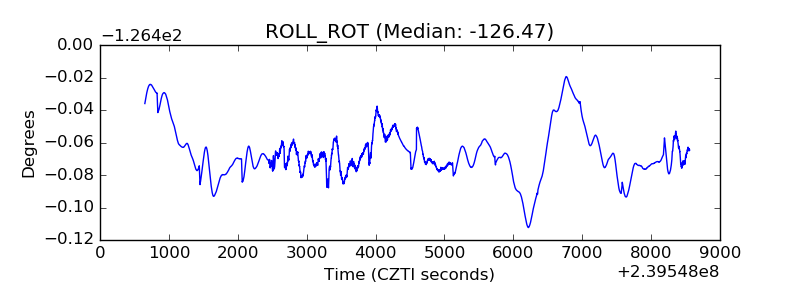 |
| _Roll_DEC | 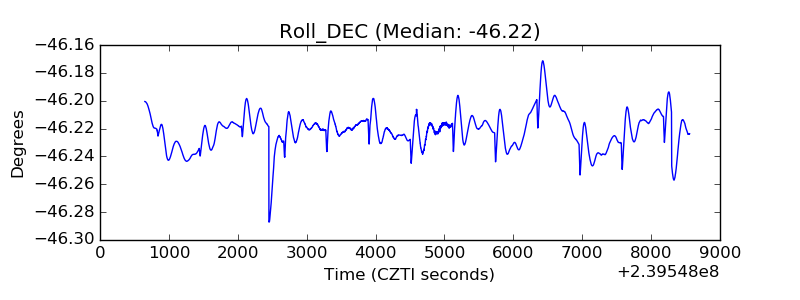 |
| _Roll_RA |  |
| Veto Counter | 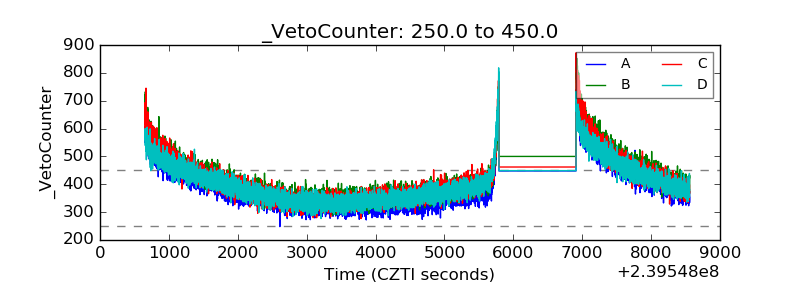 |