| Param | Original file | Final file |
|---|---|---|
| Filename | modeM0/AS1G07_022T02_9000001434_10014cztM0_level2.evt | modeM0/AS1G07_022T02_9000001434_10014cztM0_level2_quad_clean.evt |
| Size (bytes) | 1,567,500,480 | 300,496,320 |
| Size | 1.5 GB | 286.6 MB |
| Events in quadrant A | 10,362,998 | 1,942,973 |
| Events in quadrant B | 10,105,529 | 1,983,094 |
| Events in quadrant C | 9,355,882 | 2,008,111 |
| Events in quadrant D | 16,262,478 | 1,755,557 |
| Mode M0 | |||
|---|---|---|---|
| Quadrant | BADHDUFLAG | Total packets | Discarded packets |
| A | 0 | 49330 | 4810 |
| B | 0 | 48209 | 4373 |
| C | 0 | 46813 | 4185 |
| D | 0 | 75672 | 14018 |
| Mode M9 | |||
|---|---|---|---|
| Quadrant | BADHDUFLAG | Total packets | Discarded packets |
| A | 0 | 49 | 2 |
| B | 0 | 49 | 2 |
| C | 0 | 49 | 1 |
| D | 0 | 49 | 2 |
| Mode SS | |||
|---|---|---|---|
| Quadrant | BADHDUFLAG | Total packets | Discarded packets |
| A | 0 | 461 | 35 |
| B | 0 | 462 | 44 |
| C | 0 | 462 | 42 |
| D | 0 | 461 | 37 |
| Quadrant | Total seconds | Saturated seconds | Saturation percentage |
|---|---|---|---|
| A | 20609 | 317 | 1.538163% |
| B | 20716 | 296 | 1.428847% |
| C | 20760 | 191 | 0.920039% |
| D | 19774 | 1401 | 7.085061% |
Noise dominated data is calculated using 1-second bins in cleaned event files. If a bin has >2000 counts, and if more than 50% of those come from <1% of pixels, then it is considered to be noise-dominated and hence unusable.
| Quadrant | # 1 sec bins | Bins with >0 counts | Bins with >2000 counts | High rate bins dominated by noise | Noise dominated (total time) | Noise dominated (detector-on time) | Marked lightcurve |
|---|---|---|---|---|---|---|---|
| A | 27546 | 21876 | 35 | 35 | 0.13% | 0.16% | 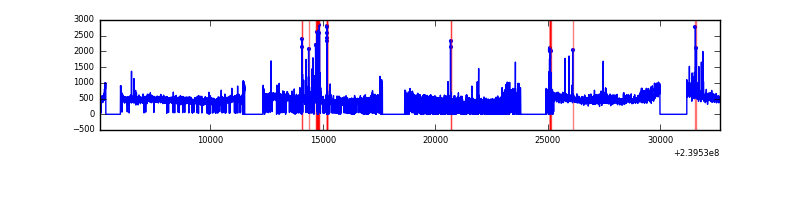 |
| B | 27546 | 21951 | 30 | 30 | 0.11% | 0.14% | 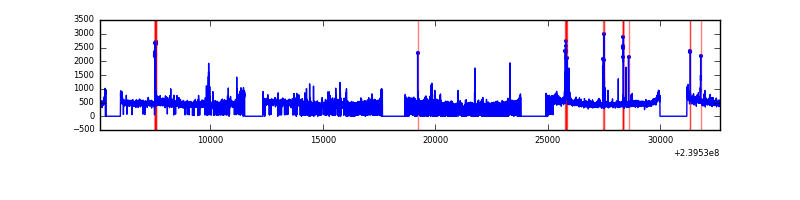 |
| C | 27546 | 21980 | 0 | 0 | 0.00% | 0.00% | 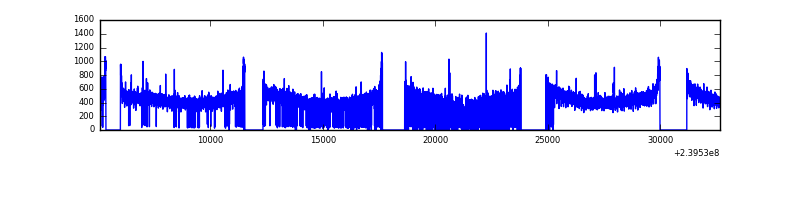 |
| D | 27546 | 21036 | 1287 | 1287 | 4.67% | 6.12% | 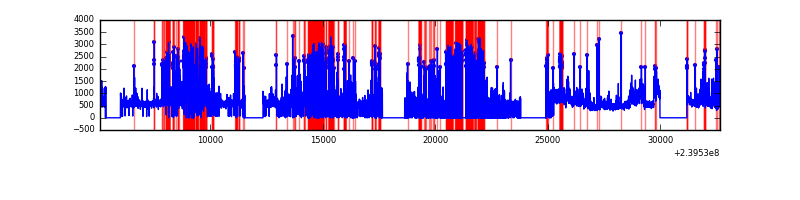 |
Top three noisy pixels from each quadrant. If the there are fewer than three noisy pixels in the level2.evt file, extra rows are filled as -1
| Pixel properties | Quadrant properties | ||||||
|---|---|---|---|---|---|---|---|
| Quadrant | DetID | PixID | Counts | Sigma | Mean | Median | Sigma |
| A | 8 | 15 | 717138 | 1468.24 | 2430 | 2379 | 486.8 |
| A | 15 | 239 | 131734 | 265.72 | 2430 | 2379 | 486.8 |
| A | 15 | 174 | 123097 | 247.98 | 2430 | 2379 | 486.8 |
| B | 0 | 214 | 110414 | 233.6 | 2452 | 2393 | 462.4 |
| B | 4 | 81 | 82499 | 173.23 | 2452 | 2393 | 462.4 |
| B | 5 | 255 | 81447 | 170.96 | 2452 | 2393 | 462.4 |
| C | 13 | 61 | 17575 | 27.54 | 2391 | 2406 | 550.7 |
| C | 14 | 67 | 17096 | 26.67 | 2391 | 2406 | 550.7 |
| C | 9 | 221 | 8237 | 10.59 | 2391 | 2406 | 550.7 |
| D | 2 | 16 | 3034946 | 5532.94 | 2228 | 2177 | 548.1 |
| D | 8 | 195 | 1602214 | 2919.08 | 2228 | 2177 | 548.1 |
| D | 10 | 118 | 1464647 | 2668.11 | 2228 | 2177 | 548.1 |
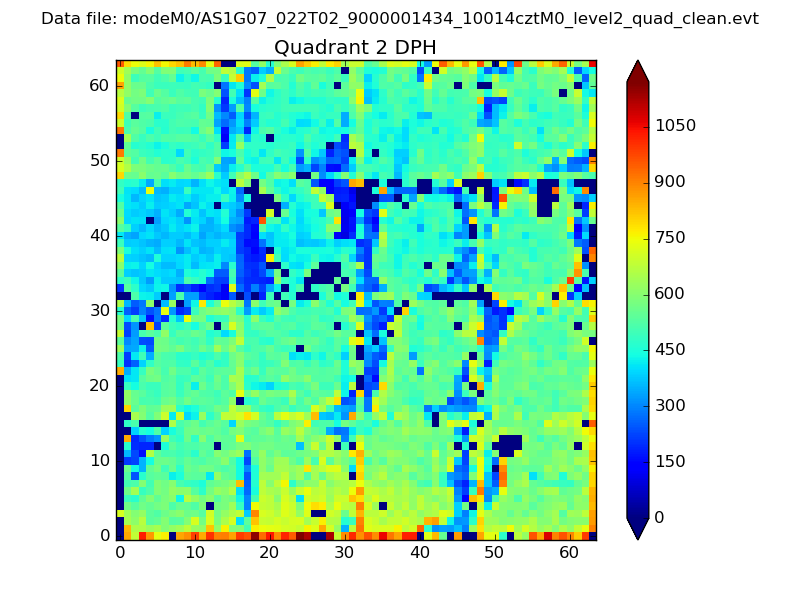
Histogram calculated using DETX and DETY for each event in the final _common_clean file
| Quadrant A | 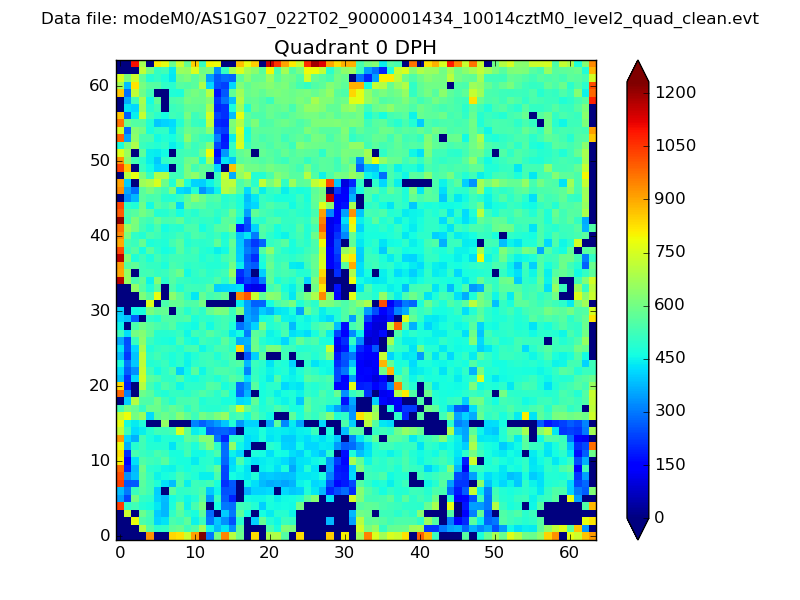 |
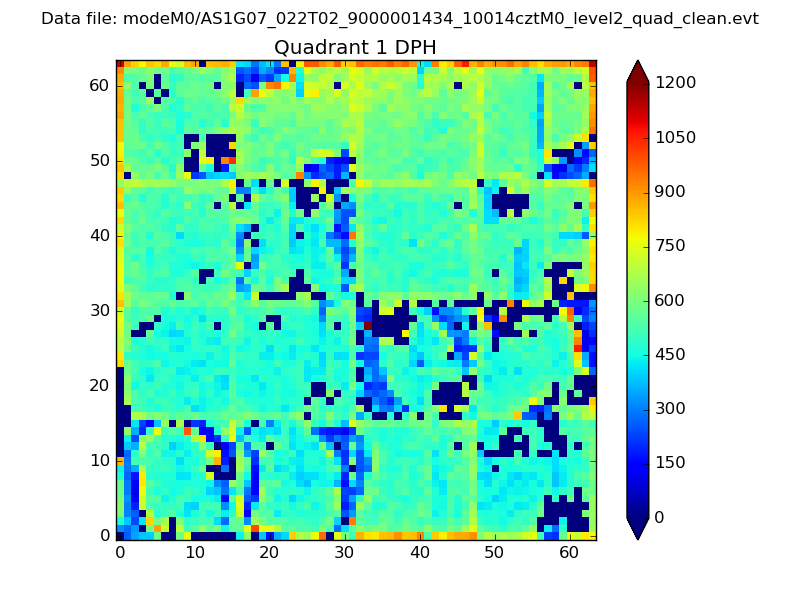 |
Quadrant B |
|---|---|---|---|
| Quadrant D | 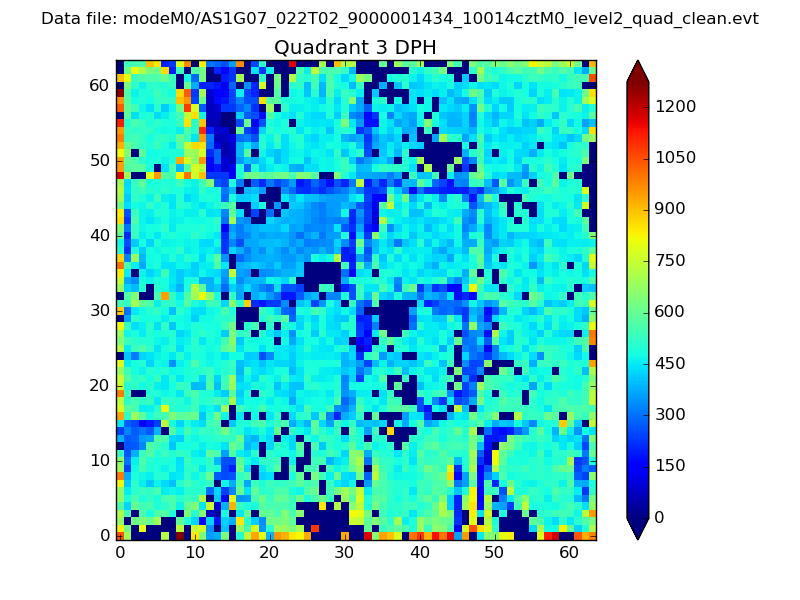 |
 |
Quadrant C |
| Plot type | Count rate plots | Images |
|---|---|---|
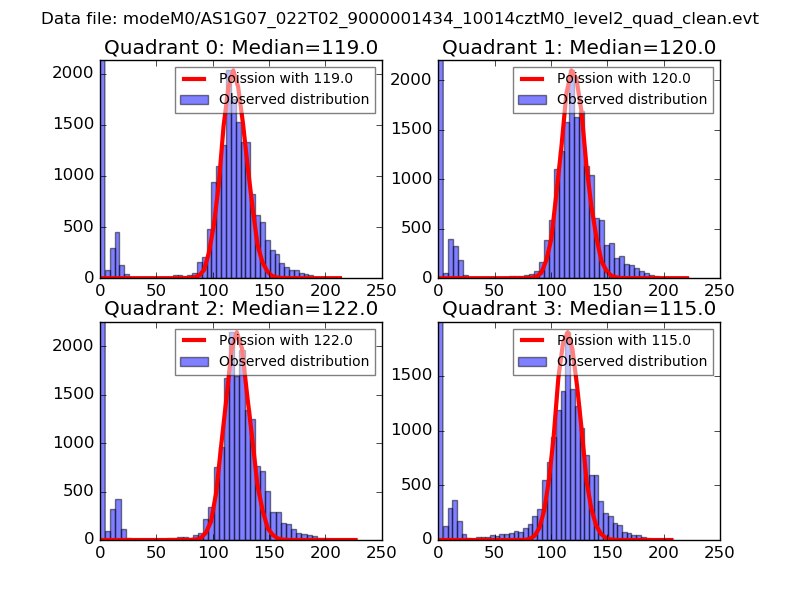
| Comparison with Poisson distribution Blue bars denote a histogram of data divided into 1 sec bins. Red curve is a Poisson curve with rate = median count rate of data. |
 |
 |
| Quadrant-wise count rates Data is divided into 100 sec bins |
 |
|
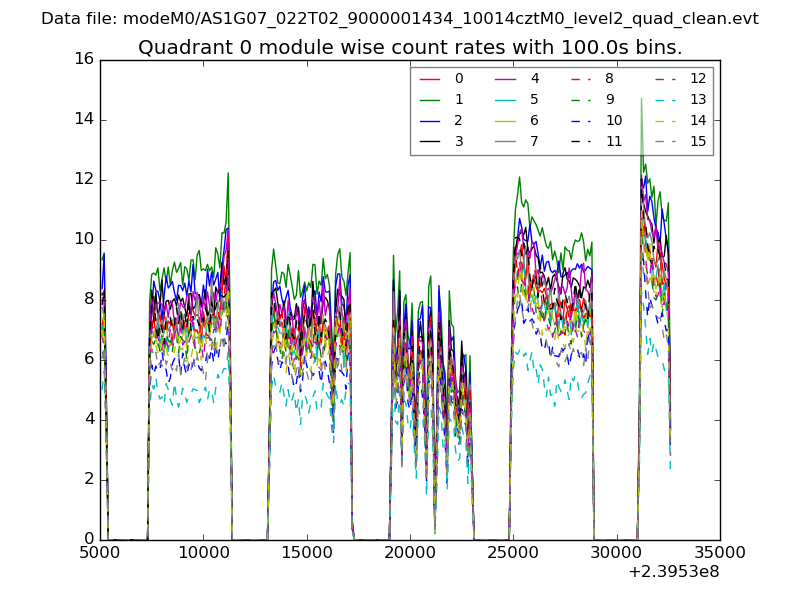
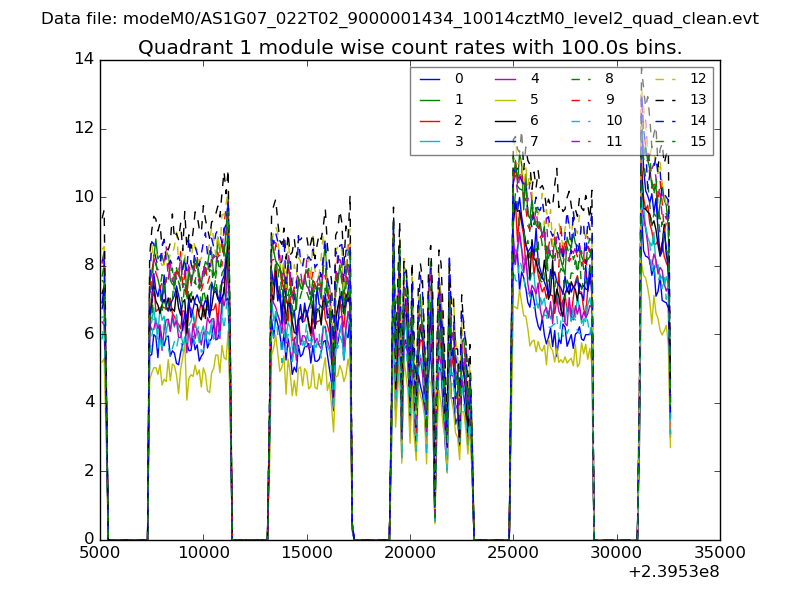
| Module-wise count rates for Quadrant A Data is divided into 100 sec bins |
 |
 |
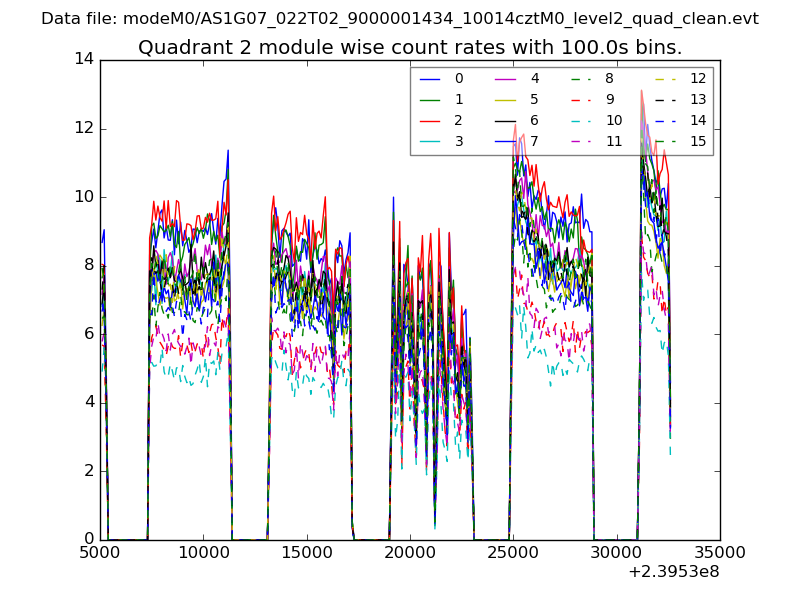
| Module-wise count rates for Quadrant B Data is divided into 100 sec bins |
 |
 |
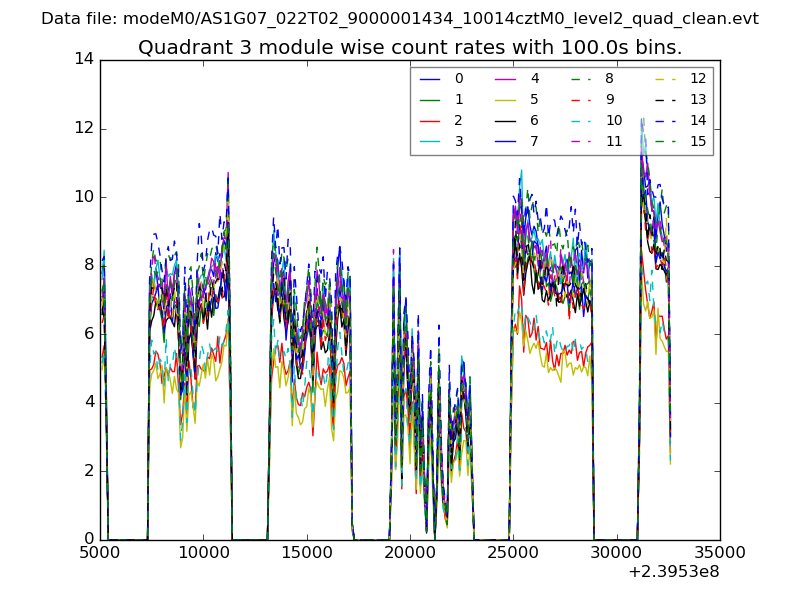
| Module-wise count rates for Quadrant C Data is divided into 100 sec bins |
 |
 |
| Module-wise count rates for Quadrant D Data is divided into 100 sec bins |
 |
 |
| Parameter | Plot |
|---|---|
| CZT HV Monitor | 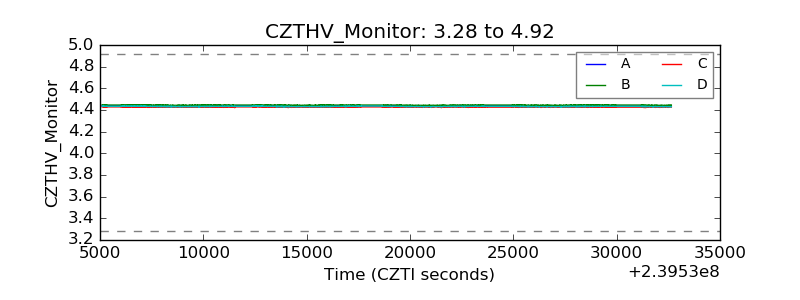 |
| D_VDD | 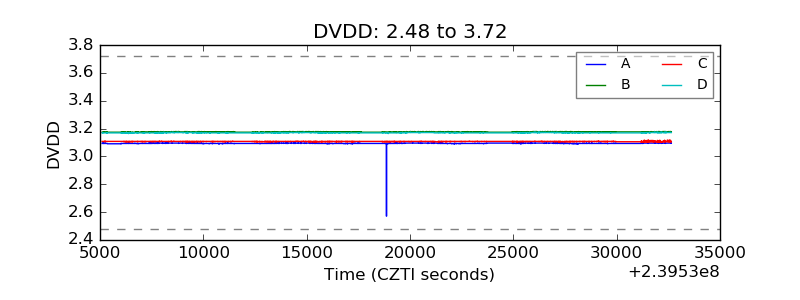 |
| Temperature 1 |  |
| Veto HV Monitor | 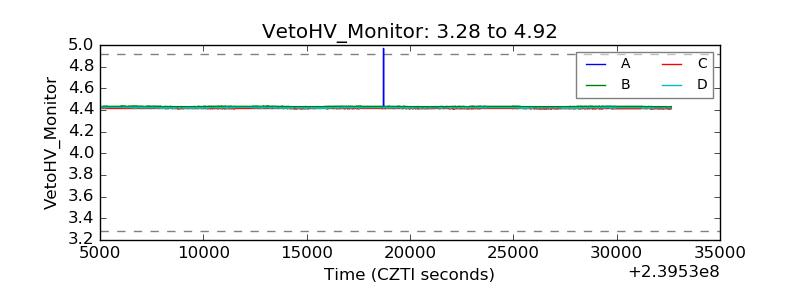 |
| Veto LLD | 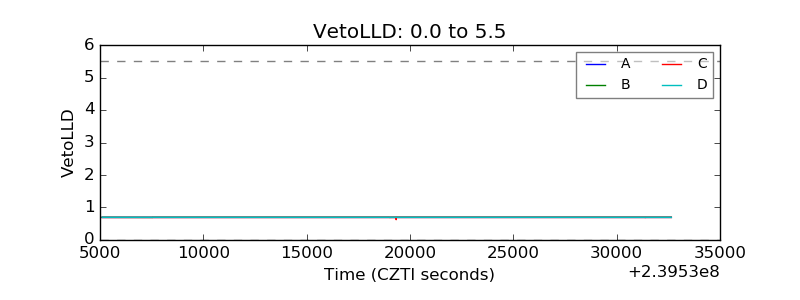 |
| Alpha Counter | 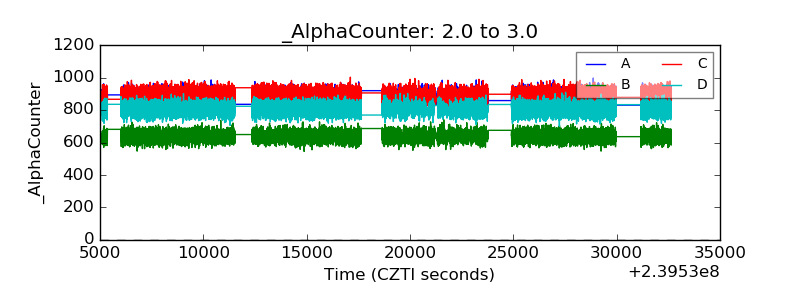 |
| _CPM_Rate | 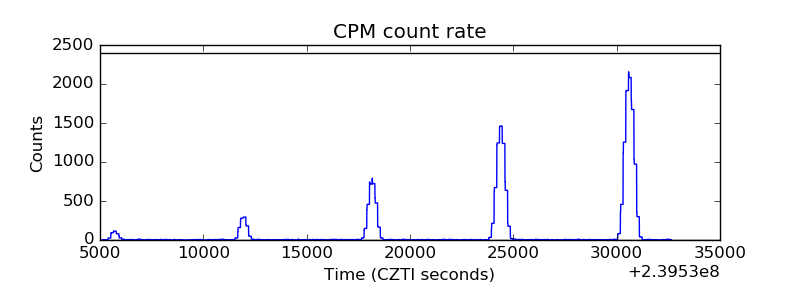 |
| CZT Counter | 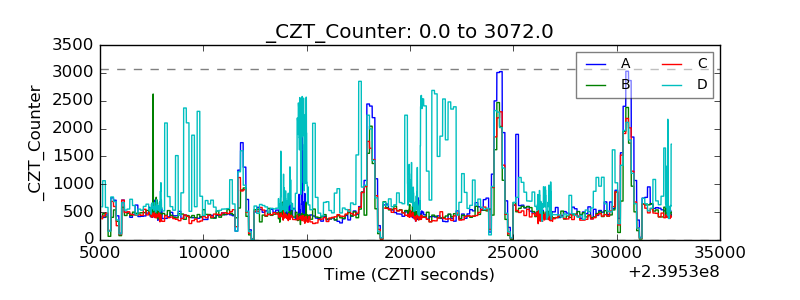 |
| +2.5 Volts monitor |  |
| +5 Volts monitor |  |
| _ROLL_ROT | 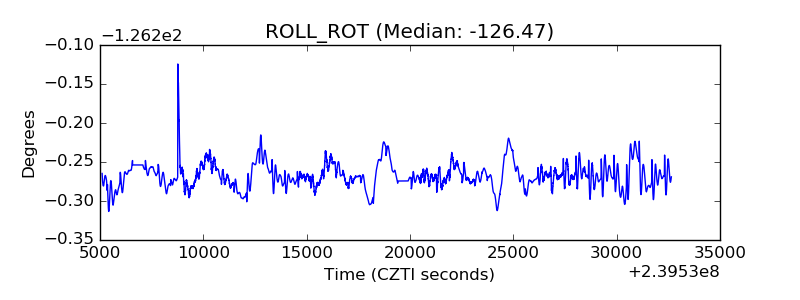 |
| _Roll_DEC | 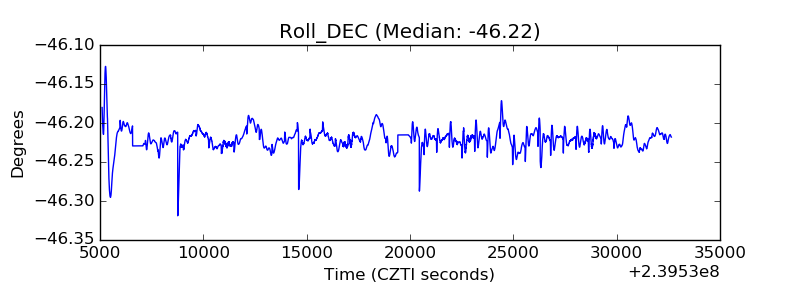 |
| _Roll_RA | 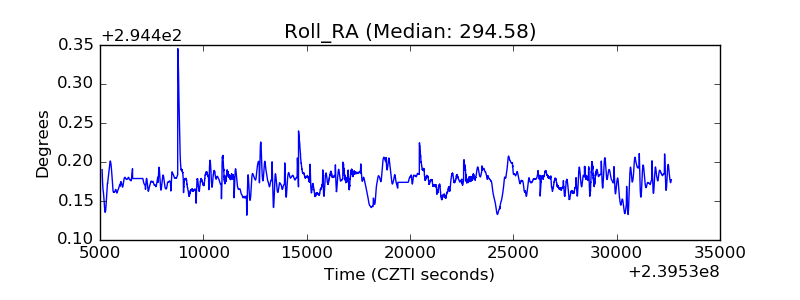 |
| Veto Counter | 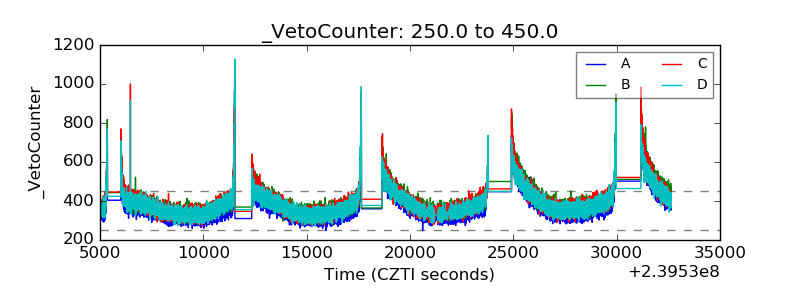 |