| Param | Original file | Final file |
|---|---|---|
| Filename | modeM0/AS1G07_022T02_9000001434_10016cztM0_level2.evt | modeM0/AS1G07_022T02_9000001434_10016cztM0_level2_quad_clean.evt |
| Size (bytes) | 387,987,840 | 80,421,120 |
| Size | 370.0 MB | 76.7 MB |
| Events in quadrant A | 2,639,818 | 517,955 |
| Events in quadrant B | 2,833,234 | 536,848 |
| Events in quadrant C | 2,571,206 | 529,951 |
| Events in quadrant D | 3,330,838 | 465,361 |
| Mode M0 | |||
|---|---|---|---|
| Quadrant | BADHDUFLAG | Total packets | Discarded packets |
| A | 0 | 13010 | 1435 |
| B | 0 | 13343 | 1328 |
| C | 0 | 12716 | 1272 |
| D | 0 | 16317 | 2843 |
| Mode M9 | |||
|---|---|---|---|
| Quadrant | BADHDUFLAG | Total packets | Discarded packets |
| A | 0 | 21 | 2 |
| B | 0 | 21 | 1 |
| C | 0 | 21 | 0 |
| D | 0 | 22 | 2 |
| Mode SS | |||
|---|---|---|---|
| Quadrant | BADHDUFLAG | Total packets | Discarded packets |
| A | 0 | 124 | 10 |
| B | 0 | 124 | 8 |
| C | 0 | 124 | 8 |
| D | 0 | 124 | 14 |
| Quadrant | Total seconds | Saturated seconds | Saturation percentage |
|---|---|---|---|
| A | 5495 | 60 | 1.091902% |
| B | 5564 | 66 | 1.186197% |
| C | 5549 | 28 | 0.504595% |
| D | 5340 | 92 | 1.722846% |
Noise dominated data is calculated using 1-second bins in cleaned event files. If a bin has >2000 counts, and if more than 50% of those come from <1% of pixels, then it is considered to be noise-dominated and hence unusable.
| Quadrant | # 1 sec bins | Bins with >0 counts | Bins with >2000 counts | High rate bins dominated by noise | Noise dominated (total time) | Noise dominated (detector-on time) | Marked lightcurve |
|---|---|---|---|---|---|---|---|
| A | 7503 | 5971 | 0 | 0 | 0.00% | 0.00% | 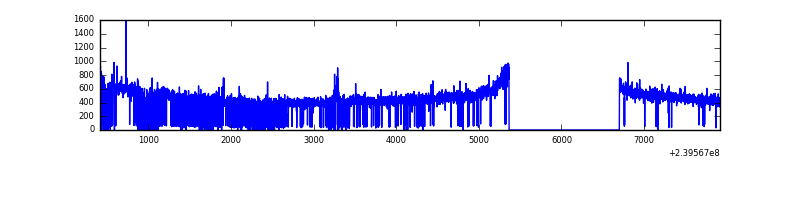 |
| B | 7503 | 5999 | 2 | 2 | 0.03% | 0.03% | 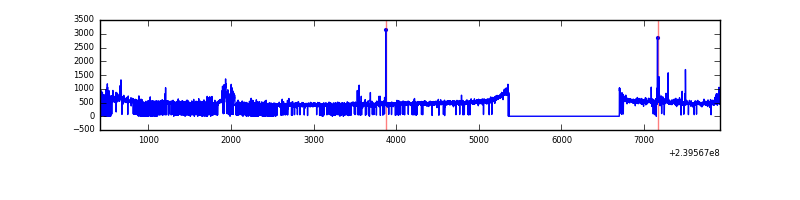 |
| C | 7503 | 6004 | 1 | 1 | 0.01% | 0.02% | 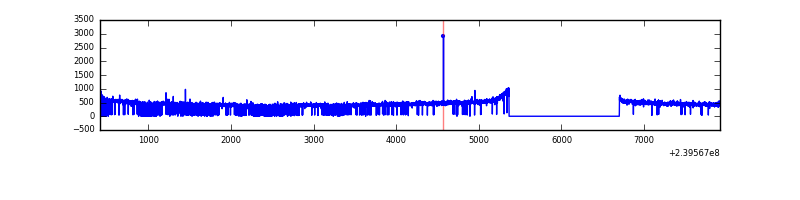 |
| D | 7503 | 5817 | 47 | 47 | 0.63% | 0.81% | 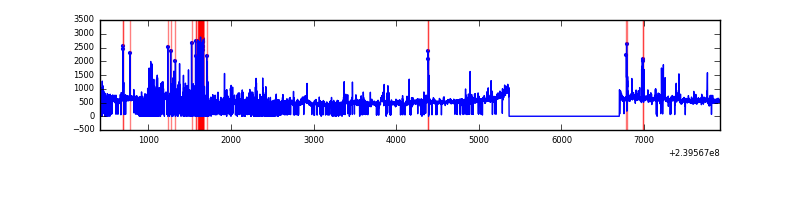 |
Top three noisy pixels from each quadrant. If the there are fewer than three noisy pixels in the level2.evt file, extra rows are filled as -1
| Pixel properties | Quadrant properties | ||||||
|---|---|---|---|---|---|---|---|
| Quadrant | DetID | PixID | Counts | Sigma | Mean | Median | Sigma |
| A | 8 | 15 | 42860 | 312.05 | 669 | 655 | 135.2 |
| A | 15 | 239 | 17506 | 124.59 | 669 | 655 | 135.2 |
| A | 13 | 251 | 6980 | 46.77 | 669 | 655 | 135.2 |
| B | 0 | 219 | 101768 | 784.29 | 686 | 672 | 128.9 |
| B | 4 | 239 | 17369 | 129.53 | 686 | 672 | 128.9 |
| B | 12 | 111 | 13203 | 97.21 | 686 | 672 | 128.9 |
| C | 14 | 67 | 6035 | 35.52 | 657 | 661 | 151.3 |
| C | 13 | 61 | 4948 | 28.34 | 657 | 661 | 151.3 |
| C | 14 | 234 | 3926 | 21.58 | 657 | 661 | 151.3 |
| D | 8 | 195 | 384783 | 2422.37 | 617 | 602 | 158.6 |
| D | 2 | 16 | 286174 | 1800.61 | 617 | 602 | 158.6 |
| D | 7 | 71 | 123789 | 776.73 | 617 | 602 | 158.6 |
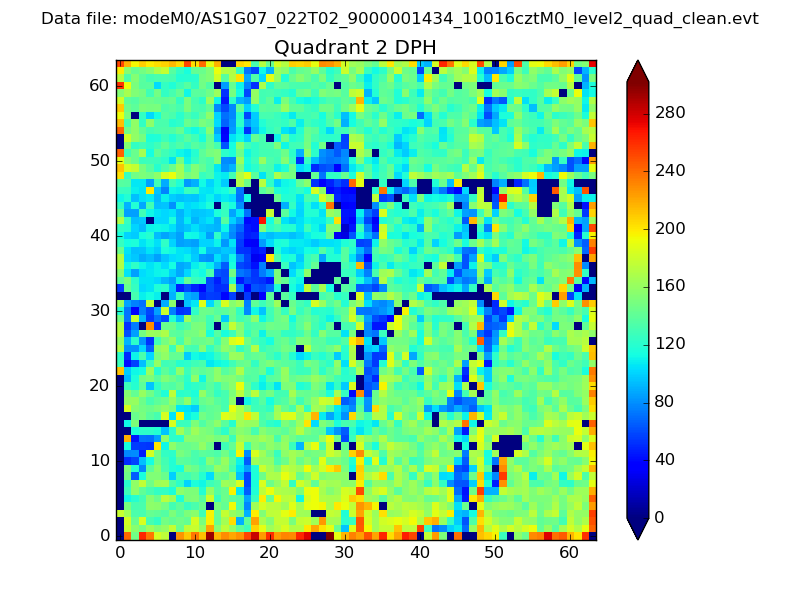
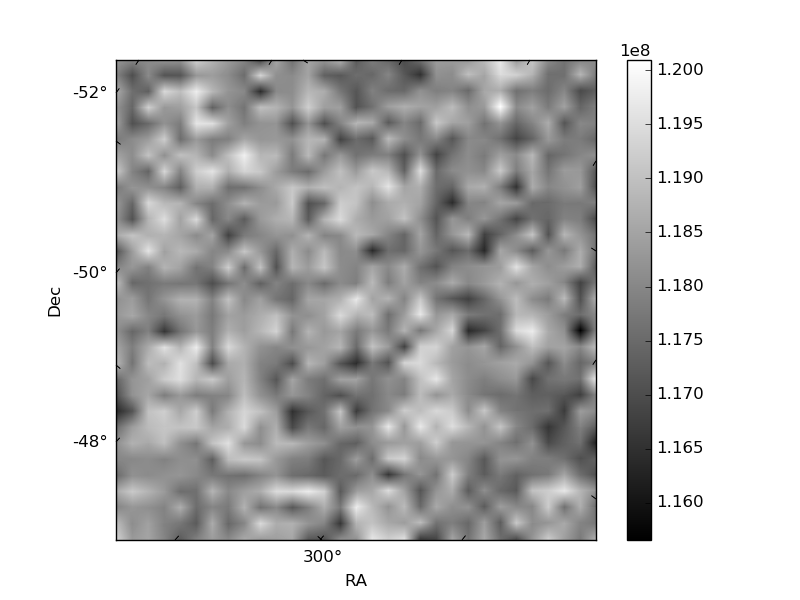
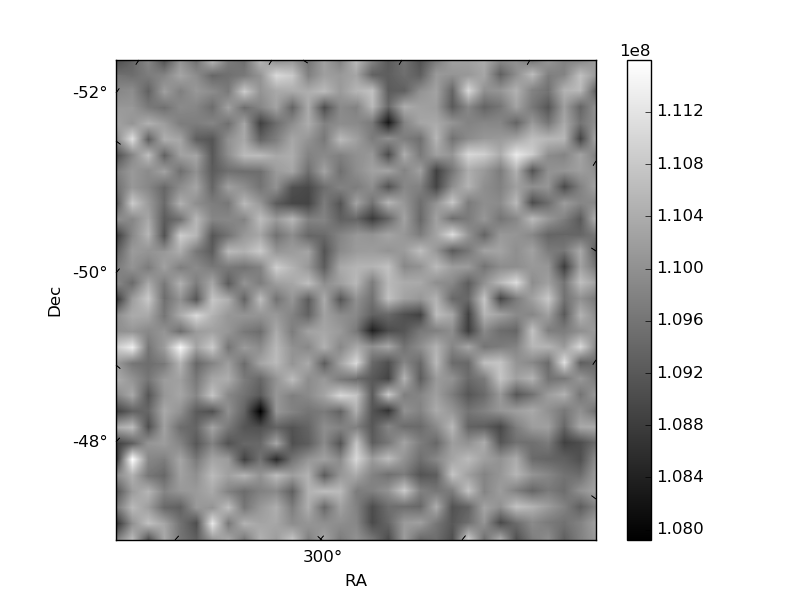
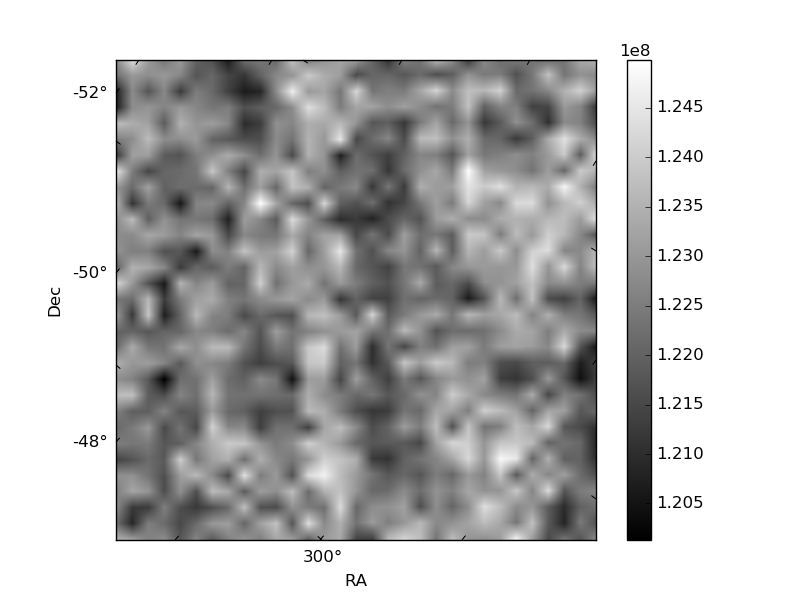
Histogram calculated using DETX and DETY for each event in the final _common_clean file
| Quadrant A | 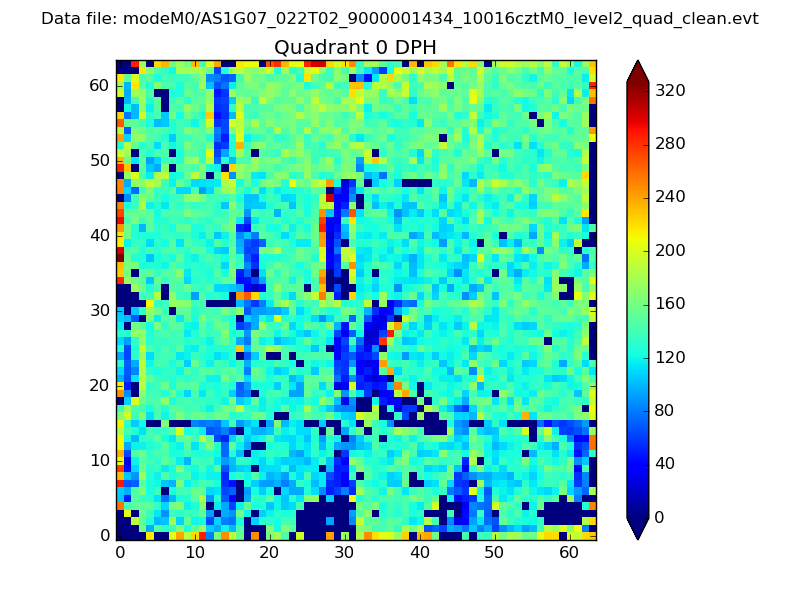 |
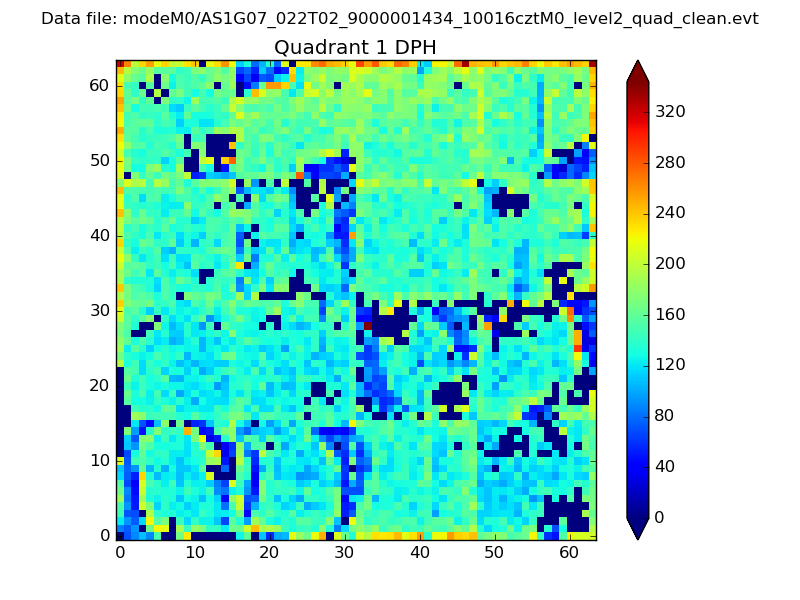 |
Quadrant B |
|---|---|---|---|
| Quadrant D | 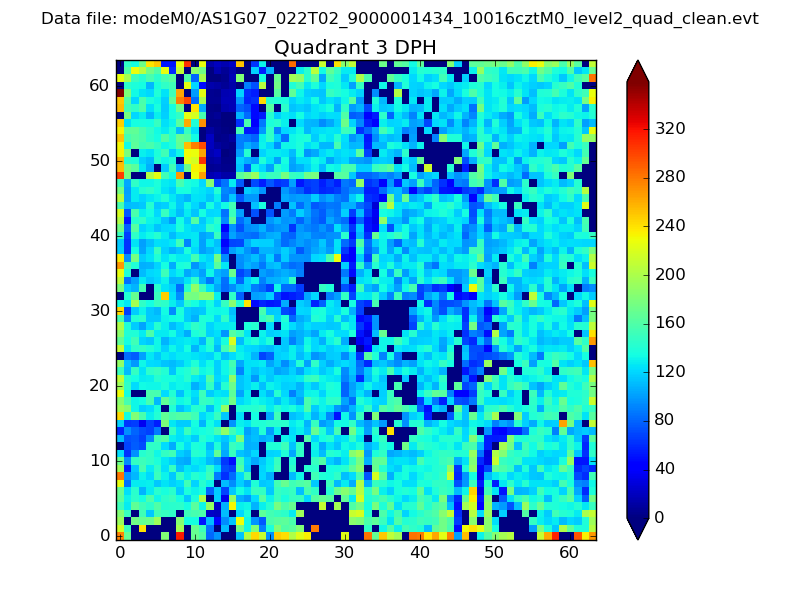 |
 |
Quadrant C |
| Plot type | Count rate plots | Images |
|---|---|---|
| Comparison with Poisson distribution Blue bars denote a histogram of data divided into 1 sec bins. Red curve is a Poisson curve with rate = median count rate of data. |
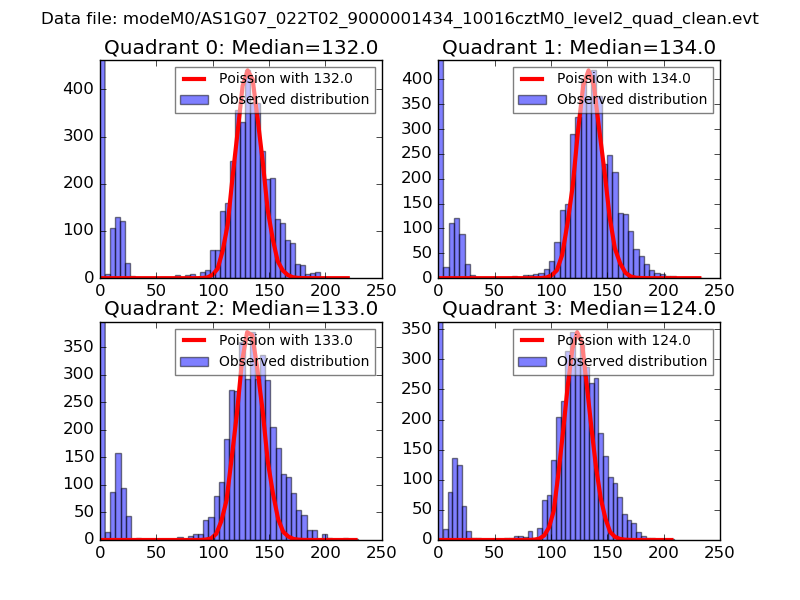 |
 |
| Quadrant-wise count rates Data is divided into 100 sec bins |
 |
|
| Module-wise count rates for Quadrant A Data is divided into 100 sec bins |
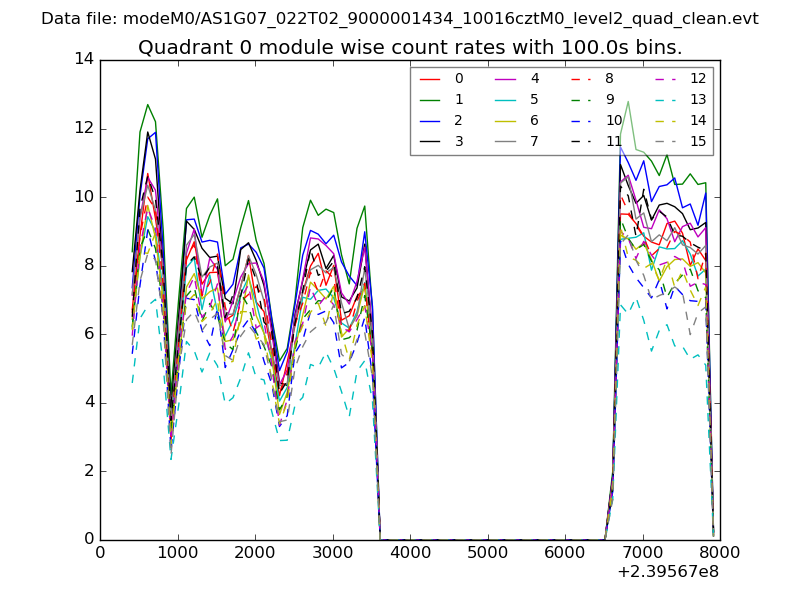 |
 |
| Module-wise count rates for Quadrant B Data is divided into 100 sec bins |
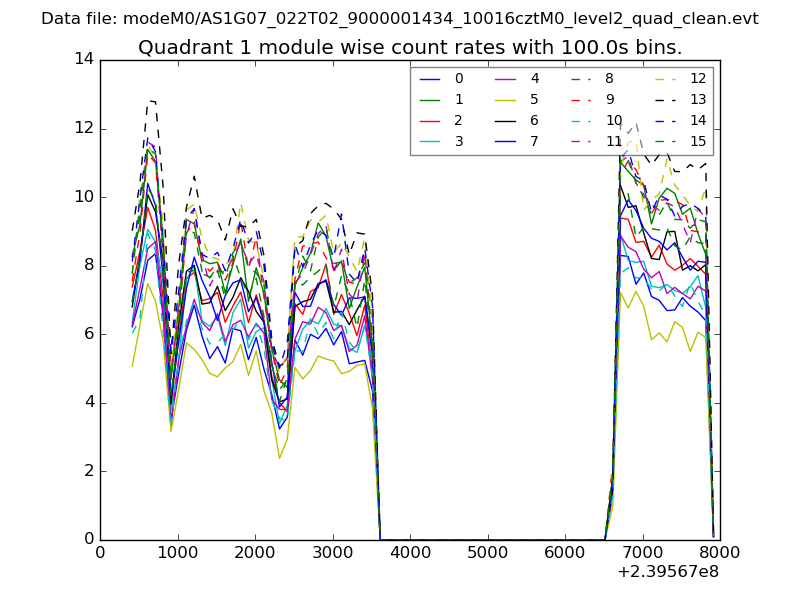 |
 |
| Module-wise count rates for Quadrant C Data is divided into 100 sec bins |
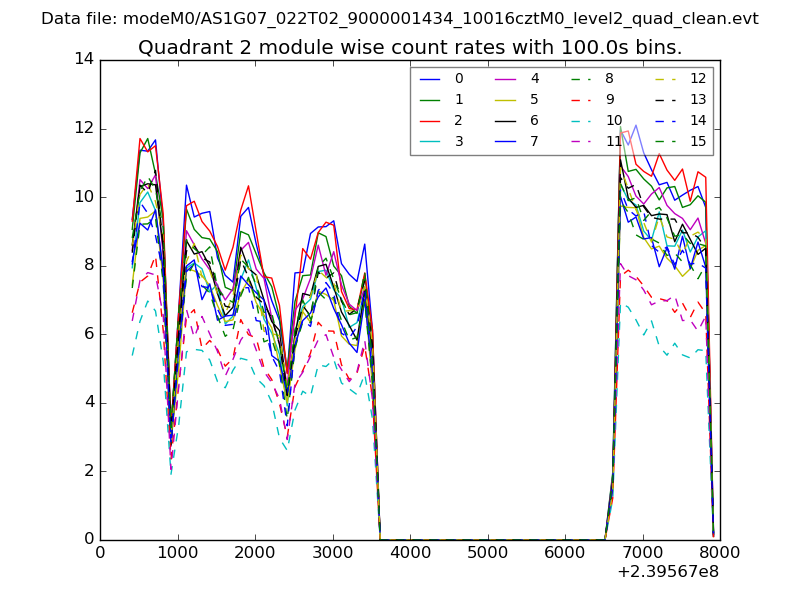 |
 |
| Module-wise count rates for Quadrant D Data is divided into 100 sec bins |
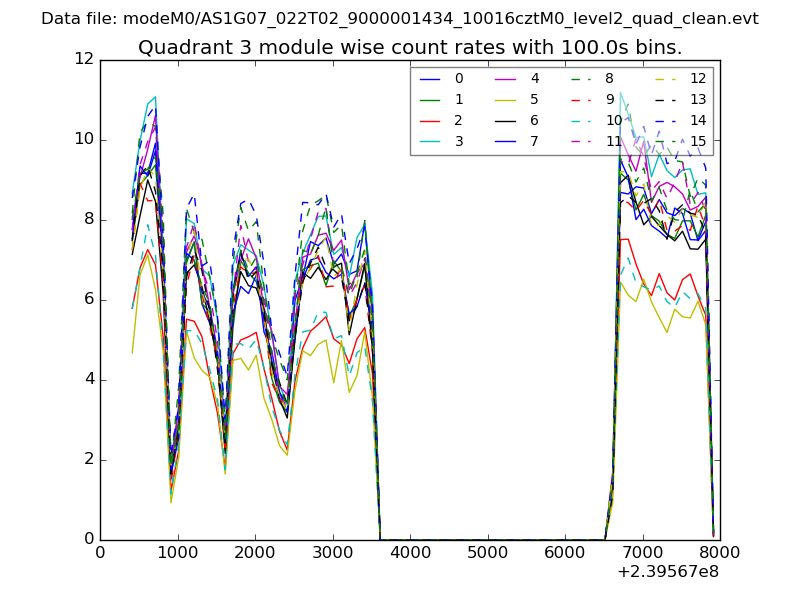 |
 |
| Parameter | Plot |
|---|---|
| CZT HV Monitor | 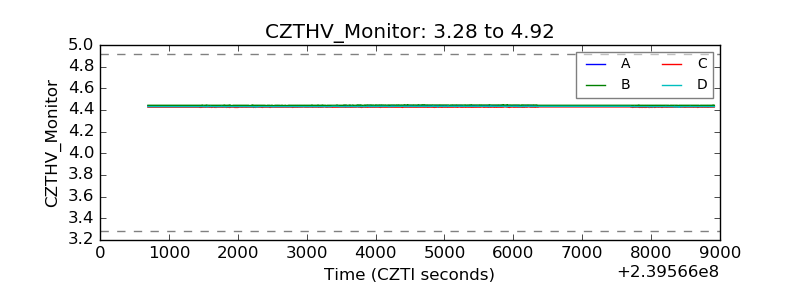 |
| D_VDD | 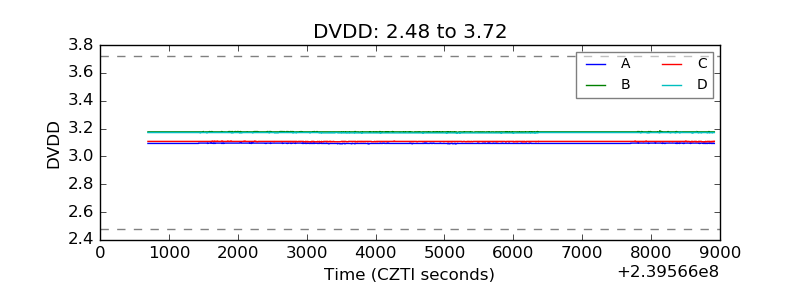 |
| Temperature 1 | 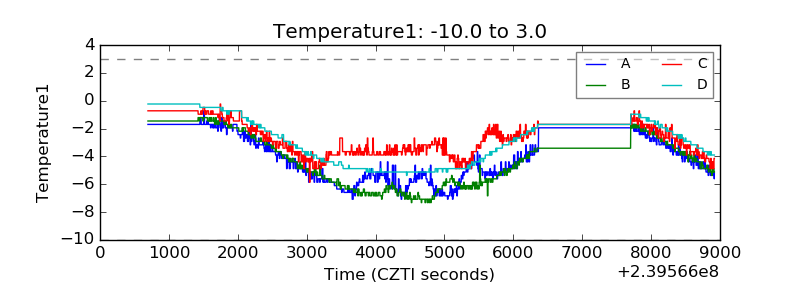 |
| Veto HV Monitor |  |
| Veto LLD |  |
| Alpha Counter | 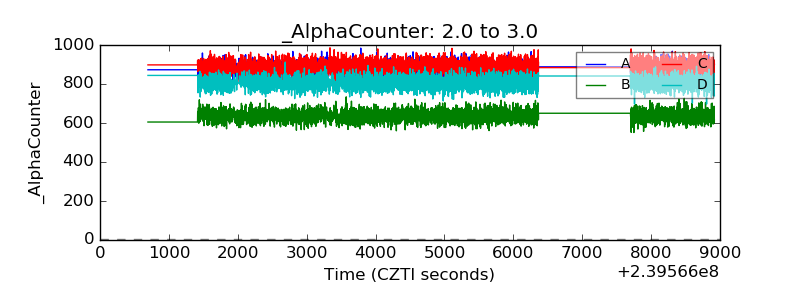 |
| _CPM_Rate | 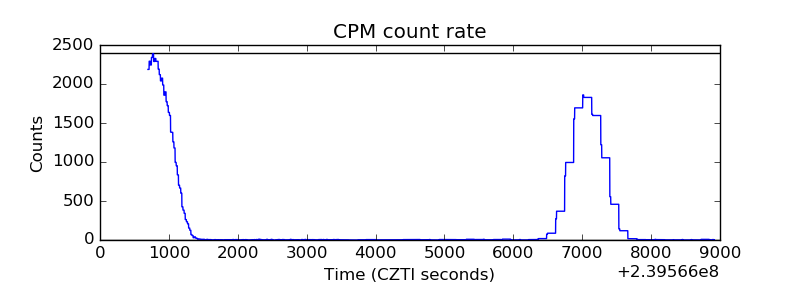 |
| CZT Counter | 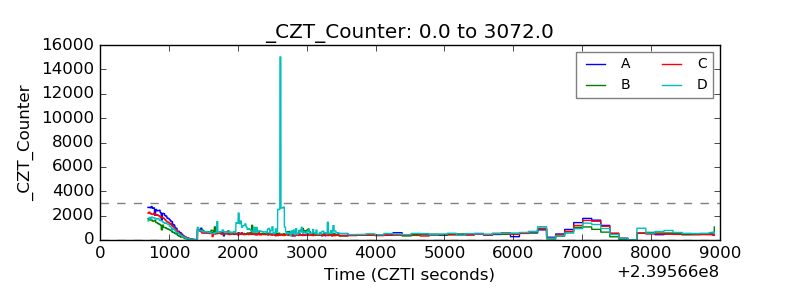 |
| +2.5 Volts monitor |  |
| +5 Volts monitor |  |
| _ROLL_ROT | 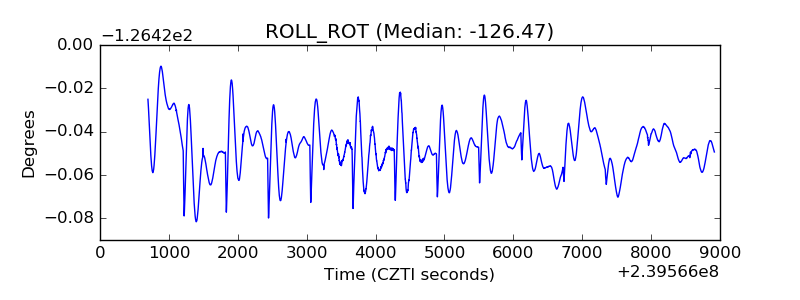 |
| _Roll_DEC | 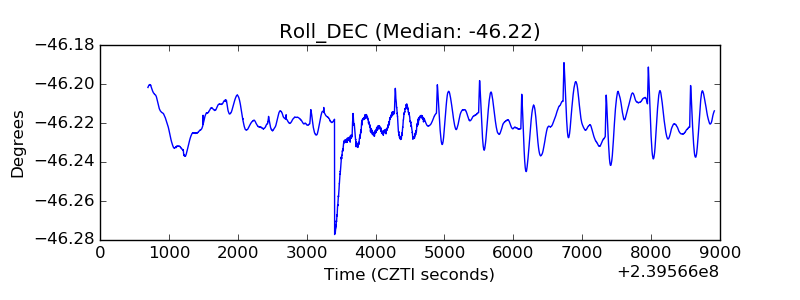 |
| _Roll_RA |  |
| Veto Counter | 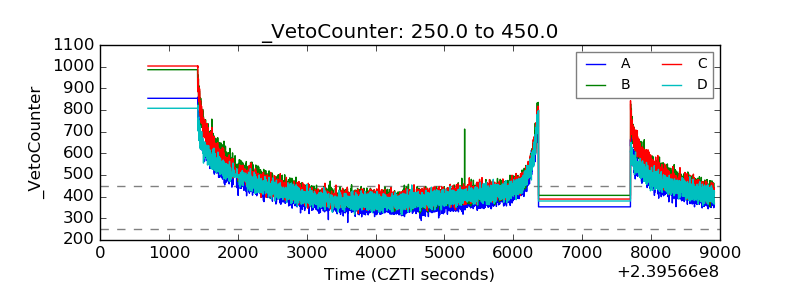 |