| Param | Original file | Final file |
|---|---|---|
| Filename | modeM0/AS1G07_022T02_9000001434_10017cztM0_level2.evt | modeM0/AS1G07_022T02_9000001434_10017cztM0_level2_quad_clean.evt |
| Size (bytes) | 434,016,000 | 89,320,320 |
| Size | 413.9 MB | 85.2 MB |
| Events in quadrant A | 2,903,799 | 566,674 |
| Events in quadrant B | 3,264,068 | 580,690 |
| Events in quadrant C | 2,835,234 | 578,350 |
| Events in quadrant D | 3,714,471 | 541,331 |
| Mode M0 | |||
|---|---|---|---|
| Quadrant | BADHDUFLAG | Total packets | Discarded packets |
| A | 0 | 13027 | 45 |
| B | 0 | 14006 | 60 |
| C | 0 | 12970 | 73 |
| D | 0 | 15113 | 98 |
| Mode M9 | |||
|---|---|---|---|
| Quadrant | BADHDUFLAG | Total packets | Discarded packets |
| A | 0 | 27 | 0 |
| B | 0 | 27 | 0 |
| C | 0 | 27 | 0 |
| D | 0 | 27 | 0 |
| Mode SS | |||
|---|---|---|---|
| Quadrant | BADHDUFLAG | Total packets | Discarded packets |
| A | 0 | 128 | 2 |
| B | 0 | 128 | 0 |
| C | 0 | 128 | 0 |
| D | 0 | 128 | 0 |
| Quadrant | Total seconds | Saturated seconds | Saturation percentage |
|---|---|---|---|
| A | 6290 | 60 | 0.953895% |
| B | 6287 | 102 | 1.622395% |
| C | 6277 | 27 | 0.430142% |
| D | 6277 | 83 | 1.322288% |
Noise dominated data is calculated using 1-second bins in cleaned event files. If a bin has >2000 counts, and if more than 50% of those come from <1% of pixels, then it is considered to be noise-dominated and hence unusable.
| Quadrant | # 1 sec bins | Bins with >0 counts | Bins with >2000 counts | High rate bins dominated by noise | Noise dominated (total time) | Noise dominated (detector-on time) | Marked lightcurve |
|---|---|---|---|---|---|---|---|
| A | 8950 | 6311 | 0 | 0 | 0.00% | 0.00% | 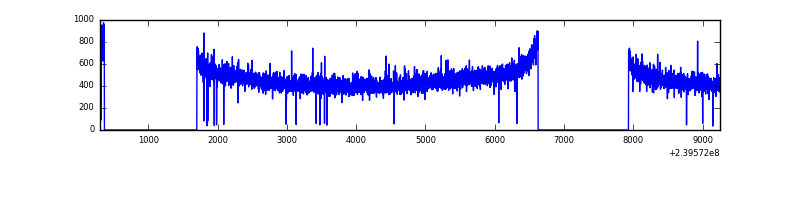 |
| B | 8950 | 6310 | 16 | 16 | 0.18% | 0.25% | 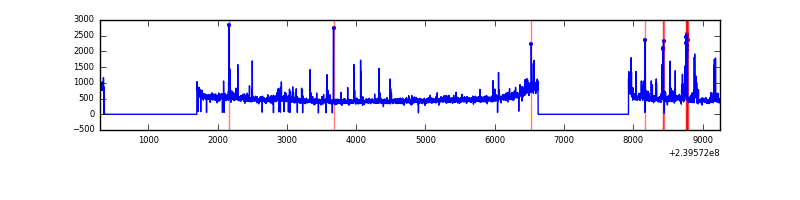 |
| C | 8950 | 6311 | 0 | 0 | 0.00% | 0.00% | 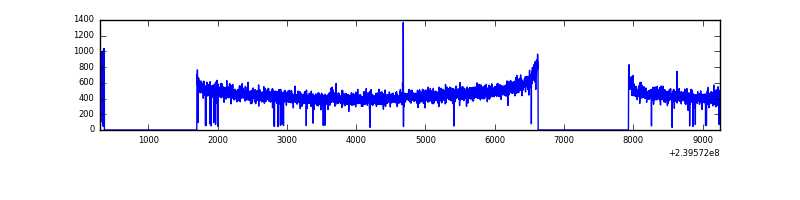 |
| D | 8950 | 6311 | 38 | 38 | 0.42% | 0.60% | 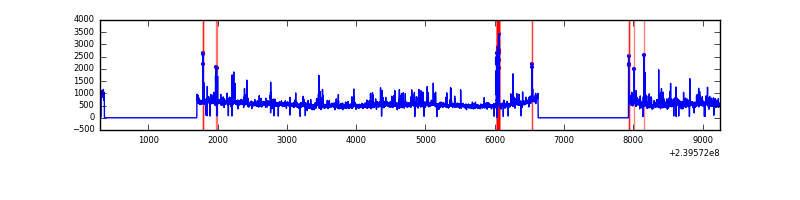 |
Top three noisy pixels from each quadrant. If the there are fewer than three noisy pixels in the level2.evt file, extra rows are filled as -1
| Pixel properties | Quadrant properties | ||||||
|---|---|---|---|---|---|---|---|
| Quadrant | DetID | PixID | Counts | Sigma | Mean | Median | Sigma |
| A | 8 | 15 | 26766 | 172.76 | 742 | 728 | 150.7 |
| A | 13 | 251 | 10565 | 65.27 | 742 | 728 | 150.7 |
| A | 15 | 239 | 9835 | 60.42 | 742 | 728 | 150.7 |
| B | 4 | 81 | 141100 | 989.17 | 753 | 735 | 141.9 |
| B | 4 | 239 | 64380 | 448.51 | 753 | 735 | 141.9 |
| B | 0 | 219 | 55954 | 389.14 | 753 | 735 | 141.9 |
| C | 14 | 67 | 6502 | 34.47 | 725 | 729 | 167.5 |
| C | 13 | 61 | 5596 | 29.06 | 725 | 729 | 167.5 |
| C | 8 | 222 | 3008 | 13.61 | 725 | 729 | 167.5 |
| D | 8 | 195 | 439491 | 2446.6 | 706 | 687 | 179.4 |
| D | 2 | 16 | 303321 | 1687.37 | 706 | 687 | 179.4 |
| D | 10 | 199 | 85903 | 475.13 | 706 | 687 | 179.4 |
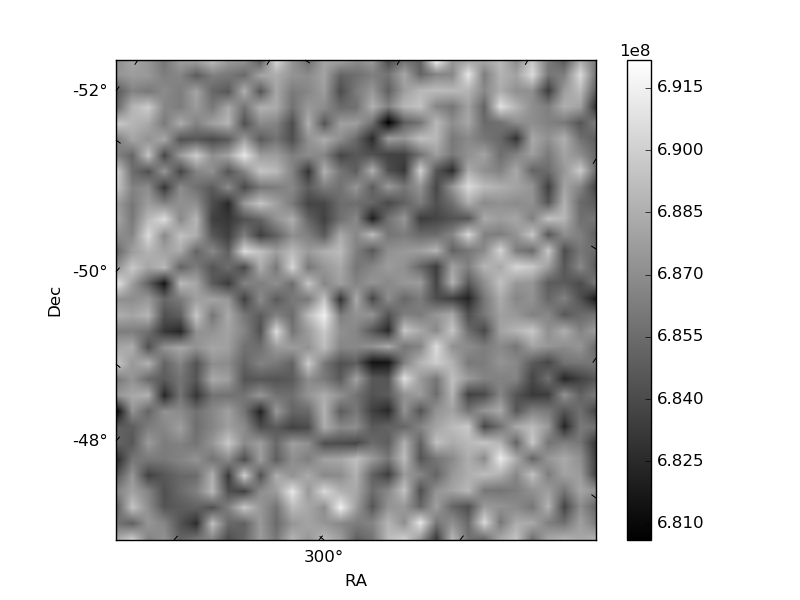
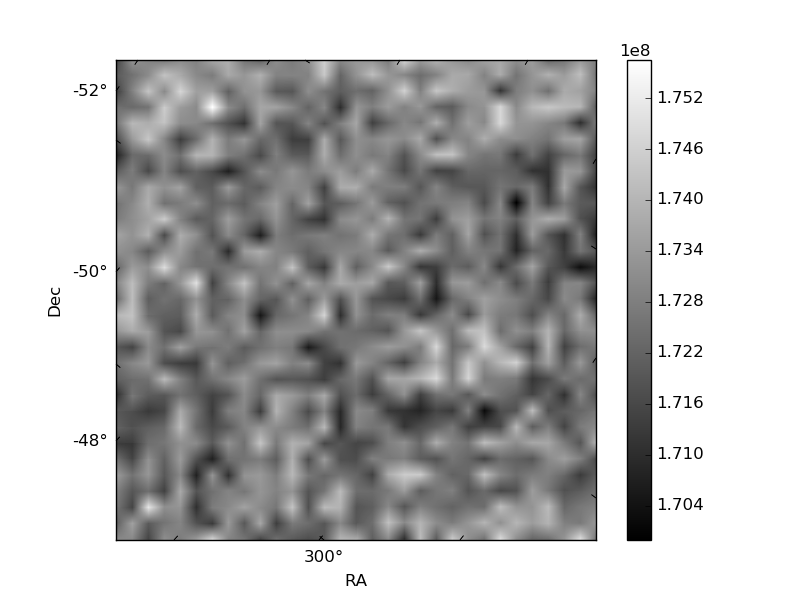
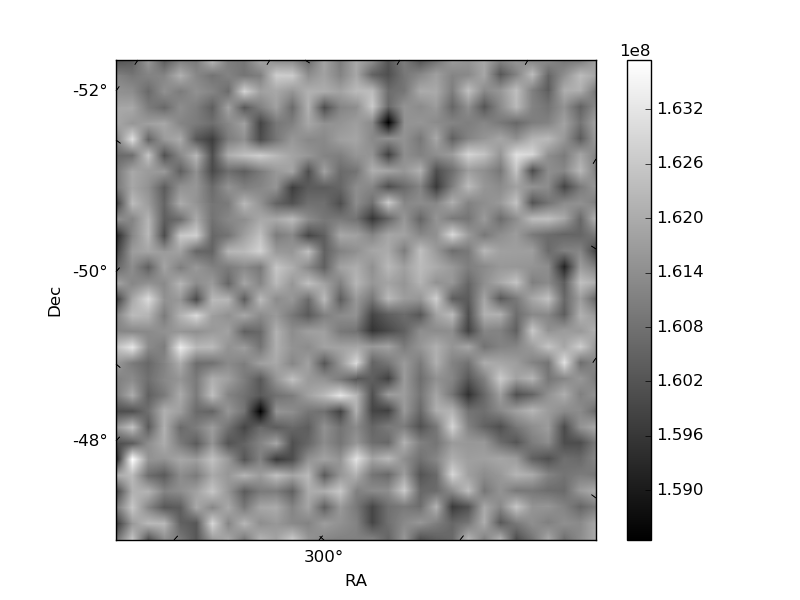
Histogram calculated using DETX and DETY for each event in the final _common_clean file
| Quadrant A | 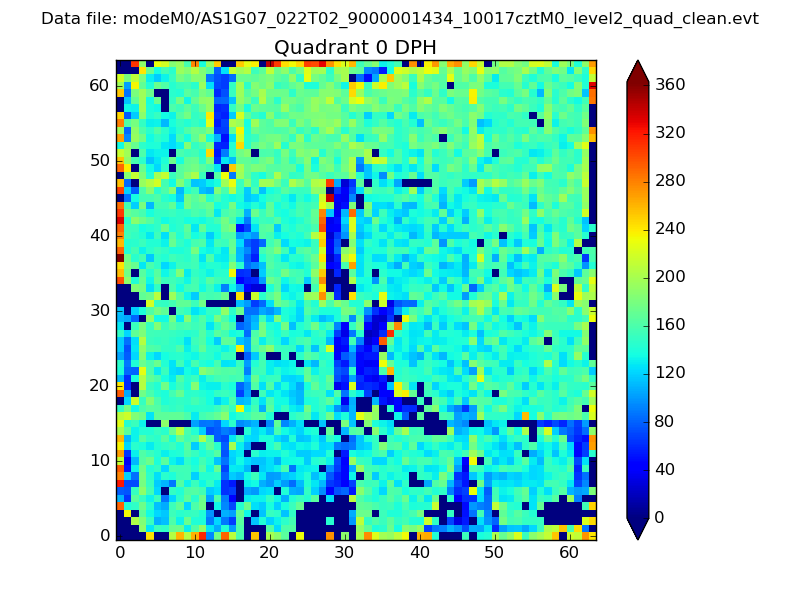 |
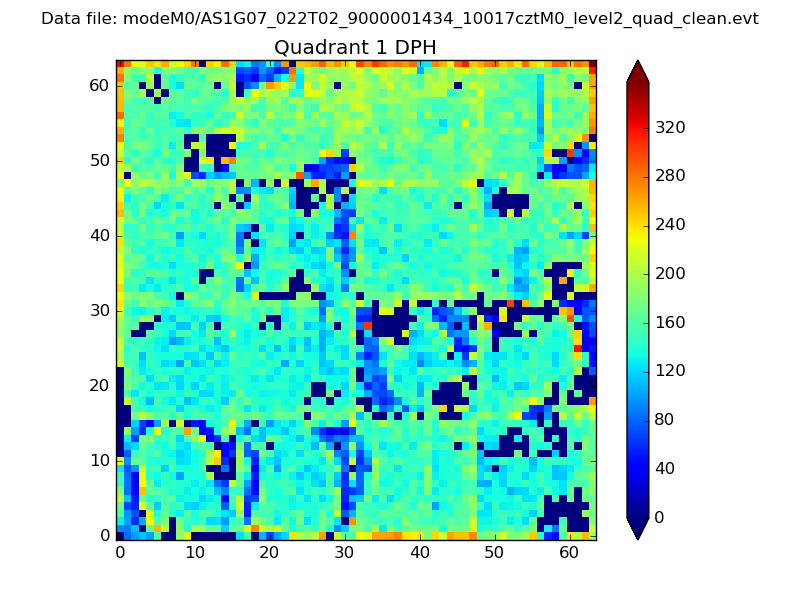 |
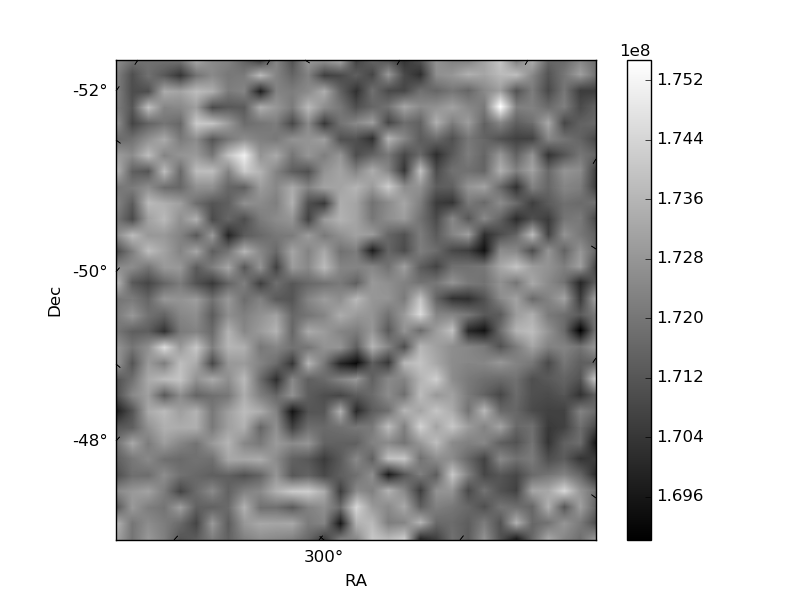
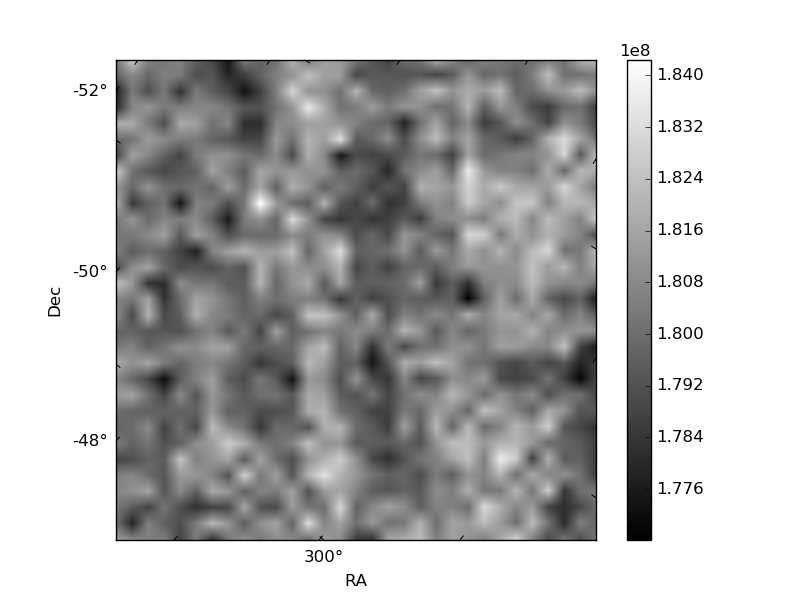
Quadrant B |
|---|---|---|---|
| Quadrant D | 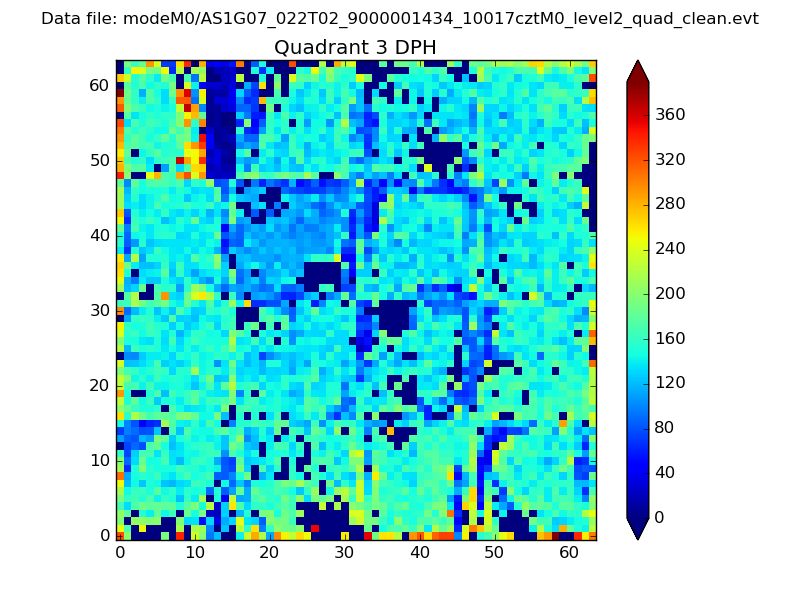 |
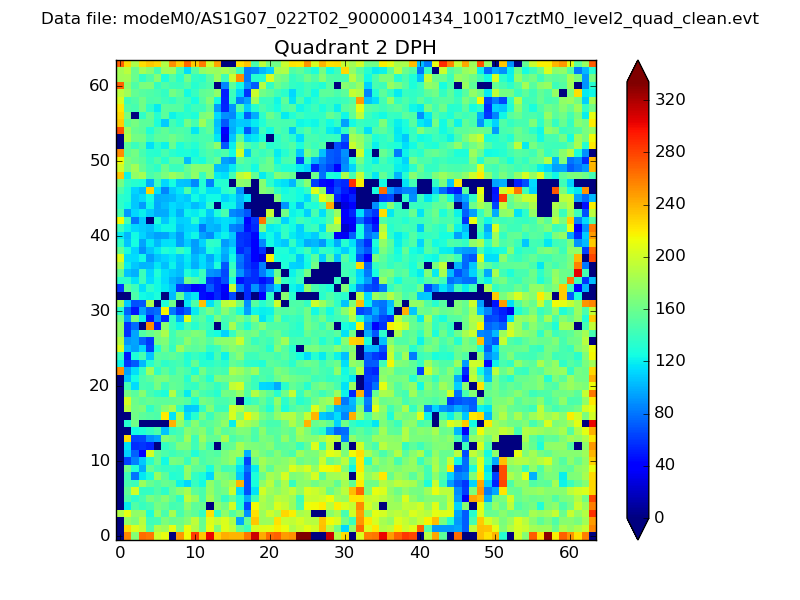 |
Quadrant C |
| Plot type | Count rate plots | Images |
|---|---|---|
| Comparison with Poisson distribution Blue bars denote a histogram of data divided into 1 sec bins. Red curve is a Poisson curve with rate = median count rate of data. |
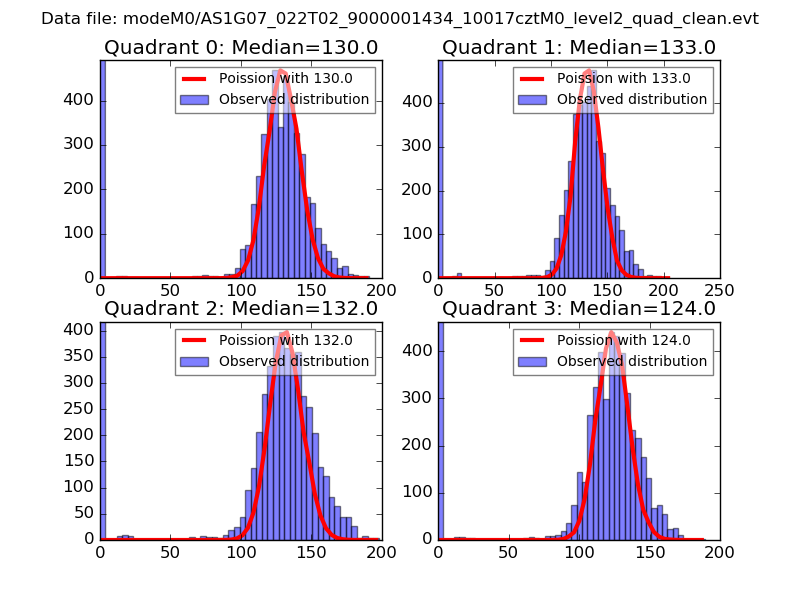 |
 |
| Quadrant-wise count rates Data is divided into 100 sec bins |
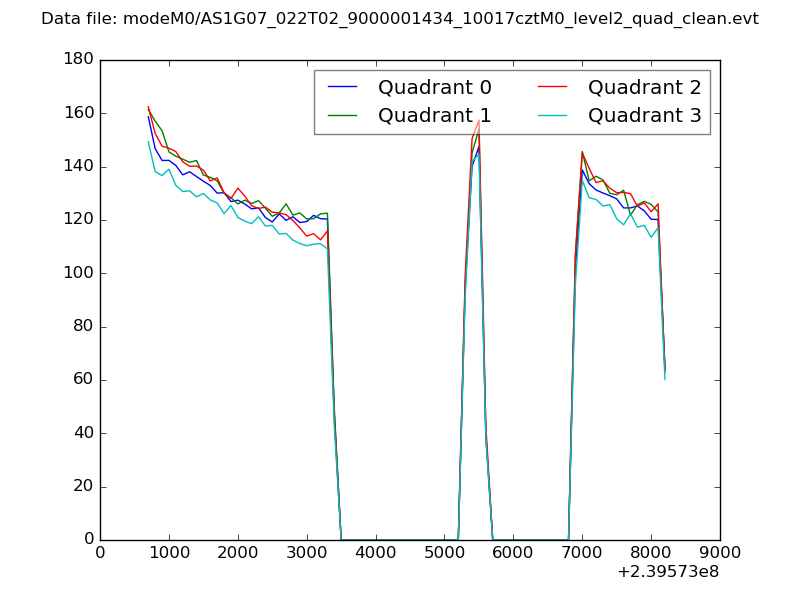 |
|
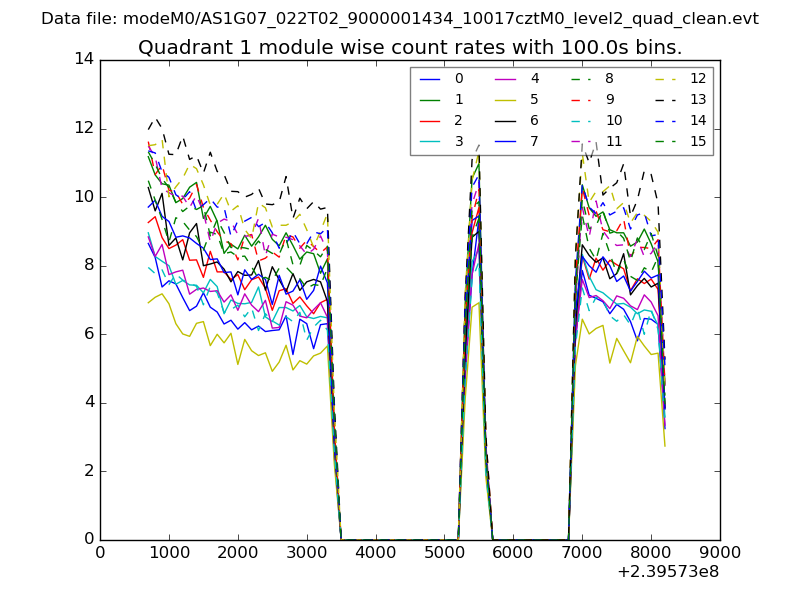
| Module-wise count rates for Quadrant A Data is divided into 100 sec bins |
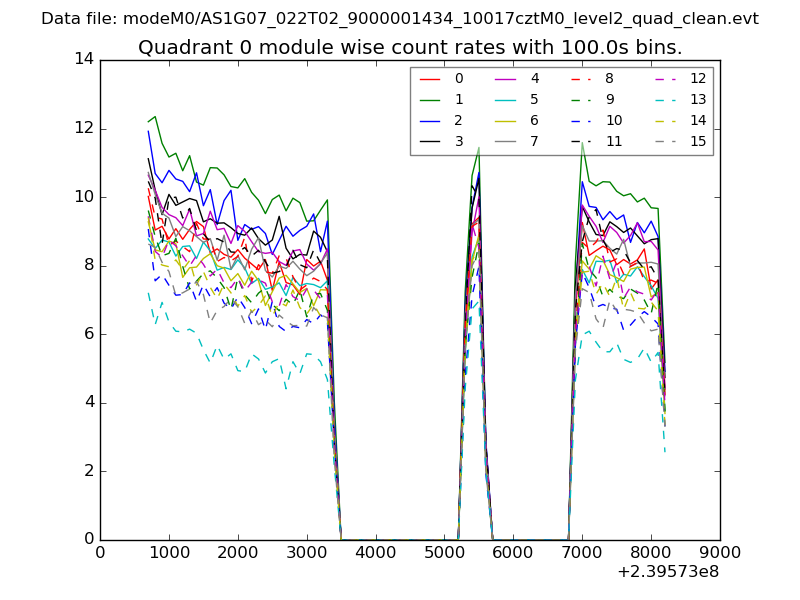 |
 |
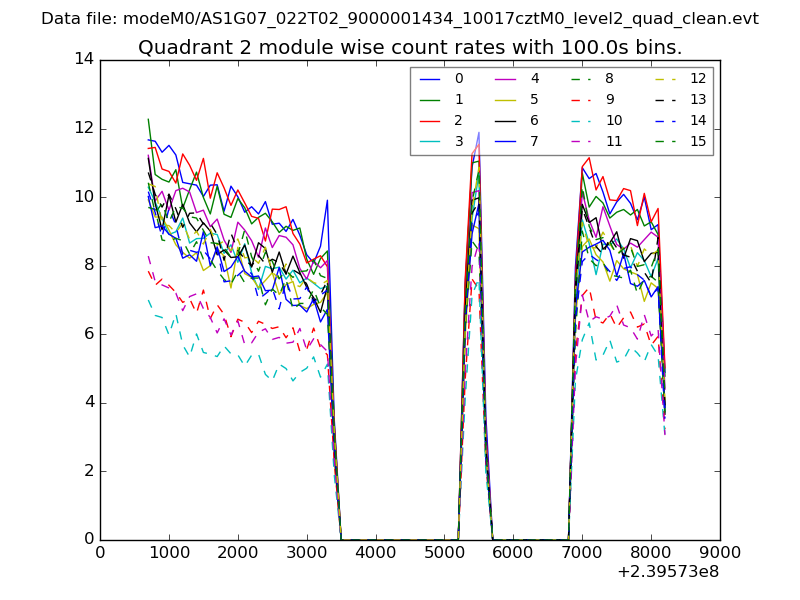
| Module-wise count rates for Quadrant B Data is divided into 100 sec bins |
 |
 |
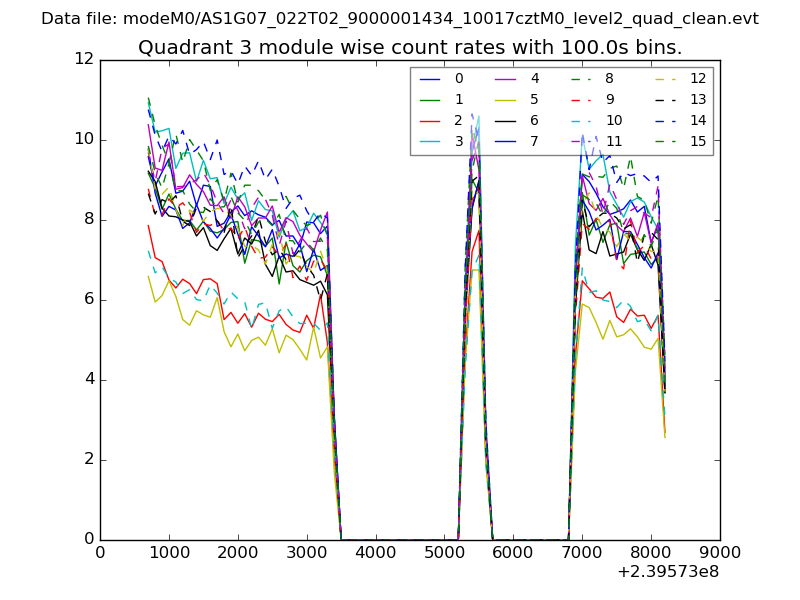
| Module-wise count rates for Quadrant C Data is divided into 100 sec bins |
 |
 |
| Module-wise count rates for Quadrant D Data is divided into 100 sec bins |
 |
 |
| Parameter | Plot |
|---|---|
| CZT HV Monitor | 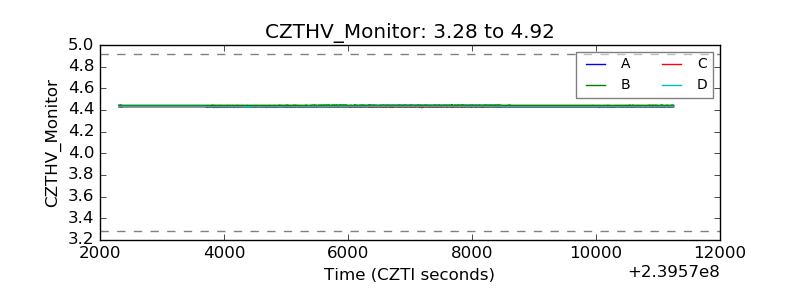 |
| D_VDD | 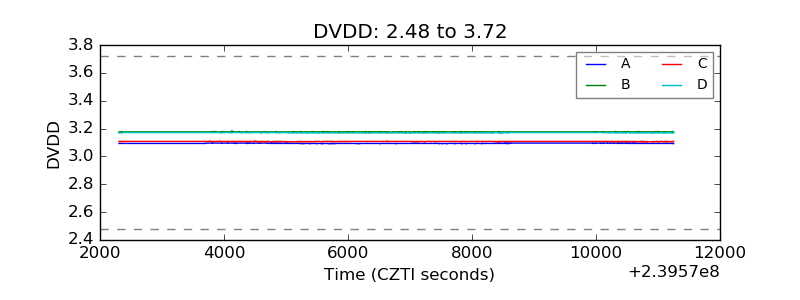 |
| Temperature 1 | 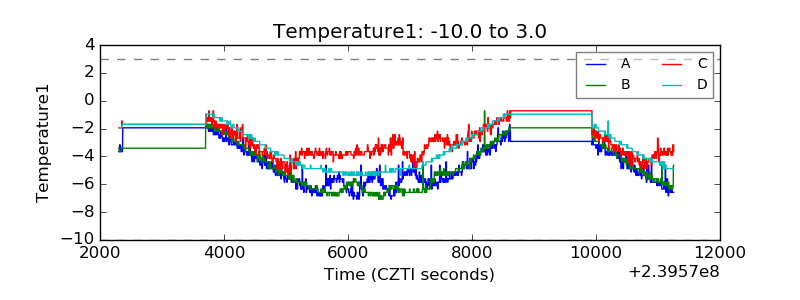 |
| Veto HV Monitor | 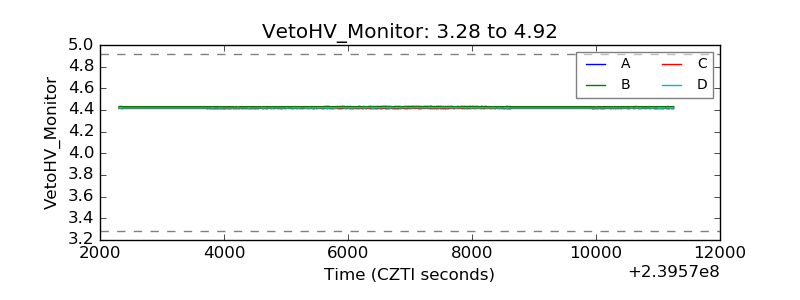 |
| Veto LLD | 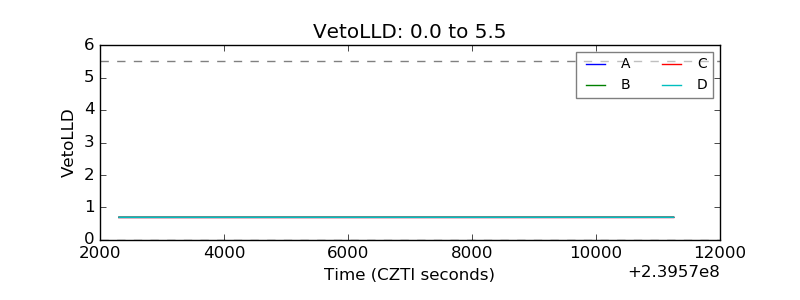 |
| Alpha Counter | 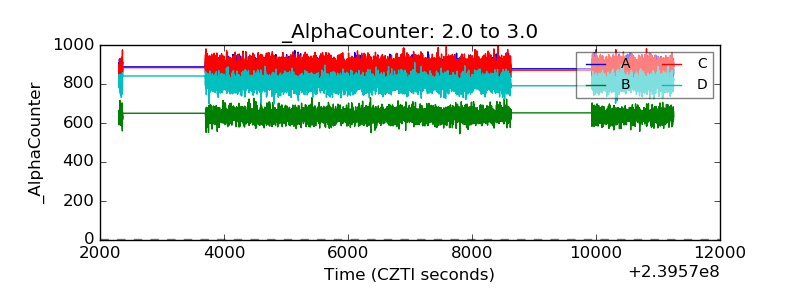 |
| _CPM_Rate | 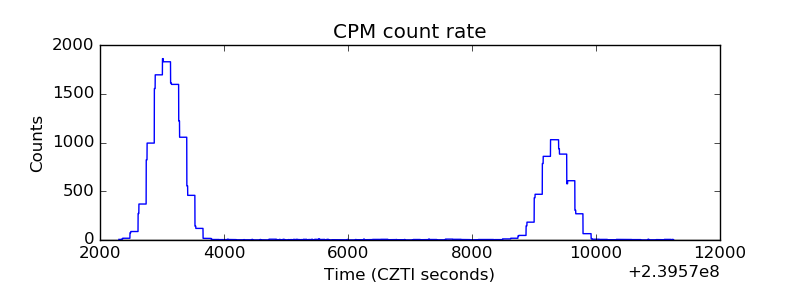 |
| CZT Counter | 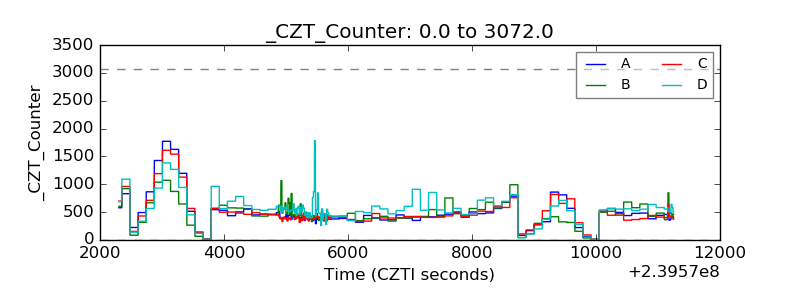 |
| +2.5 Volts monitor | 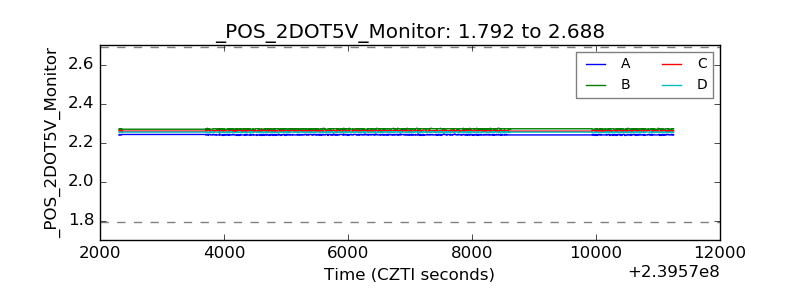 |
| +5 Volts monitor |  |
| _ROLL_ROT | 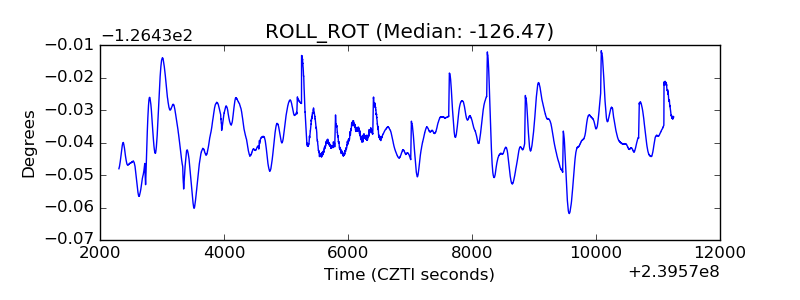 |
| _Roll_DEC | 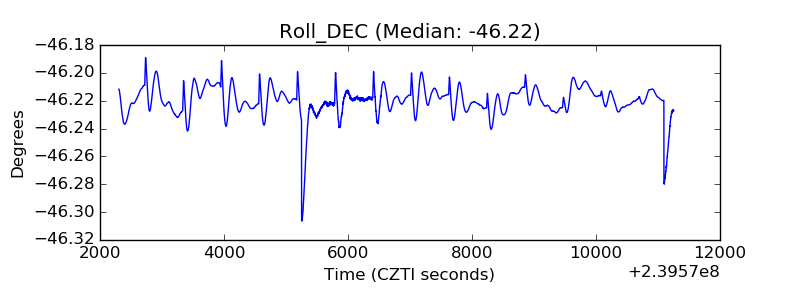 |
| _Roll_RA | 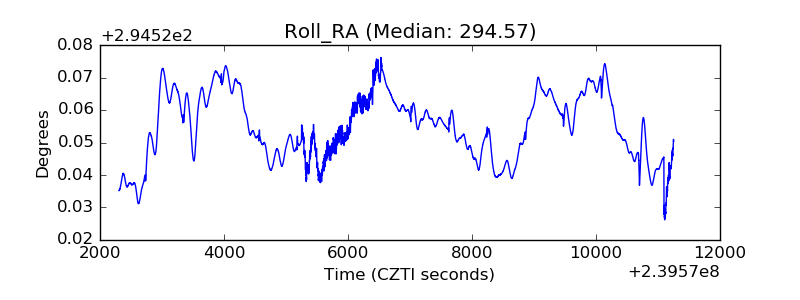 |
| Veto Counter | 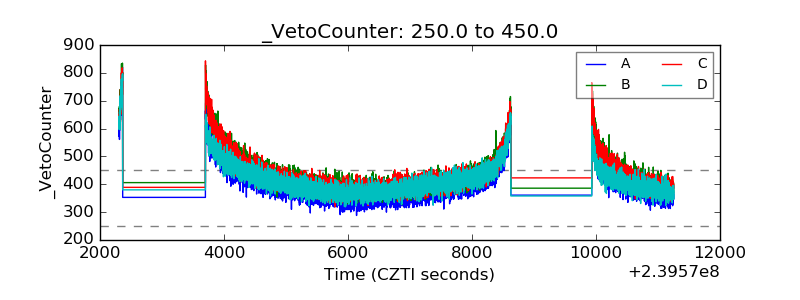 |