| Param | Original file | Final file |
|---|---|---|
| Filename | modeM0/AS1G07_022T02_9000001434_10020cztM0_level2.evt | modeM0/AS1G07_022T02_9000001434_10020cztM0_level2_quad_clean.evt |
| Size (bytes) | 380,041,920 | 83,828,160 |
| Size | 362.4 MB | 79.9 MB |
| Events in quadrant A | 2,725,787 | 533,378 |
| Events in quadrant B | 2,891,407 | 537,001 |
| Events in quadrant C | 2,550,952 | 546,063 |
| Events in quadrant D | 2,947,609 | 519,095 |
| Mode M0 | |||
|---|---|---|---|
| Quadrant | BADHDUFLAG | Total packets | Discarded packets |
| A | 0 | 15618 | 3640 |
| B | 0 | 16266 | 3735 |
| C | 0 | 15236 | 3384 |
| D | 0 | 16741 | 3913 |
| Mode M9 | |||
|---|---|---|---|
| Quadrant | BADHDUFLAG | Total packets | Discarded packets |
| A | 0 | 10 | 3 |
| B | 0 | 10 | 1 |
| C | 0 | 10 | 1 |
| D | 0 | 10 | 1 |
| Mode SS | |||
|---|---|---|---|
| Quadrant | BADHDUFLAG | Total packets | Discarded packets |
| A | 0 | 150 | 31 |
| B | 0 | 152 | 30 |
| C | 0 | 152 | 36 |
| D | 0 | 152 | 28 |
| Quadrant | Total seconds | Saturated seconds | Saturation percentage |
|---|---|---|---|
| A | 5746 | 47 | 0.817960% |
| B | 5735 | 127 | 2.214473% |
| C | 5754 | 49 | 0.851582% |
| D | 5737 | 82 | 1.429318% |
Noise dominated data is calculated using 1-second bins in cleaned event files. If a bin has >2000 counts, and if more than 50% of those come from <1% of pixels, then it is considered to be noise-dominated and hence unusable.
| Quadrant | # 1 sec bins | Bins with >0 counts | Bins with >2000 counts | High rate bins dominated by noise | Noise dominated (total time) | Noise dominated (detector-on time) | Marked lightcurve |
|---|---|---|---|---|---|---|---|
| A | 8352 | 6697 | 5 | 5 | 0.06% | 0.07% | 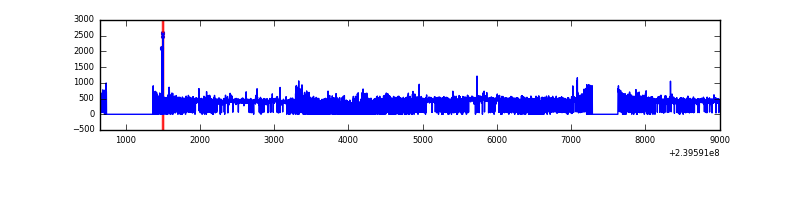 |
| B | 8352 | 6736 | 36 | 36 | 0.43% | 0.53% | 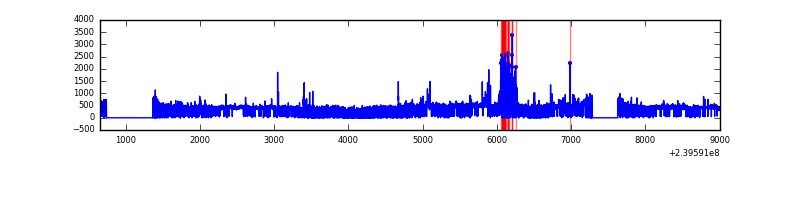 |
| C | 8352 | 6758 | 4 | 4 | 0.05% | 0.06% | 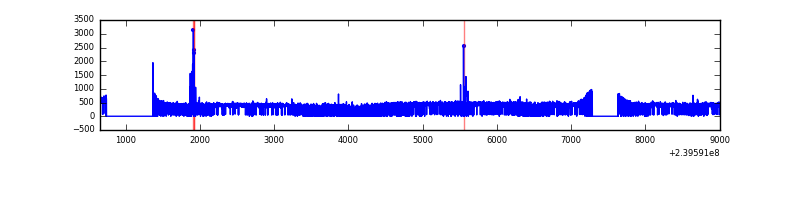 |
| D | 8350 | 6685 | 17 | 17 | 0.20% | 0.25% | 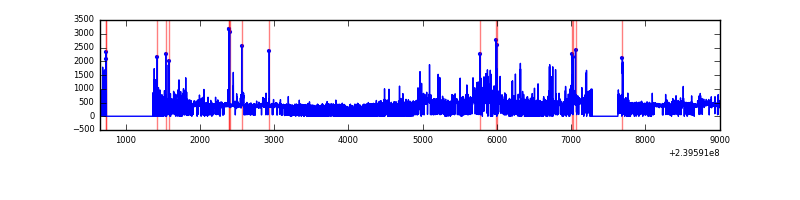 |
Top three noisy pixels from each quadrant. If the there are fewer than three noisy pixels in the level2.evt file, extra rows are filled as -1
| Pixel properties | Quadrant properties | ||||||
|---|---|---|---|---|---|---|---|
| Quadrant | DetID | PixID | Counts | Sigma | Mean | Median | Sigma |
| A | 8 | 15 | 92026 | 685.79 | 649 | 635 | 133.3 |
| A | 15 | 239 | 85466 | 636.56 | 649 | 635 | 133.3 |
| A | 13 | 251 | 32060 | 235.81 | 649 | 635 | 133.3 |
| B | 4 | 81 | 234537 | 1847.58 | 656 | 641 | 126.6 |
| B | 4 | 239 | 34835 | 270.1 | 656 | 641 | 126.6 |
| B | 5 | 255 | 18445 | 140.64 | 656 | 641 | 126.6 |
| C | 14 | 234 | 39358 | 259.55 | 641 | 646 | 149.1 |
| C | 14 | 67 | 5654 | 33.58 | 641 | 646 | 149.1 |
| C | 13 | 61 | 4792 | 27.8 | 641 | 646 | 149.1 |
| D | 1 | 52 | 164327 | 1045.43 | 627 | 611 | 156.6 |
| D | 10 | 157 | 100455 | 637.57 | 627 | 611 | 156.6 |
| D | 8 | 195 | 92658 | 587.78 | 627 | 611 | 156.6 |
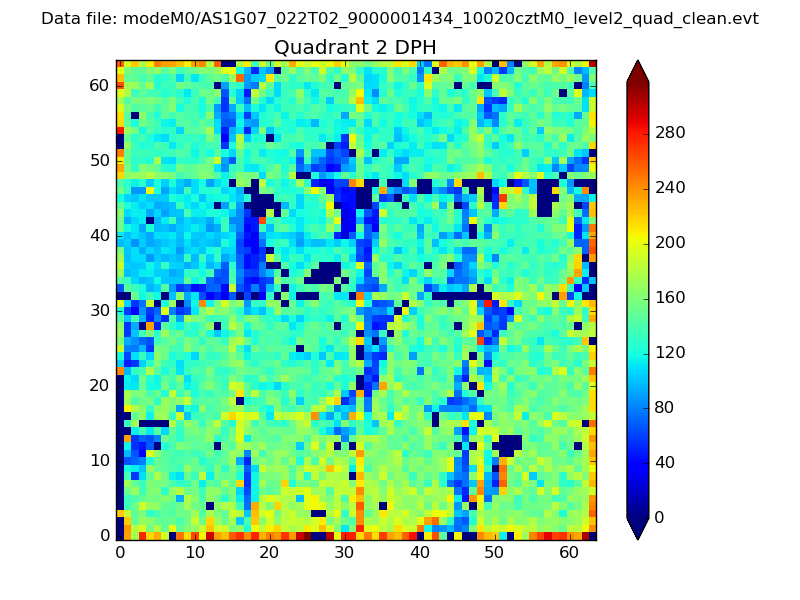
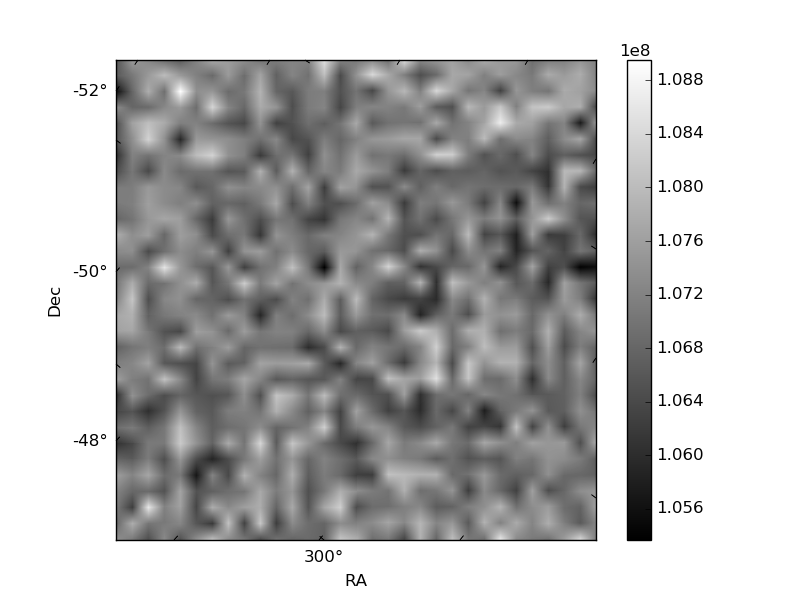
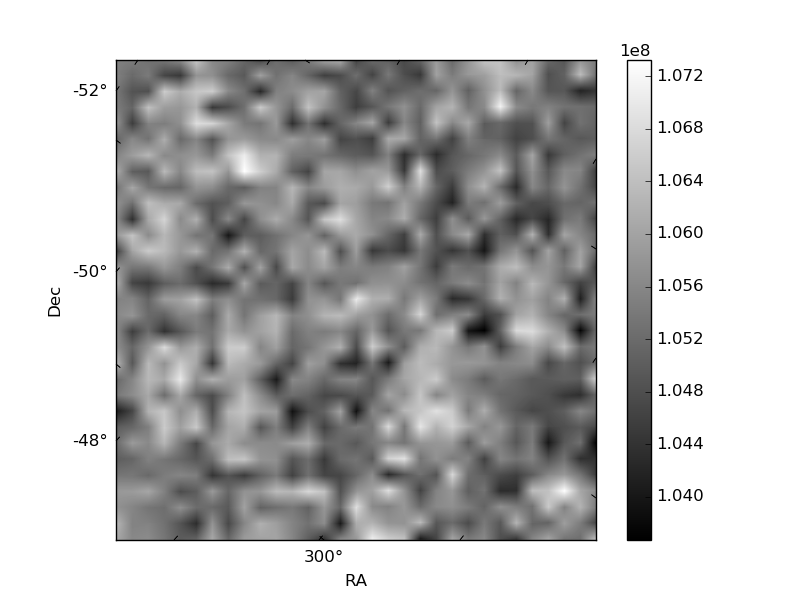
Histogram calculated using DETX and DETY for each event in the final _common_clean file
| Quadrant A | 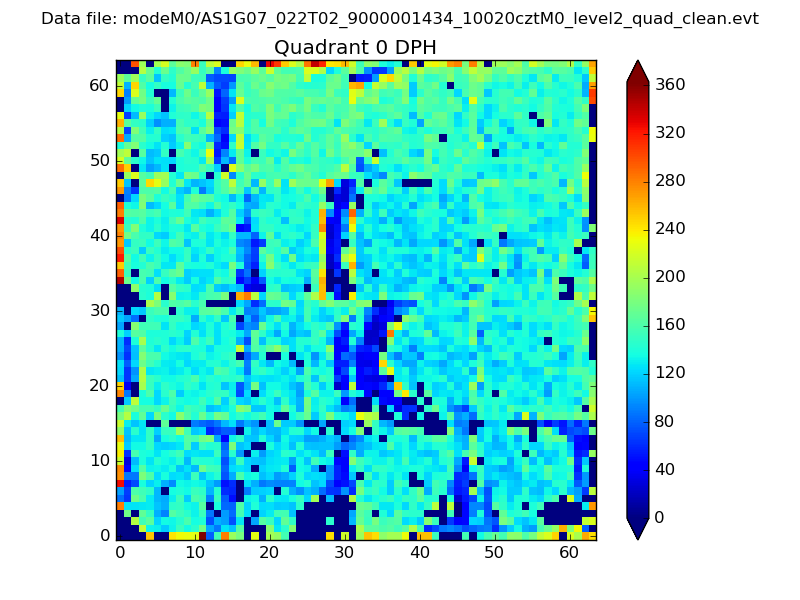 |
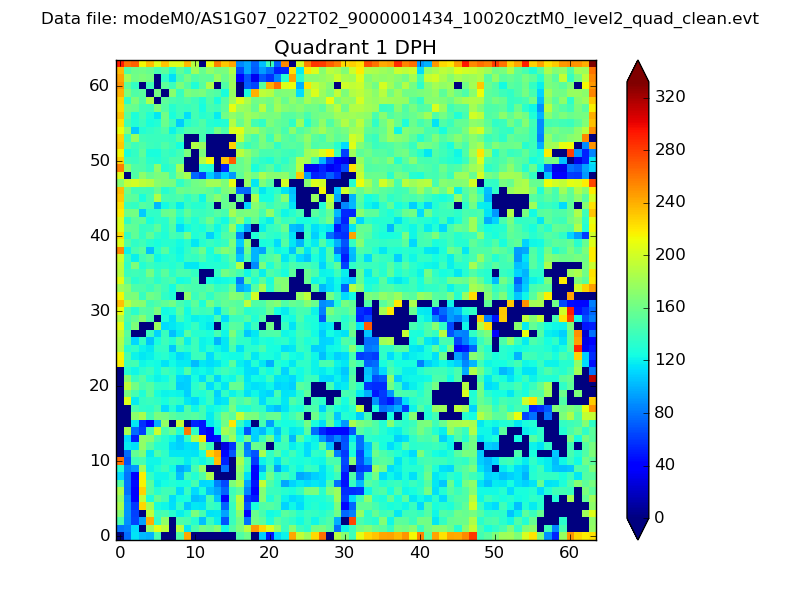 |
Quadrant B |
|---|---|---|---|
| Quadrant D | 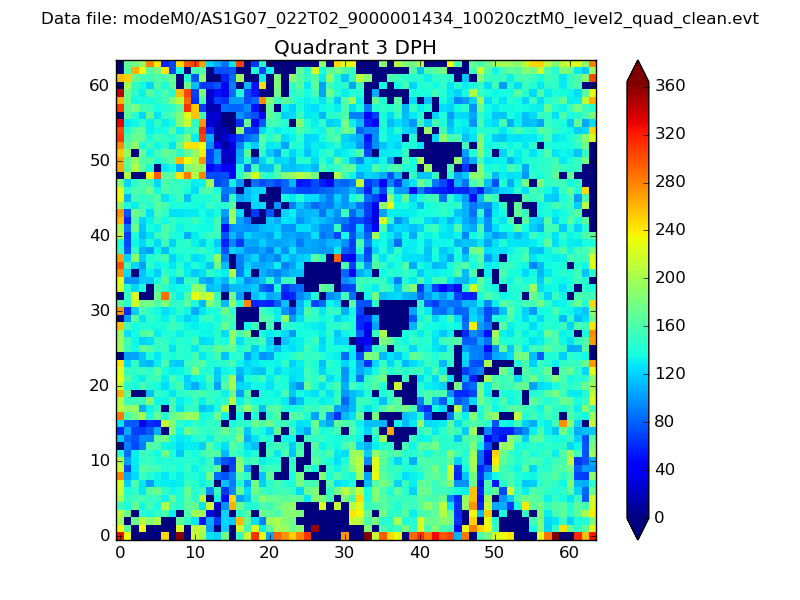 |
 |
Quadrant C |
| Plot type | Count rate plots | Images |
|---|---|---|
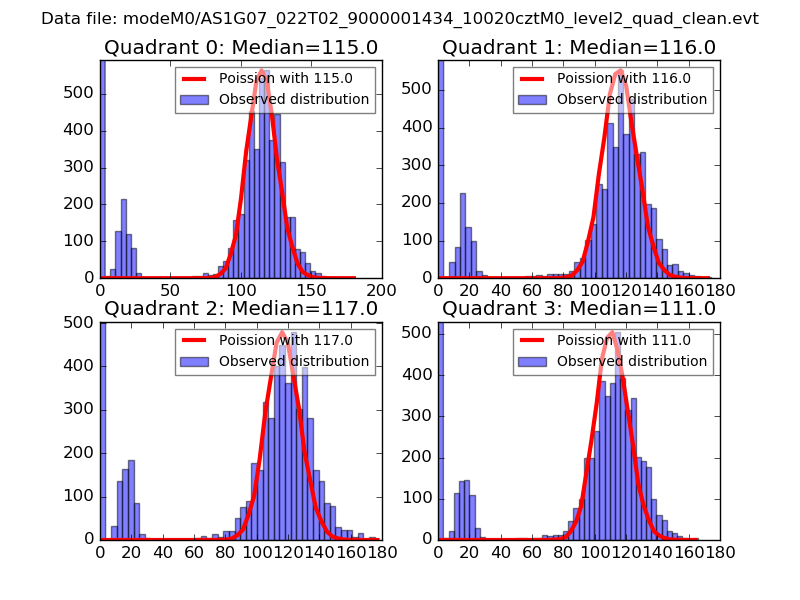
| Comparison with Poisson distribution Blue bars denote a histogram of data divided into 1 sec bins. Red curve is a Poisson curve with rate = median count rate of data. |
 |
 |
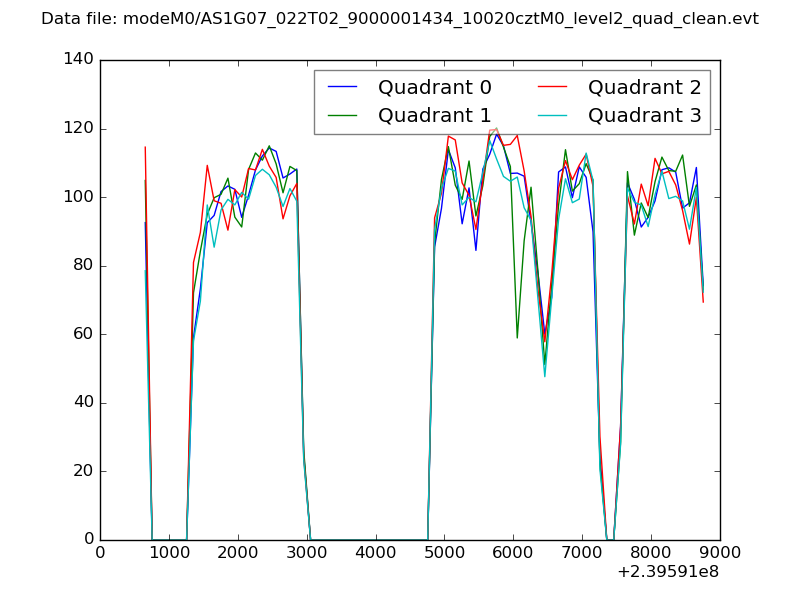
| Quadrant-wise count rates Data is divided into 100 sec bins |
 |
|
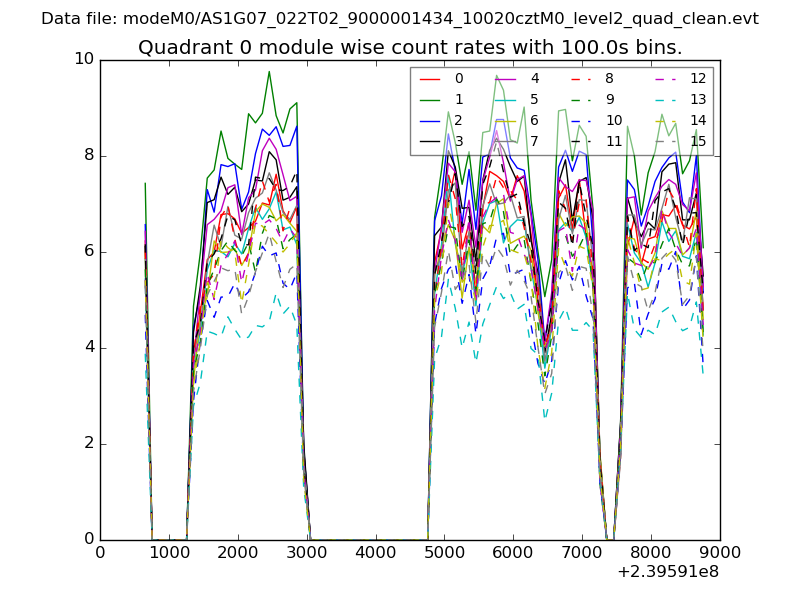
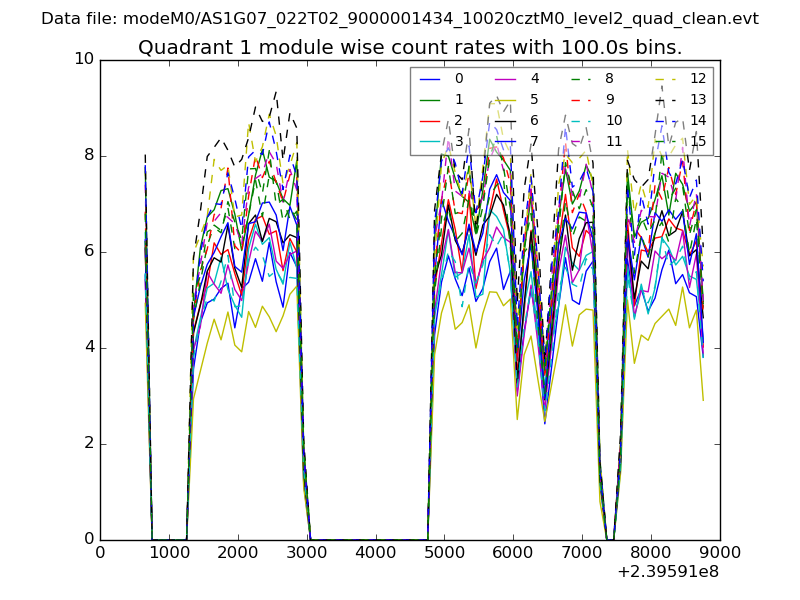
| Module-wise count rates for Quadrant A Data is divided into 100 sec bins |
 |
 |
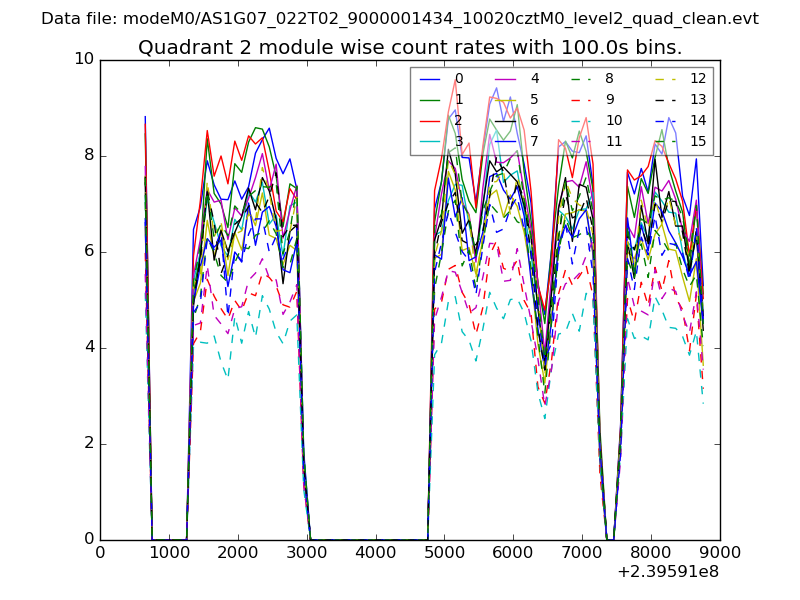
| Module-wise count rates for Quadrant B Data is divided into 100 sec bins |
 |
 |
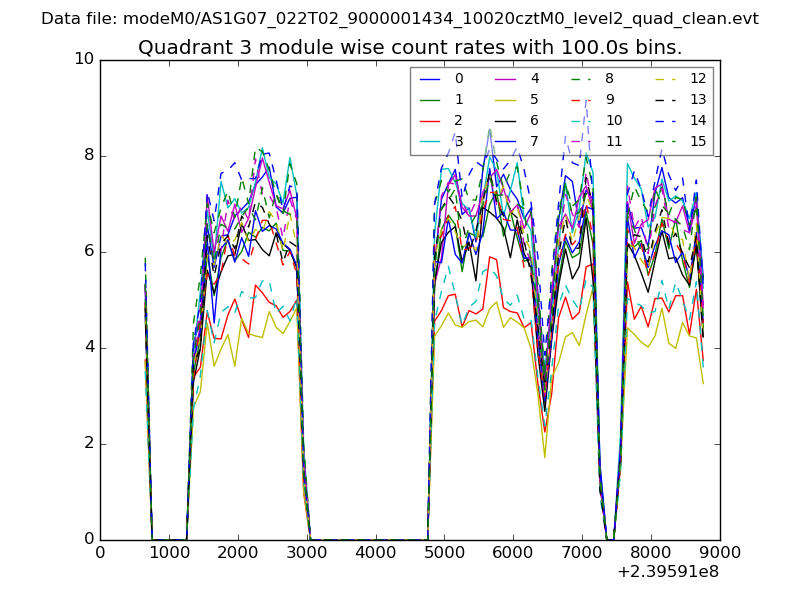
| Module-wise count rates for Quadrant C Data is divided into 100 sec bins |
 |
 |
| Module-wise count rates for Quadrant D Data is divided into 100 sec bins |
 |
 |
| Parameter | Plot |
|---|---|
| CZT HV Monitor | 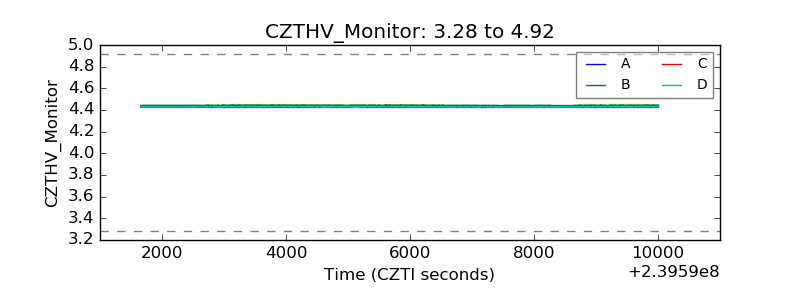 |
| D_VDD | 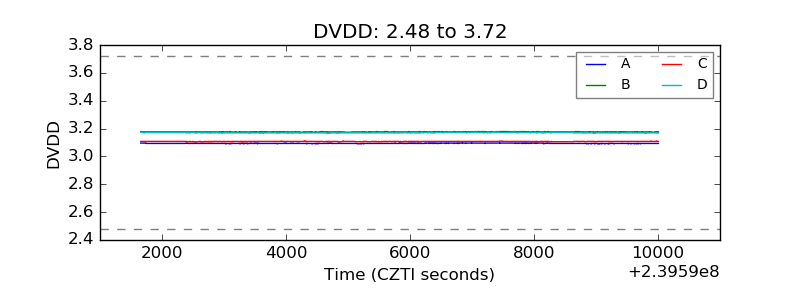 |
| Temperature 1 | 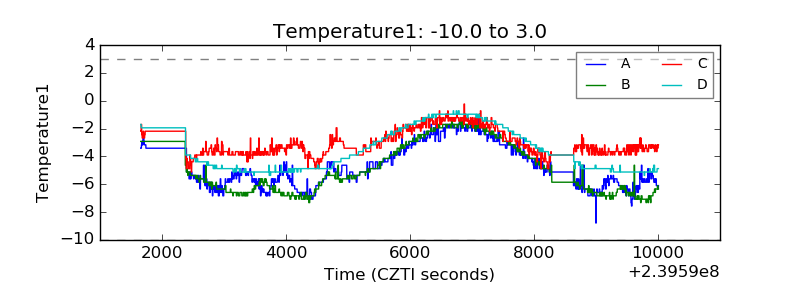 |
| Veto HV Monitor | 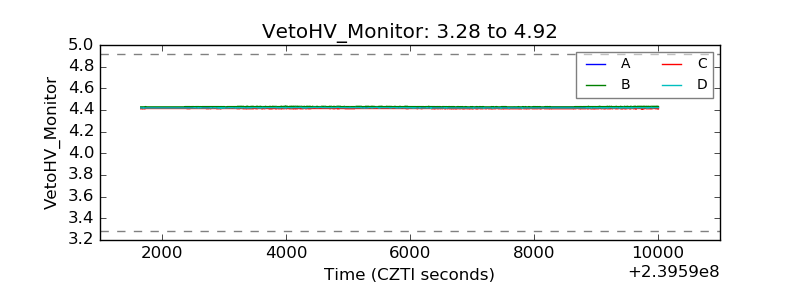 |
| Veto LLD | 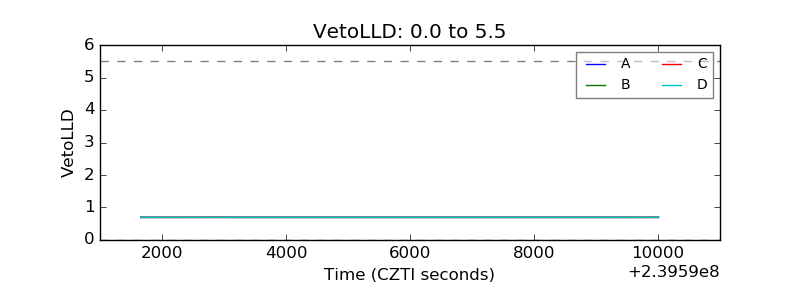 |
| Alpha Counter | 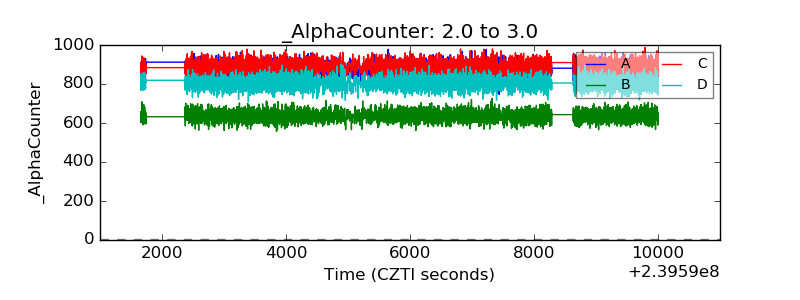 |
| _CPM_Rate | 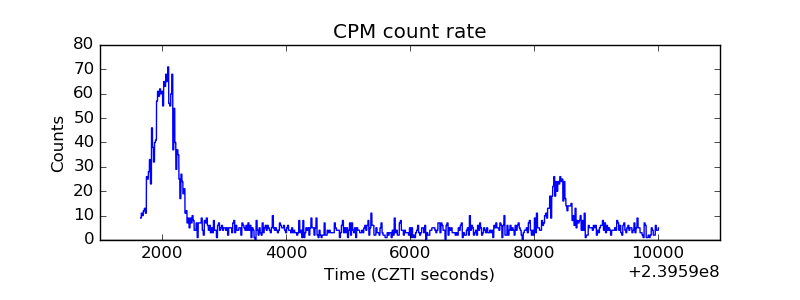 |
| CZT Counter | 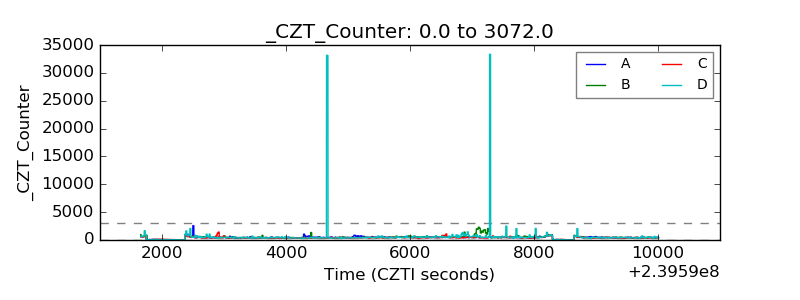 |
| +2.5 Volts monitor |  |
| +5 Volts monitor |  |
| _ROLL_ROT | 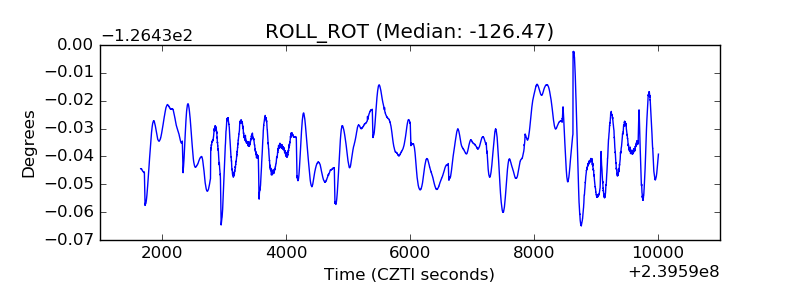 |
| _Roll_DEC | 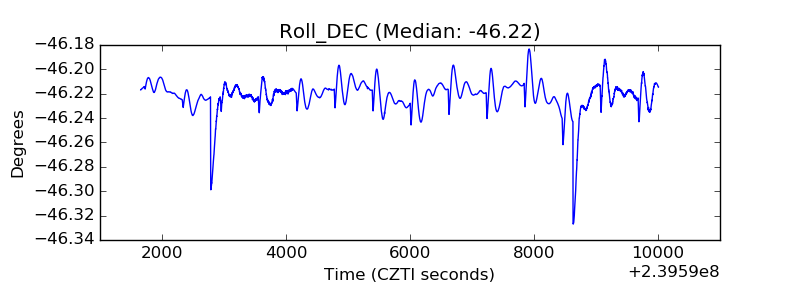 |
| _Roll_RA | 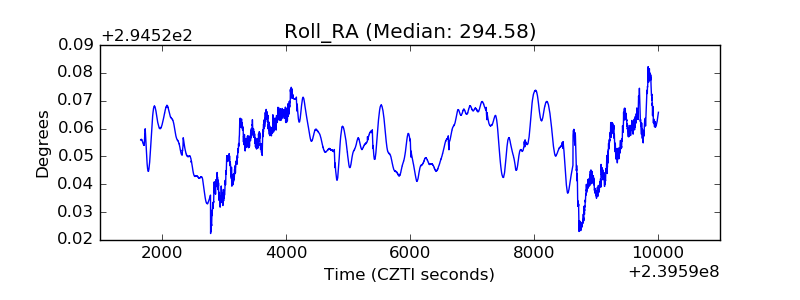 |
| Veto Counter | 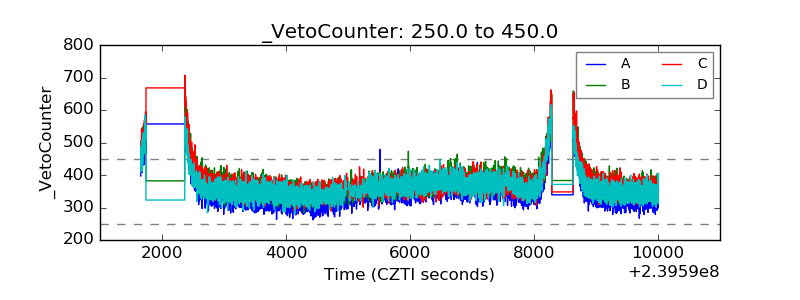 |