| Param | Original file | Final file |
|---|---|---|
| Filename | modeM0/AS1G07_022T02_9000001434_10021cztM0_level2.evt | modeM0/AS1G07_022T02_9000001434_10021cztM0_level2_quad_clean.evt |
| Size (bytes) | 167,374,080 | 28,416,960 |
| Size | 159.6 MB | 27.1 MB |
| Events in quadrant A | 1,544,096 | 208,214 |
| Events in quadrant B | 1,522,411 | 205,339 |
| Events in quadrant C | 1,417,106 | 218,083 |
| Events in quadrant D | 392,347 | 28,748 |
| Mode M0 | |||
|---|---|---|---|
| Quadrant | BADHDUFLAG | Total packets | Discarded packets |
| A | 0 | 25481 | 18714 |
| B | 0 | 26176 | 19385 |
| C | 0 | 25032 | 18306 |
| D | 0 | 28097 | 26052 |
| Mode M9 | |||
|---|---|---|---|
| Quadrant | BADHDUFLAG | Total packets | Discarded packets |
| A | 0 | 6 | 3 |
| B | 0 | 6 | 5 |
| C | 0 | 7 | 4 |
| D | 0 | 6 | 5 |
| Mode SS | |||
|---|---|---|---|
| Quadrant | BADHDUFLAG | Total packets | Discarded packets |
| A | 0 | 250 | 174 |
| B | 0 | 250 | 182 |
| C | 0 | 250 | 192 |
| D | 0 | 249 | 167 |
| Quadrant | Total seconds | Saturated seconds | Saturation percentage |
|---|---|---|---|
| A | 3294 | 8 | 0.242866% |
| B | 3259 | 16 | 0.490948% |
| C | 3350 | 5 | 0.149254% |
| D | 1014 | 0 | 0.000000% |
Noise dominated data is calculated using 1-second bins in cleaned event files. If a bin has >2000 counts, and if more than 50% of those come from <1% of pixels, then it is considered to be noise-dominated and hence unusable.
| Quadrant | # 1 sec bins | Bins with >0 counts | Bins with >2000 counts | High rate bins dominated by noise | Noise dominated (total time) | Noise dominated (detector-on time) | Marked lightcurve |
|---|---|---|---|---|---|---|---|
| A | 12823 | 4507 | 0 | 0 | 0.00% | 0.00% | 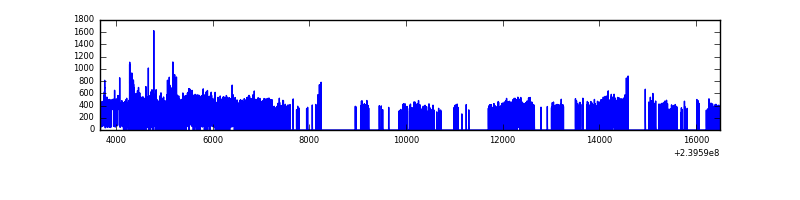 |
| B | 12806 | 4457 | 2 | 2 | 0.02% | 0.04% | 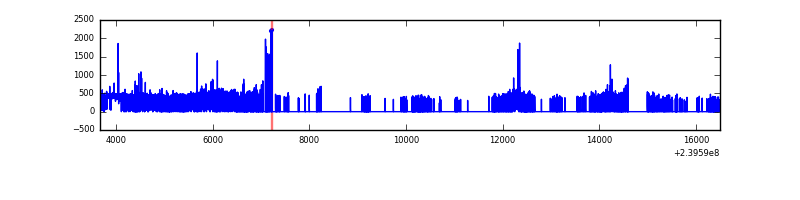 |
| C | 12817 | 4536 | 0 | 0 | 0.00% | 0.00% | 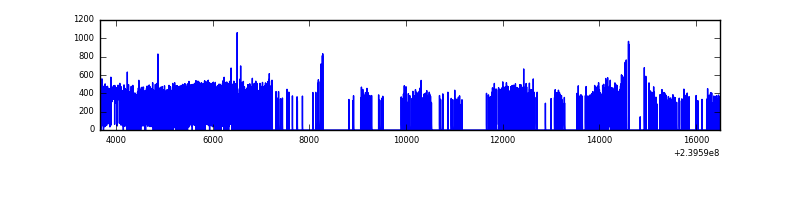 |
| D | 1227 | 1165 | 1 | 1 | 0.08% | 0.09% | 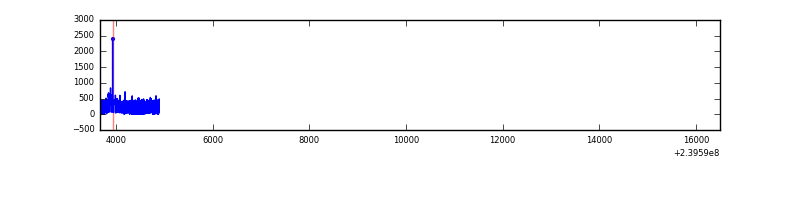 |
Top three noisy pixels from each quadrant. If the there are fewer than three noisy pixels in the level2.evt file, extra rows are filled as -1
| Pixel properties | Quadrant properties | ||||||
|---|---|---|---|---|---|---|---|
| Quadrant | DetID | PixID | Counts | Sigma | Mean | Median | Sigma |
| A | 15 | 239 | 82795 | 1095.12 | 361 | 353 | 75.3 |
| A | 8 | 15 | 48628 | 641.26 | 361 | 353 | 75.3 |
| A | 13 | 251 | 21952 | 286.91 | 361 | 353 | 75.3 |
| B | 4 | 81 | 51384 | 722.48 | 359 | 351 | 70.6 |
| B | 4 | 239 | 27184 | 379.88 | 359 | 351 | 70.6 |
| B | 5 | 255 | 17243 | 239.14 | 359 | 351 | 70.6 |
| C | 14 | 234 | 3229 | 33.42 | 362 | 364 | 85.7 |
| C | 13 | 61 | 2620 | 26.31 | 362 | 364 | 85.7 |
| C | 8 | 222 | 2033 | 19.46 | 362 | 364 | 85.7 |
| D | 1 | 52 | 5309 | 204.88 | 98 | 95 | 25.4 |
| D | 2 | 16 | 4787 | 184.37 | 98 | 95 | 25.4 |
| D | 2 | 234 | 4259 | 163.62 | 98 | 95 | 25.4 |
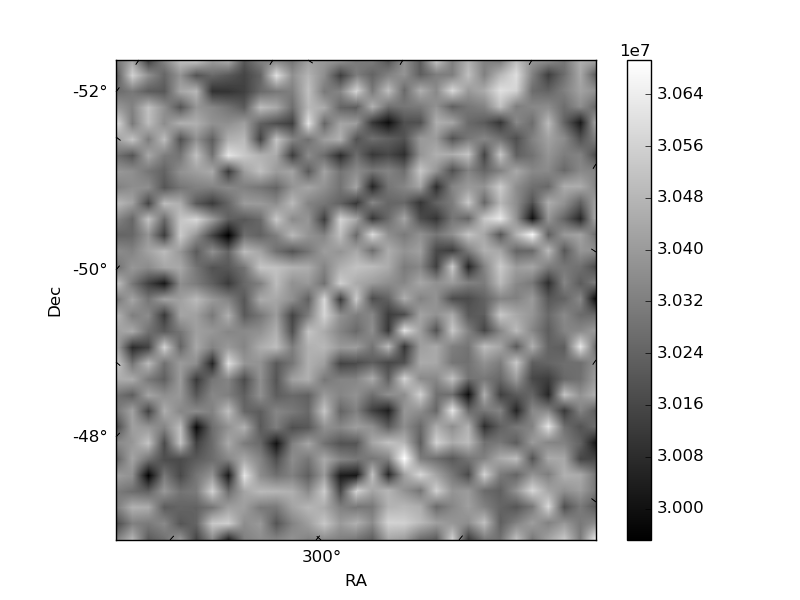
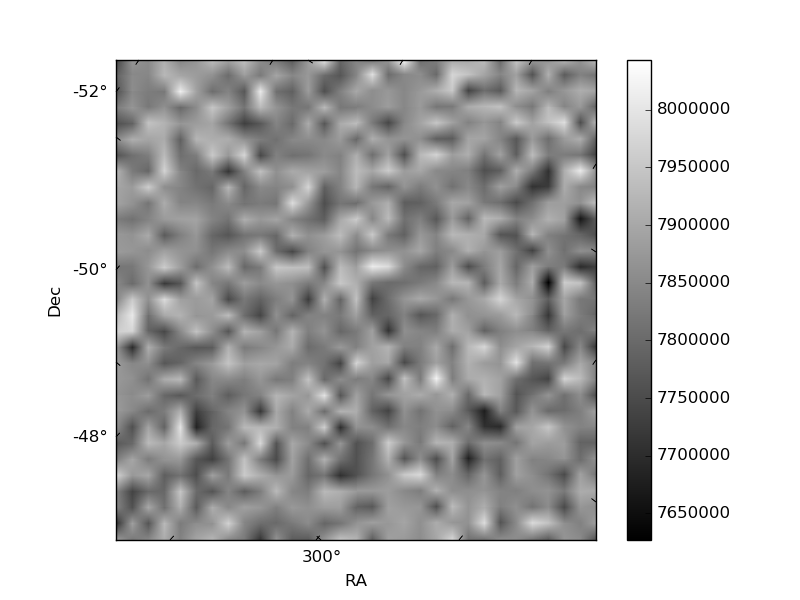
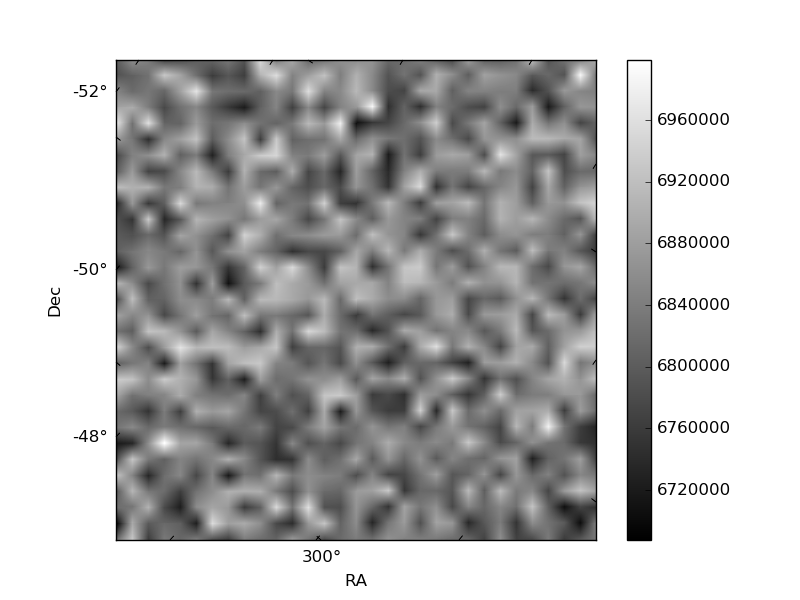
Histogram calculated using DETX and DETY for each event in the final _common_clean file
| Quadrant A | 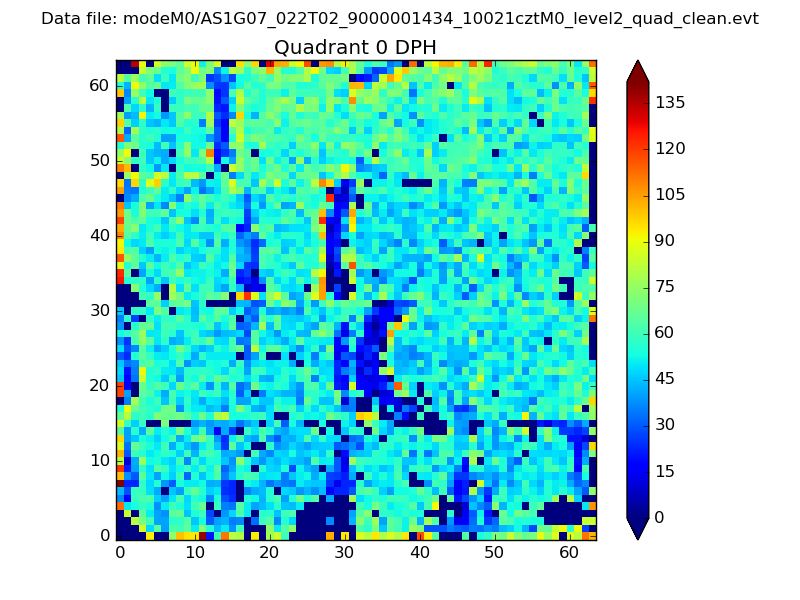 |
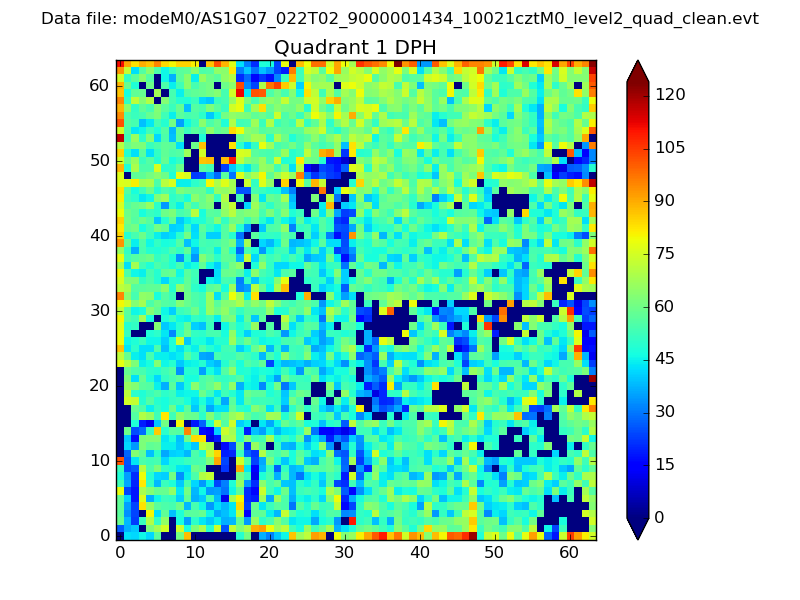 |
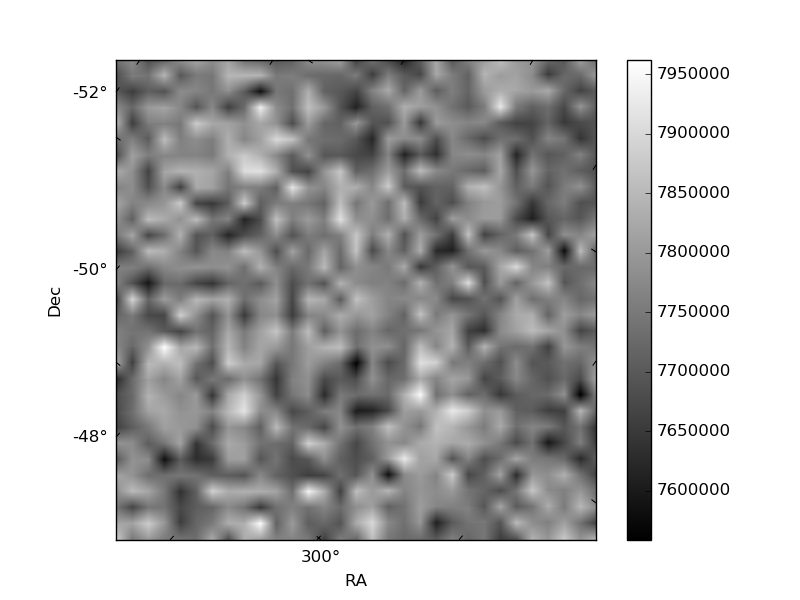
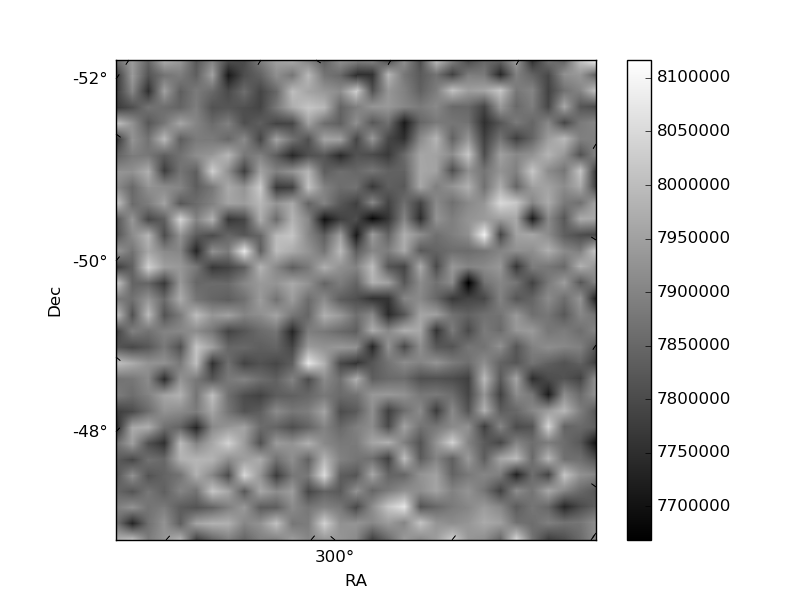
Quadrant B |
|---|---|---|---|
| Quadrant D | 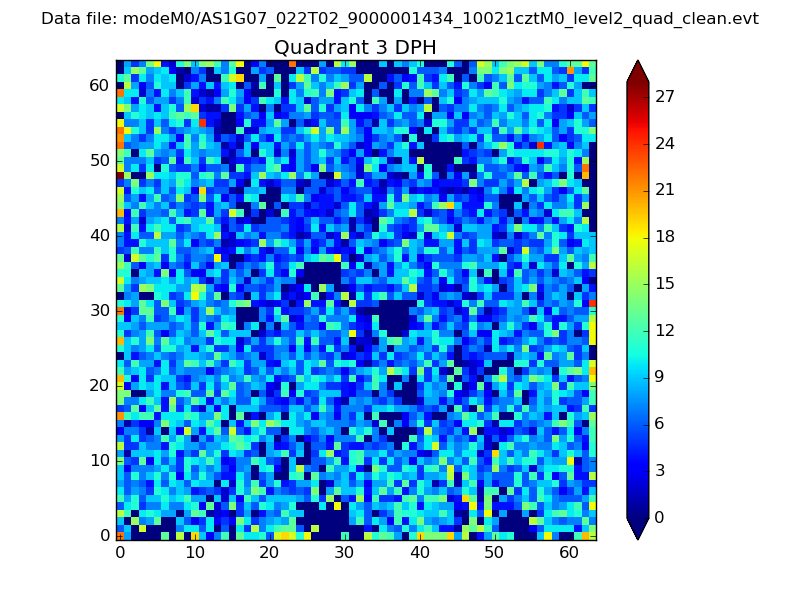 |
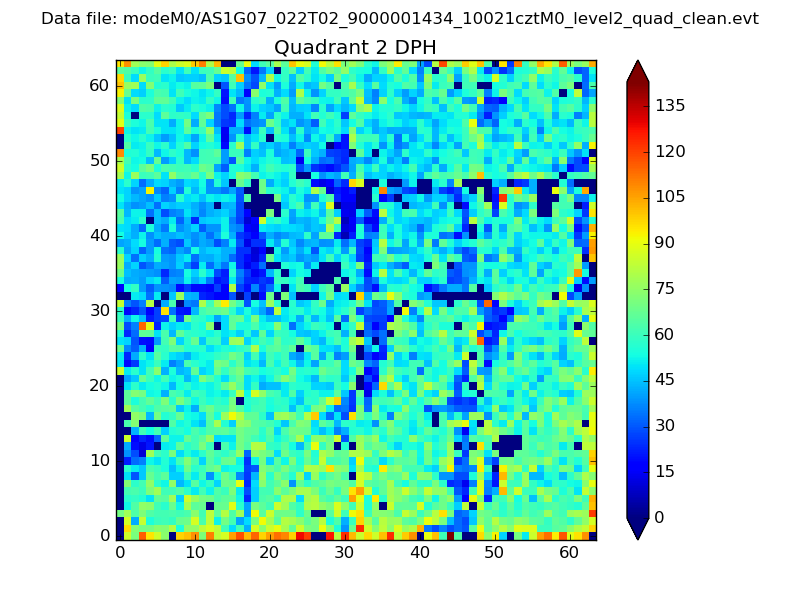 |
Quadrant C |
| Plot type | Count rate plots | Images |
|---|---|---|
| Comparison with Poisson distribution Blue bars denote a histogram of data divided into 1 sec bins. Red curve is a Poisson curve with rate = median count rate of data. |
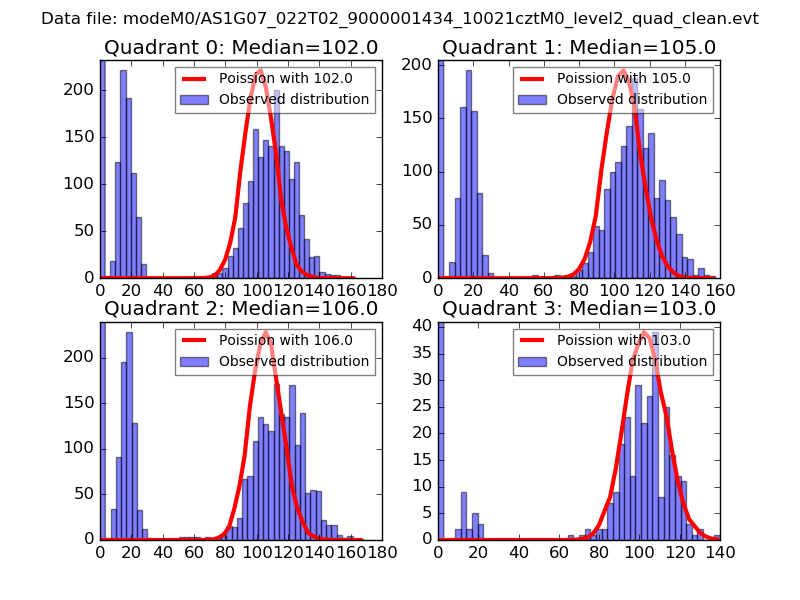 |
 |
| Quadrant-wise count rates Data is divided into 100 sec bins |
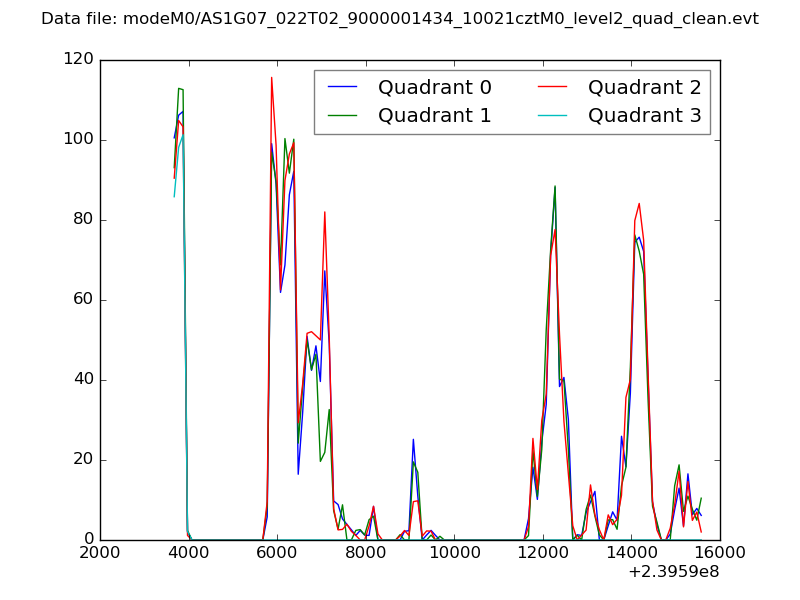 |
|
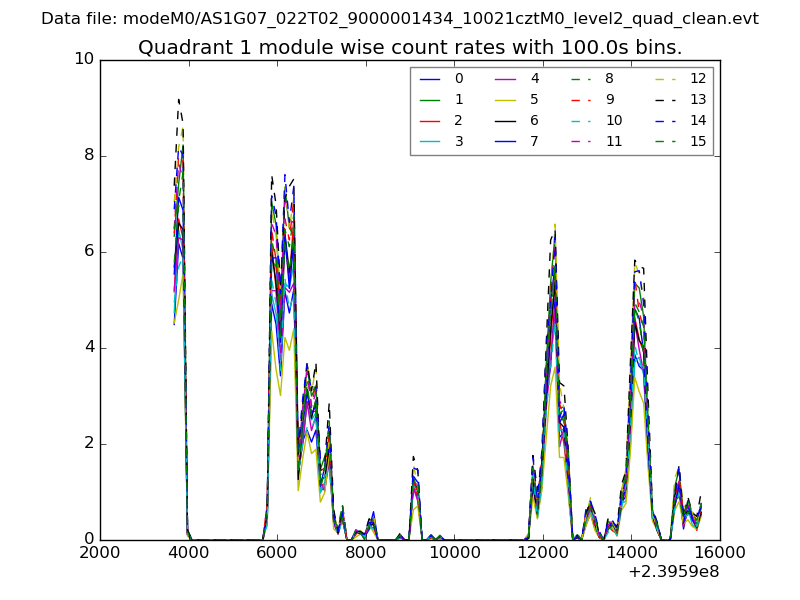
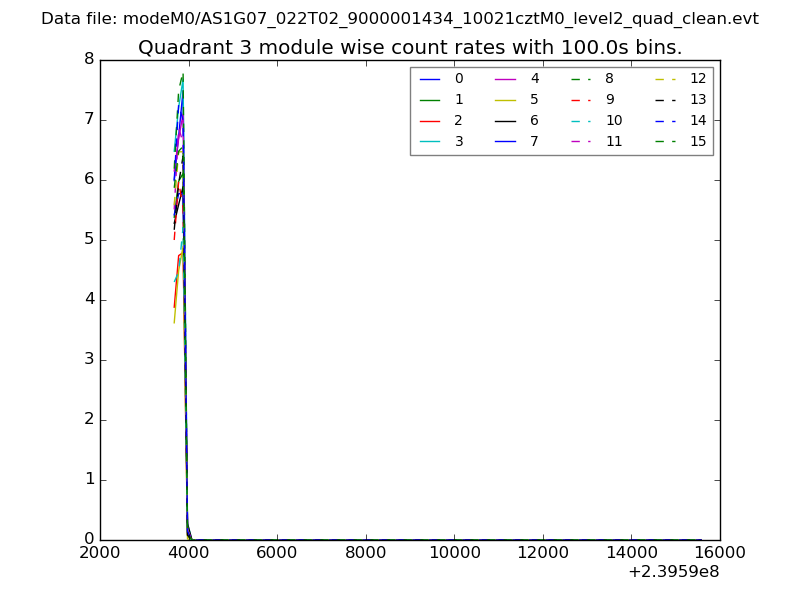
| Module-wise count rates for Quadrant A Data is divided into 100 sec bins |
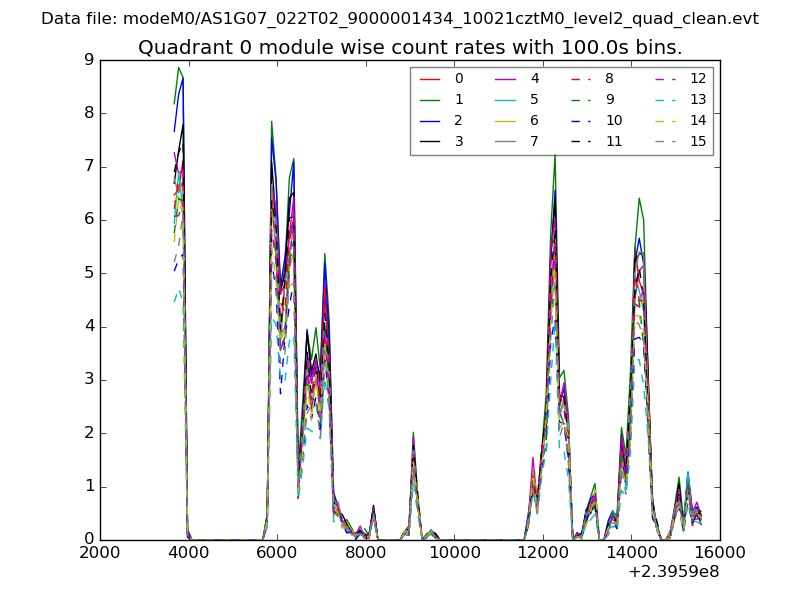 |
 |
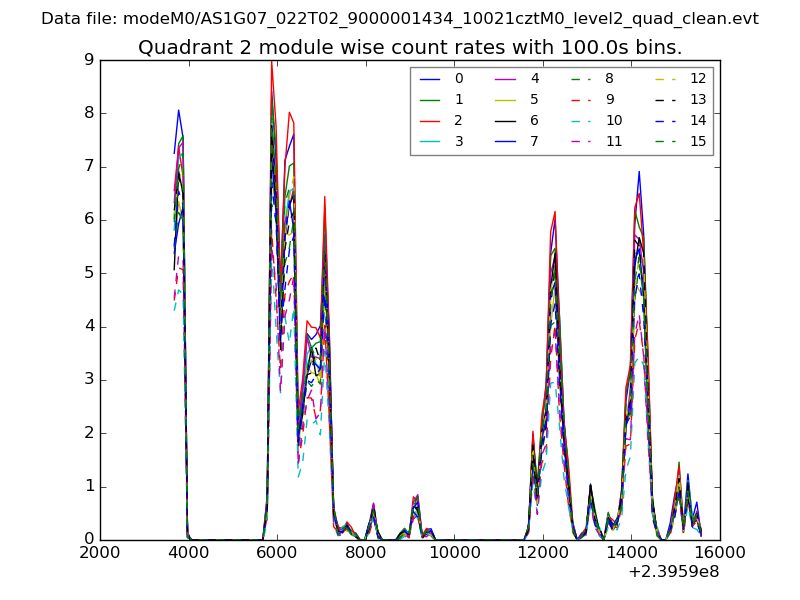
| Module-wise count rates for Quadrant B Data is divided into 100 sec bins |
 |
 |
| Module-wise count rates for Quadrant C Data is divided into 100 sec bins |
 |
 |
| Module-wise count rates for Quadrant D Data is divided into 100 sec bins |
 |
 |
| Parameter | Plot |
|---|---|
| CZT HV Monitor | 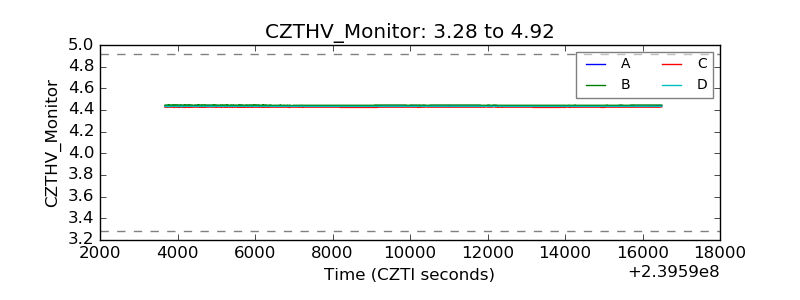 |
| D_VDD | 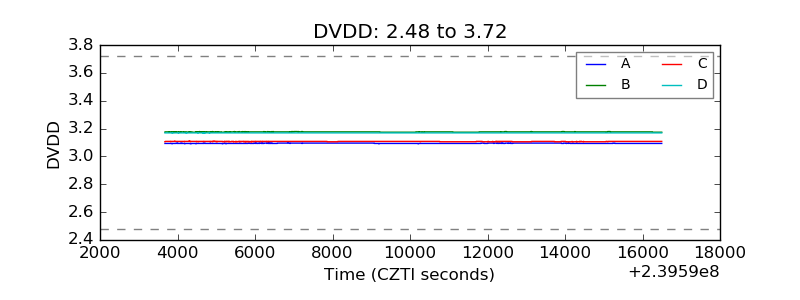 |
| Temperature 1 | 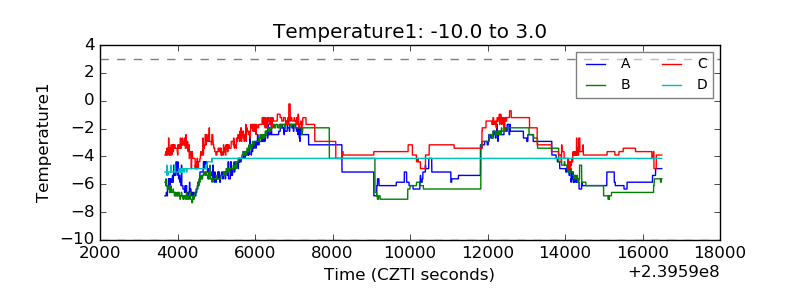 |
| Veto HV Monitor | 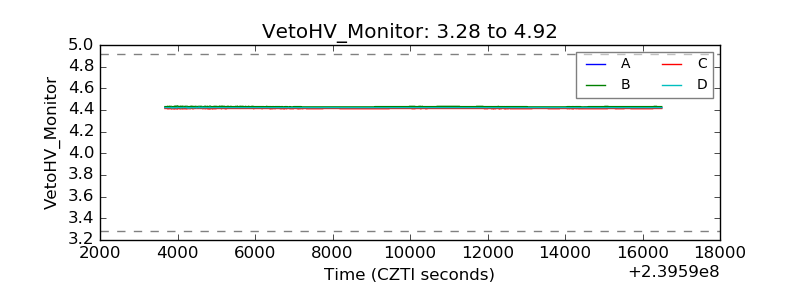 |
| Veto LLD | 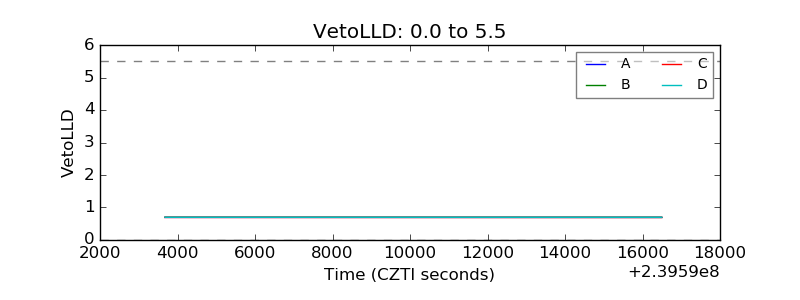 |
| Alpha Counter | 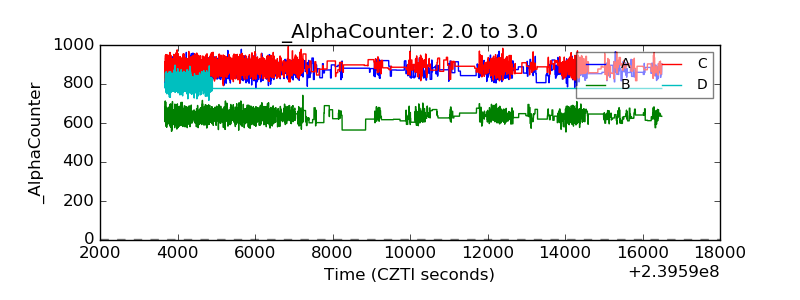 |
| _CPM_Rate | 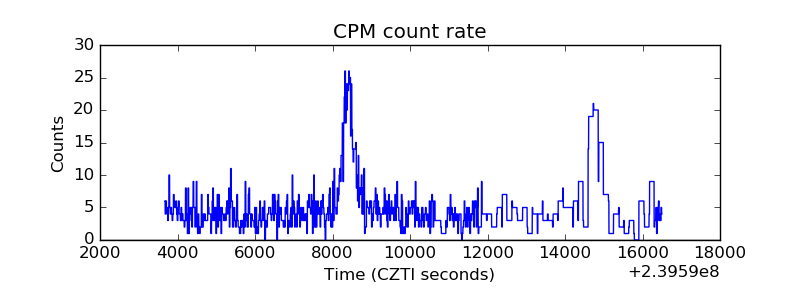 |
| CZT Counter | 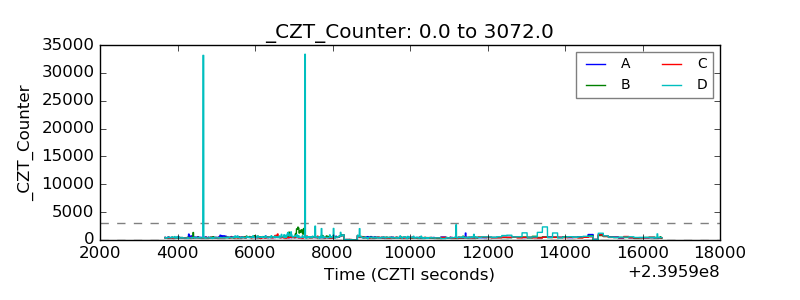 |
| +2.5 Volts monitor | 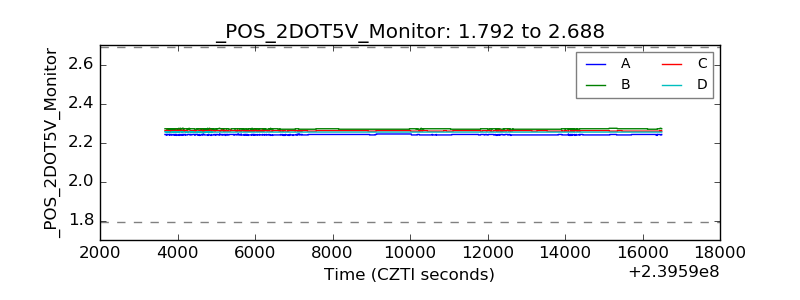 |
| +5 Volts monitor |  |
| _ROLL_ROT | 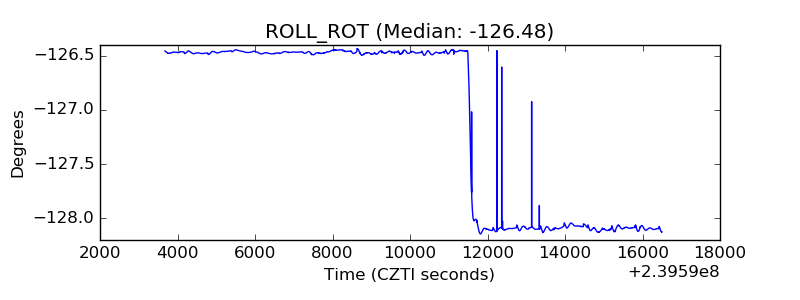 |
| _Roll_DEC | 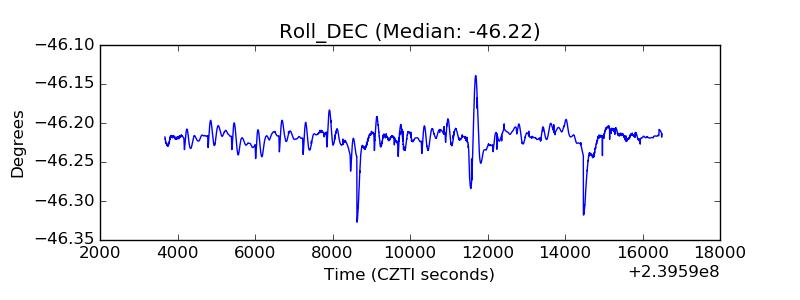 |
| _Roll_RA | 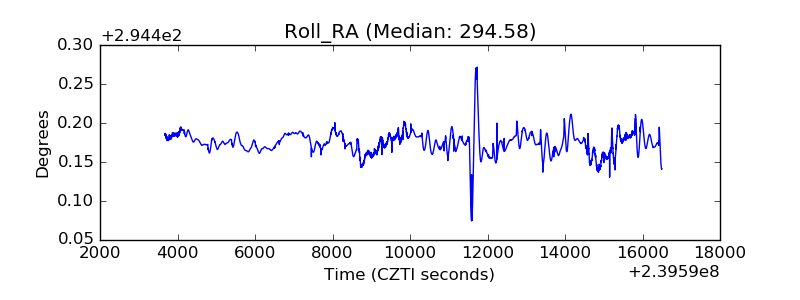 |
| Veto Counter | 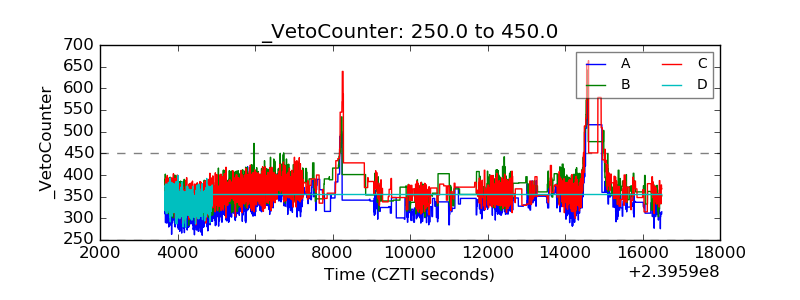 |